Fault Diagnostic Tab
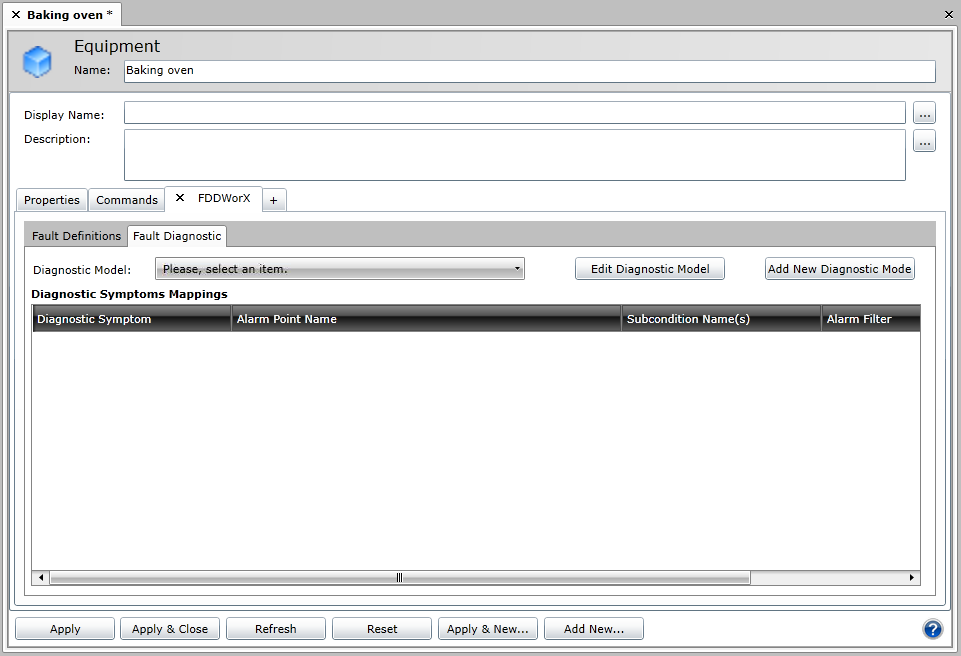
Once you have added the FDDWorX tab to the asset's Equipment form in the AssetWorX (and then added faults through the Fault Definitions tab) you can add Diagnostic Symptoms Mappings. The image below shows the initial state of the Fault Diagnostic tab within the Facility AnalytiX tab within the selected asset's properties.
|

|
Note: This tab is also available for equipment classes. All equipment classes are defined in AnalytiX Catalog in the Equipment Classes node. In AssetWorX, you can define and use equipment classes as templates for creating nodes in the asset tree. You can also use aliases in your equipment classes; these aliases will prompt you for actual properties for equipment as you use the equipment classes to define nodes in the asset tree. For more information, refer to the Introduction to Equipment Classes (Templates) and Creating Equipment Classes for Use as Templates topics.
|
Fault Diagnostic Tab in the FDDWorX Tab in the Equipment Form in AssetWorX
To Select a Diagnostic Model
-
If you have already created at least one Diagnostic Model in the FDDWorX provider in the Workbench, you can select one by clicking on the pulldown menu at the top of the tab window, as shown below. You can also Edit Diagnostic Model or Add New Diagnostic Model.
-
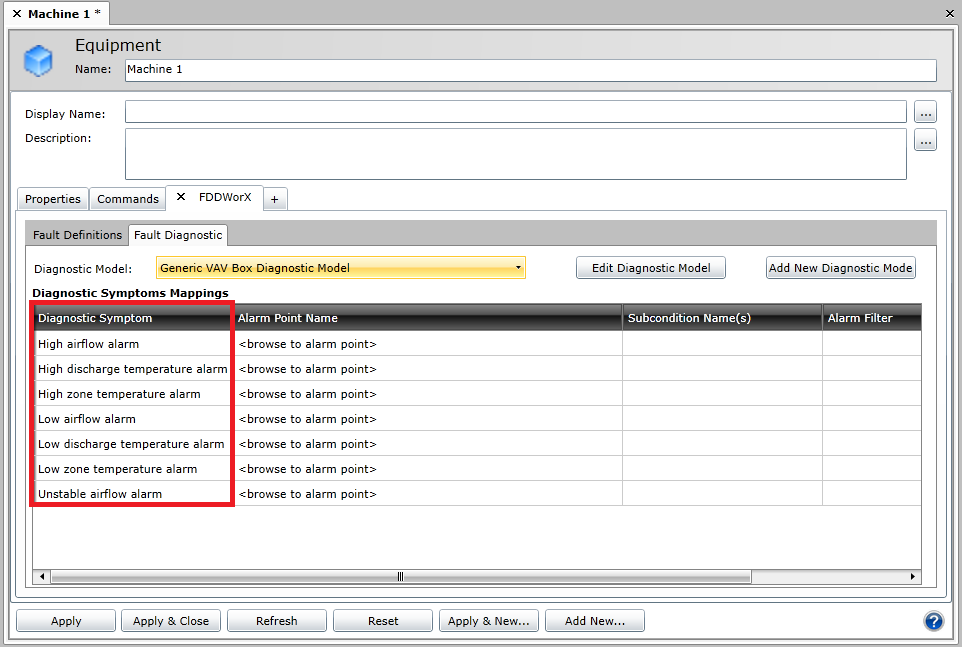
If you selected an existing diagnostic model, you'll notice that its Symptoms now populate the Diagnostic Symptoms Mappings grid within the Fault Diagnostic tab, as highlighted below. You can now associate Alarm Point Names to each Diagnostic Symptom.
Populated Diagnostic Symptoms in the Fault Diagnostic Tab
-
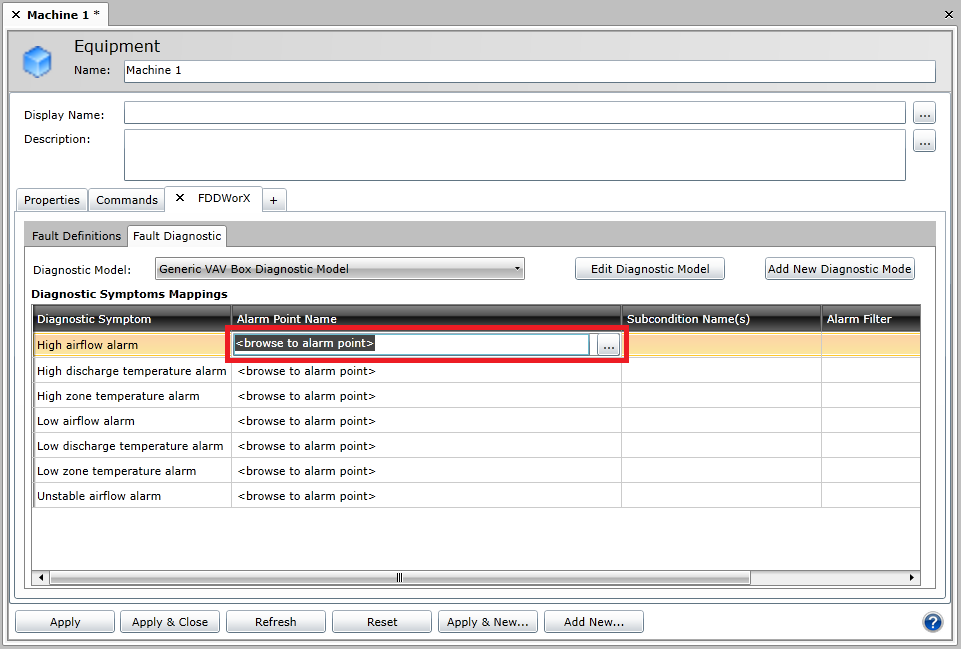
To associate Alarm Points to Diagnostic Symptoms, click on "<browse to alarm point>" to the right of your selected Diagnostic Symptom, in the Alarm Point Name column, as shown below. Next, click on the ellipsis button [...] to access the Data Browser and find your desired alarm point.
Selecting an Alarm Point
-
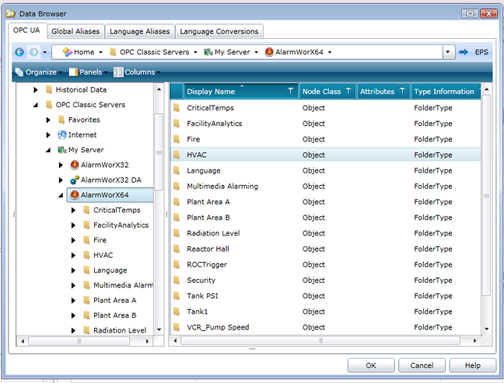
Clicking on the ellipsis button [...] opens the Data Browser, as shown below, which allows you to navigate to an alarm to associate with the selected Diagnostic Symptom. Once you have selected and alarm, click "OK" to proceed and return to the Fault Diagnostic Tab.
Selecting an Alarm from the Data Browser
-
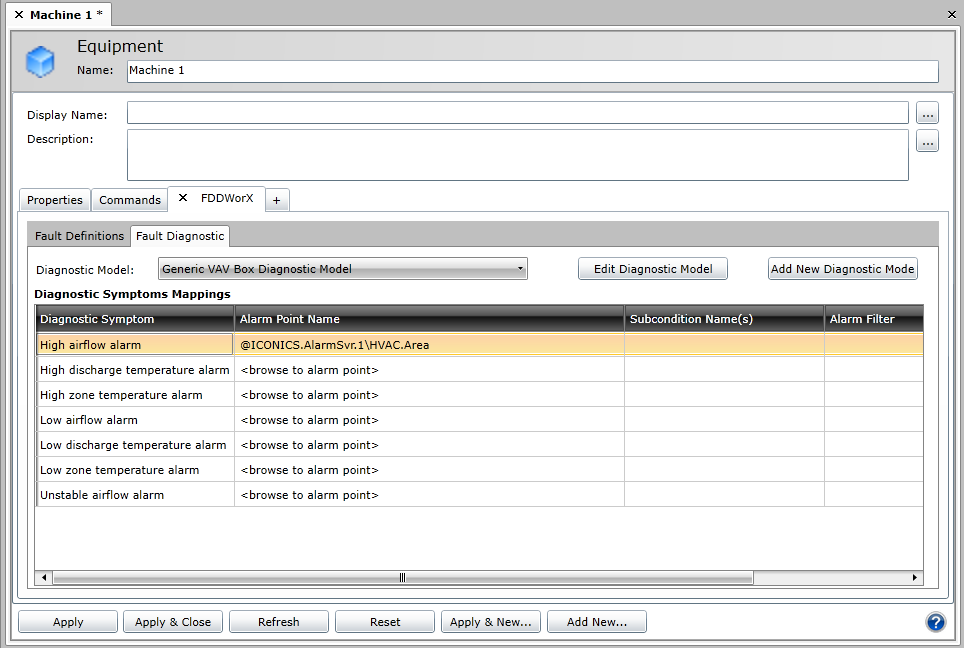
Your selected Alarm Point will now appear in the Diagnostic Symptoms Mappings grid, as shown below. At this time, you can set subconditions in the Subcondition Name(s) column by clicking on the ellipsis [...] button.
Entering Subconditions
-
Clicking on the ellipsis button opens the Device Subcondition Name window, as shown below. Make your selections, then click "OK" to return to the Fault Diagnostic tab.
Device Subcondition Name

-
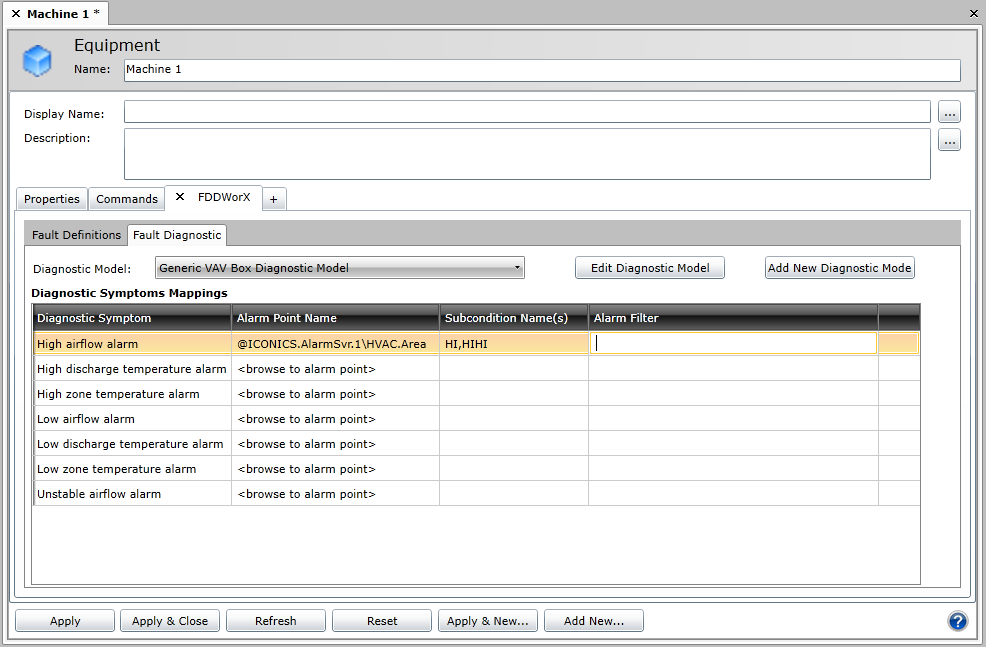
Once you have entered your subconditions, you'll see them appear under the Subcondition Name(s) column of the Diagnostic Symptoms Mappings grid. You can now enter an Alarm Filter in the far right column, as shown below.
Entering an Alarm Filter in the Diagnostic Symptoms Mappings Grid
-
In order to save the changed status of the Fault Diagnostic Tab (with the newly completed Diagnostic Symptoms Mappings), you must then either click on the "Apply" button at the bottom of the tab window within the Project Explorer (and can then proceed to make additional changes to the same Fault Diagnostic) OR click on "Apply & Close" to save your settings and then return to the main Project Explorer by closing the tab OR click on "Refresh" to update the Fault Diagnostic tab itself OR click on "Reset" to return the state of the Fault Diagnostic tab to the last saved settings OR click on Apply & New to save the current settings while creating a new fault diagnostic model/mappings OR click on Add New... to change the settings for an additional asset.
See Also
Define a Fault
Fault Definitions Tab
Add a FDDWorX Diagnostic Model to a Selected Asset
Using Diagnostic Matrices in the AssetWorX Provider