|
|
The features on this page require a GENESIS64 Advanced license and are not available with GENESIS64 Basic SCADA . |
|
|
The features on this page require a GENESIS64 Advanced license and are not available with GENESIS64 Basic SCADA . |
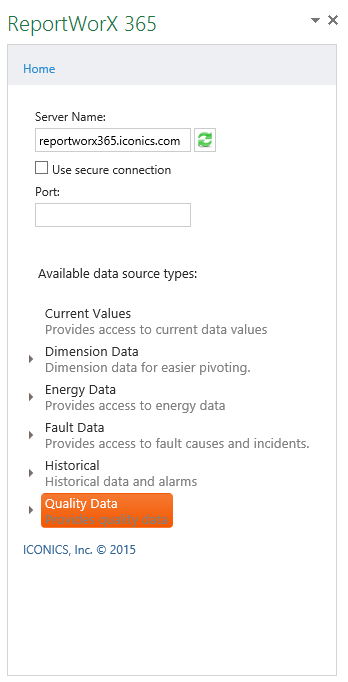
Selecting Quality Data as a data source in ReportWorX 365 allows you to select Quality Chart Data. This source provides quality data for use within Microsoft Excel.
Quality Data Selected in ReportWorX 365

The Quality Chart Data data source provides quality chart data for use within Microsoft Excel.
To Configure a Quality Chart Data Report:
Open the ReportWorX 365 add-in in Microsoft Excel. (See Installing ReportWorX 365 for more info). Place your cursor within the Microsoft Excel sheet where you wish the report data to appear.
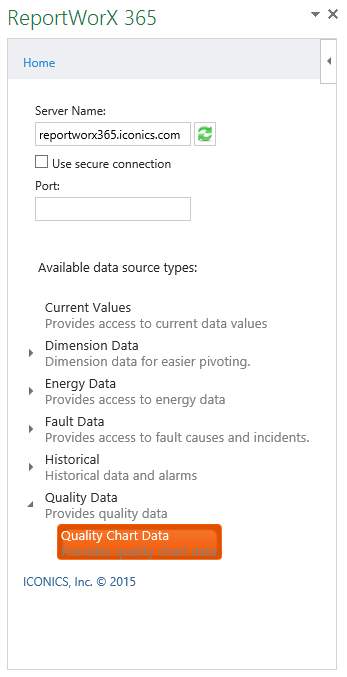
In the ReportWorX 365 add-in, select the Quality Data data source type, and then the Quality Chart Data data source type, as shown below.
Quality Chart Data Selected

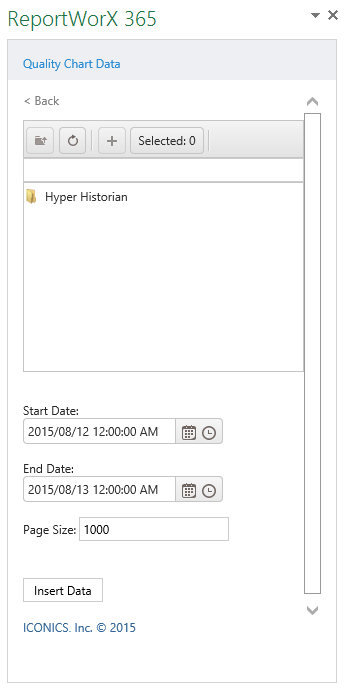
The Quality Chart Data task pane appears on the right-hand side of your screen, as shown below.
Configuring Quality Chart Data Report

Users can utilize the file explorer section of ReportWorX 365 to navigate to their desired data source.
The following navigation items can be used:
 - Move up one folder level in the file explorer
 - Move to the top folder level in the file explorer
 - Add the selected item. Note that you can add multiple contiguous items by holding the Shift key or multiple individual items by holding the Ctrl key.
 - This button updates with the number of selected items. Clicking the button when one or more items have been selected changes the file explorer view to a file selection view, showing the data source items that have been added via the
  button. In the file selection view, you can remove any selected data source by clicking on the [X] button to the right of its name.
Start Date - Enter a start date for the requested data in the text entry field. Or, click on the  to open the date selector tool and select a date and/or click on the
  to open the time selector tool and select a time.
End Date - Enter an end date for the requested data in the text entry field. Or, click on the  to open the date selector tool and select a date and/or click on the
  to open the time selector tool and select a time.
Page Size - Enter a page size for the retrieved data to be displayed within the current Microsoft Excel workbook. The default is 1000.
 - This button completes the process by inserting the selected data to the cell(s) selected in the main section of Microsoft Excel.
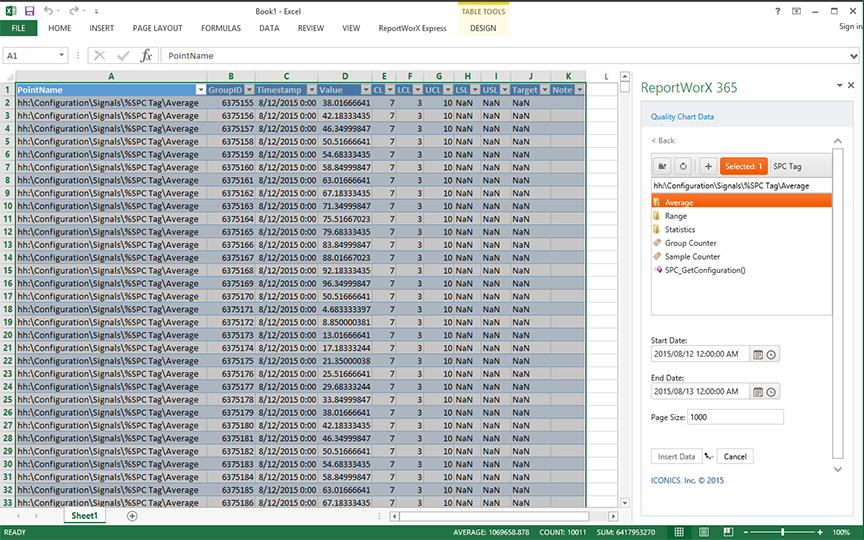
Once you have clicked the Insert Data button, the report (the combination of column headers and requested data) should appear in the specified location.
Quality Chart Data Report Example in Microsoft Excel

See Also: