Quality AnalytiX annotates several aspects of a trend display during runtime, both as the plot collects new data and in Freeze Mode. You can use this information to pinpoint the times at which your system produces unexpected or undesirable results.
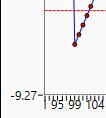
If you select a Sample Markers shape other than None when you configure an SPC plot, each SPC tag value that appears in the plot will appear as a small, color-filled shape. Usually, the sample value point is filled in with the color that you specify in the Sample Markers setting, but if the sample point triggers an alarm, it is filled in with the Alarm Trigger Fill color instead, as shown in the image below. If the sample point is part of an alarm sequence, it is filled in with the Alarm Sequence Fill color.
Points Triggering an Alarm within an SPC Plot
Since this color change is the only indication that an SPC tag value has triggered an alarm, it is not recommended to select the same color for Sample Markers and Alarm Trigger Fill.
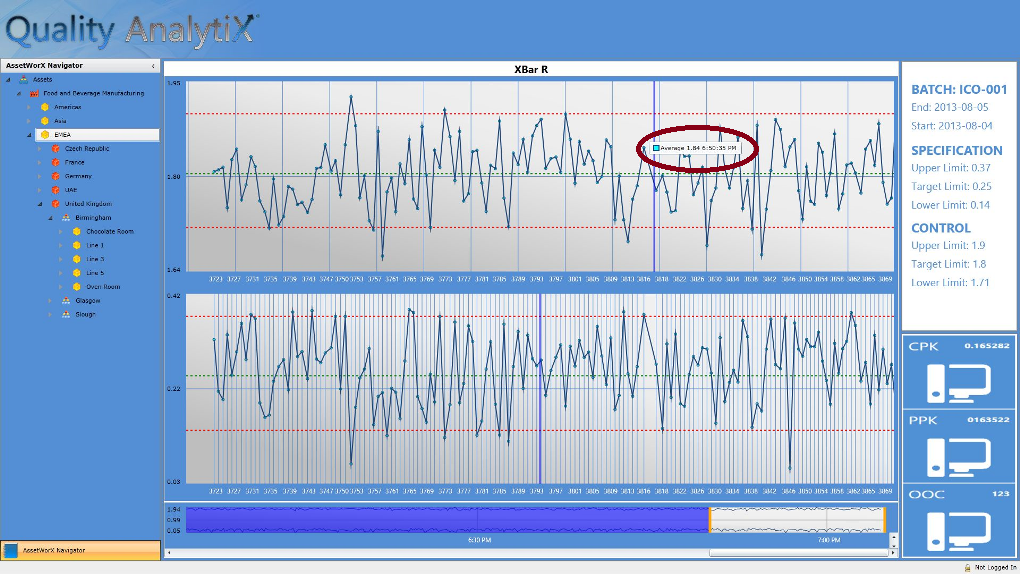
When you enter Freeze Mode in an SPC trend plot, you can drag the cursor that appears in the trend display. As this cursor passes over different locations along the time/sample axis, it displays the SPC tag value for that time. You can view these values to learn more about the status of your system at a specific point in time.
An example of this cursor annotation appears in the image below:
Sample SPC Plot with Cursor Displaying SPC Tag Value
See also: