Using ReportWorX Configurator from the ICONICS BizViz product suite, you can develop queries for displaying SPC plots, histogram plots, and tables describing your process in terms of sample measurements, group measurements, and alarm triggers. In particular, the group measurement queries provide you access to the capability calculations discussed in the Statistics Reference. You can also apply time- and group-based filters to your SPC data to view only the information you need to access in the report.
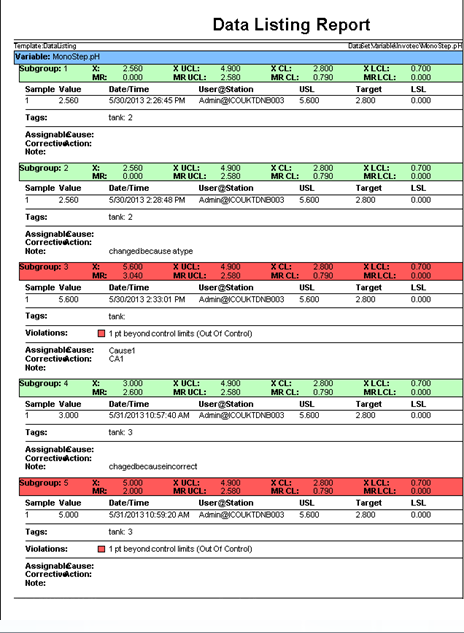
These reports list several values related to SPC calculations, including: X, MR, CL, USL, LSL, and target. They mark any values that violate associated SPC distribution rule sets by highlighting them in red. The reports even provide a set of corrective actions and assignable causes to help you rectify any performance issues within your system. You can view these reports in ReportWorX or ReportWorX Express.
An example of this type of report appears below:
Data Listing Report in ReportWorX Express
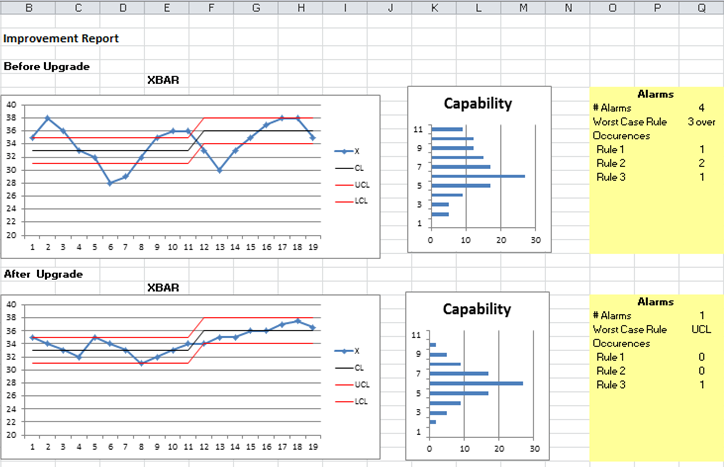
You can also use these reports to give you an overview of your system's current performance or extent of improvement after an upgrade, as shown in the image below:
Sample Quality AnalytiX Report -- Improvement after Upgrade
See also:
Creating Dashboards with Quality AnalytiX