You can create a dashboard for showing multiple perspectives of your SPC information at the same time. You can use this tool to provide operators with a quick overview of your system's productivity and make it easier for them to discover patterns that lead to lower-than-normal process capability.
Several layout options make it easy to develop a dashboard style that best fits your company's needs.
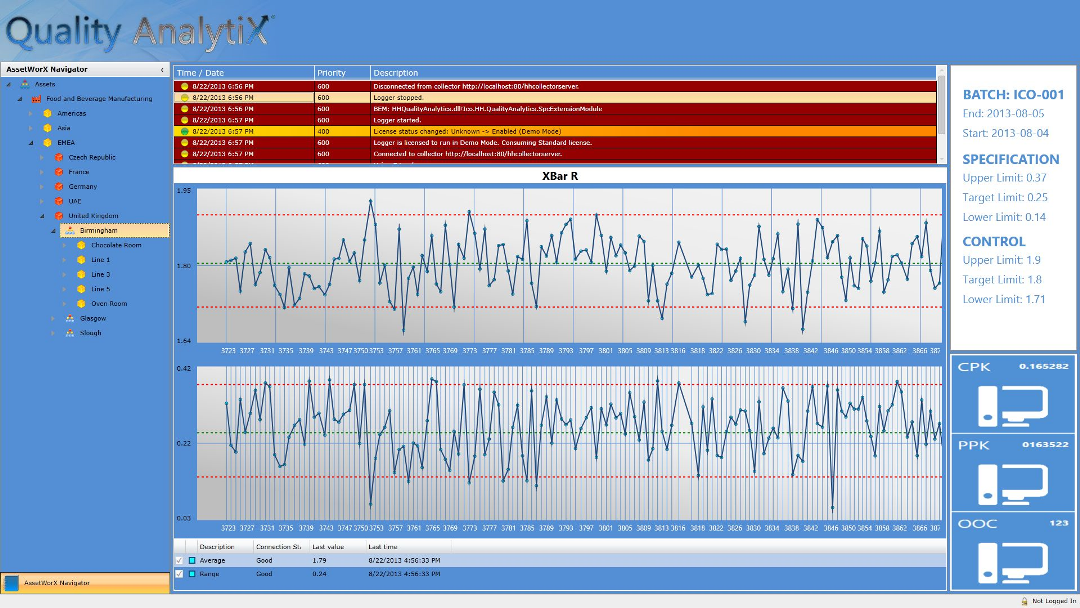
The following image shows a sample dashboard with some of the key components that you can use:
Sample Quality AnalytiX Dashboard
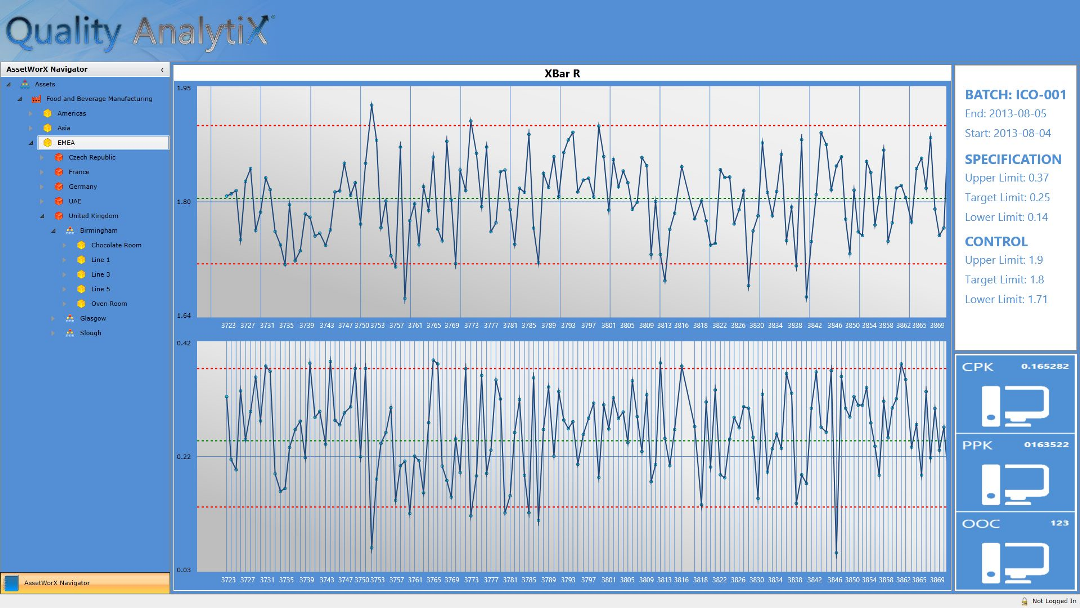
The SPC Trend component of this dashboard is highlighted in the image below:
Sample Set of SPC Plots within a Dashboard
See also: