![]()
Warning. Not all TrendWorX64 features are supported in Silverlight. If you are saving Silverlight files, refer to Silverlight Files in GENESIS64 for more information.
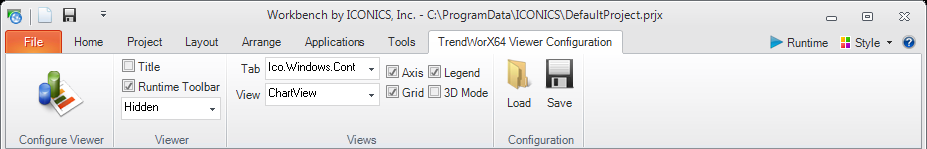
The TrendWorX64 Viewer Configuration ribbon contains the options which can be set for runtime. Some of the options affect Freeze mode, the Trend Period Tool Bar, and the Summary pane. each of which is described later in this topic. In Configuration Mode, you will see the effect that these options have on the trends within a chart, although only sample data is displayed in this mode. To see more information of the TrendWorX64 Viewer Configuration tab, see the Display Options topic.
|
|
Warning. Not all TrendWorX64 features are supported in Silverlight. If you are saving Silverlight files, refer to Silverlight Files in GENESIS64 for more information. |
|
|
Note: TrendWorX automatically filters out samples that overlap on the display, preserving minimum and maximum values whenever possible. This filtering process is performed only on the client side and therefore does not affect the trending data that resides on the server. |
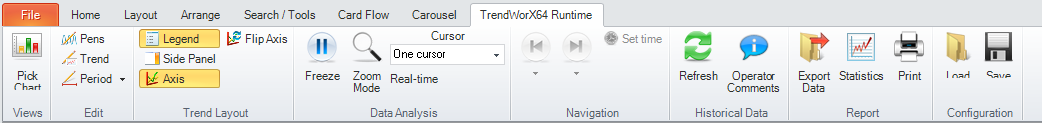
At runtime, a TrendWorX Viewer has its own runtime toolbar and runtime ribbon.
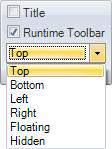
The toolbar is not necessarily visible or available at runtime unless you configure it to be available. Making it available is handy in case the runtime ribbon is not available. To make the TrendWorX toolbar available at runtime:
While in configuration mode you must enable the Runtime Toolbar check box on the TrendWorX64 Viewer Configuration ribbon or on the Appearance tab for Viewer objects within the TrendWorX64 Viewer Configurator.
To show and hide the TrendWorX toolbar at runtime, double-click the chart in runtime.
To show and hide the TrendWorX ribbon at runtime, double-click on the TrendWorX64 Runtime ribbon label. You can also right-click any area inside the ribbon and select the Minimize the Ribbon option. For additional details, refer to Showing the Ribbons and Menus in Runtime.
The TrendWorX toolbar and TrendWorX ribbon have the following buttons:
|
Toolbar button |
Ribbon button |
Description |
|
|
|
Pick Chart/Views: This button shows and hides details about TrendWorX views in the display. |
|
|
|
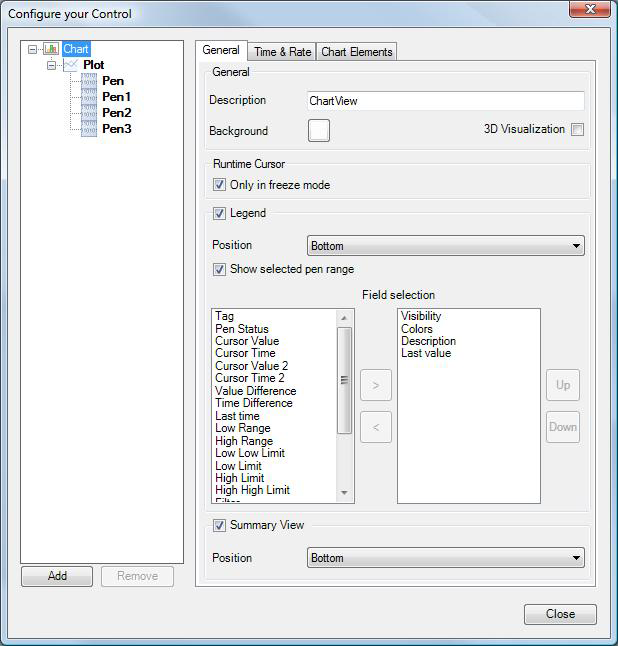
Edit Pens: This button opens the chart's Configure Your Control dialog box allowing you to modify your pens. This dialog box is a simpler version of the TrendWorX64 Viewer Configurator.
For help using this dialog box, refer to the Chart Options for Trends topic. You are still in runtime when the dialog opens. When you close the dialog box, your changes are reflected in the runtime chart. |
|
|
|
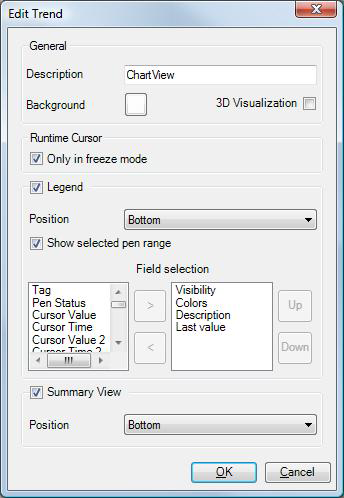
Edit Trend: This button opens the Edit Trend dialog box. You are still in runtime this dialog box is open, and your settings are visible as you select them. In this dialog box you can:
|
|
|
|
Edit Trend Period and Rates: When you click the right side of the ribbon button a list appears. You can select an interval of time to display on the time axis of the displayed chart from this list. The possible options are: 1 Minute, 15 Minutes, 30 Minutes, 1 Hour, 4 Hours, 8 Hours, 12 Hours, 1 Day, 1 Week, or 2 Weeks.
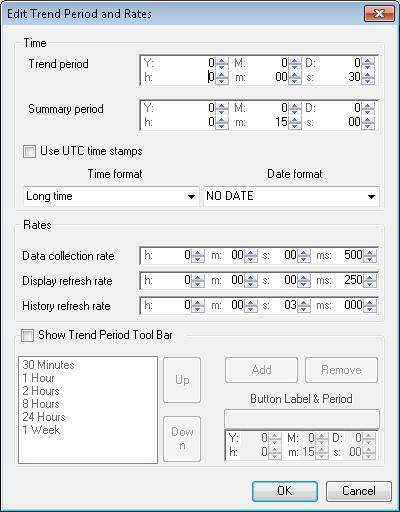
When you click the left side of the ribbon button or the button on the runtime toolbar you open the Edit Trend Period and Rates dialog box. You are still in runtime while this dialog box is open. You can set the following properties here:
|
|
|
|
Show/Hide Axes: This button shows or hides the X and Y axis labels. Hiding them gives your chart more room to display. |
|
|
|
Swap Y/X Axes: This button switches the X axis with the Y axis, which may make the chart easier to read. This is the same effect that a strip chart recorder uses. |
|
|
|
Enter/Exit Zoom Mode: Click the Zoom button and then click and drag a rectangle on that part of the chart that you want to zoom in on. Clicking this button enters Zoom mode; the viewer sets the trend period to the boundaries of your selection. To exit Zoom mode, click the button again. |
|
|
|
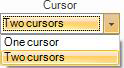
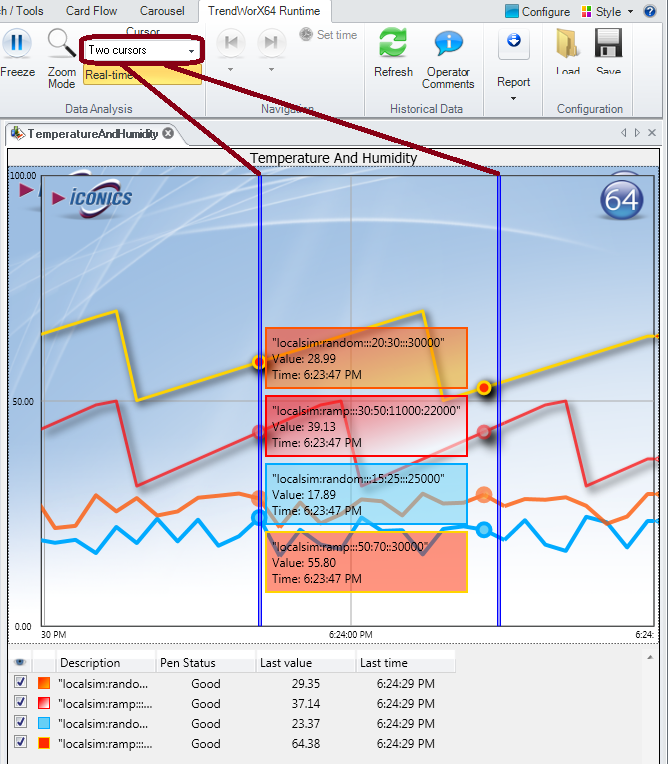
Select the number of cursors in Freeze mode: This is a tool that helps you analyze the data in runtime. After you collect data and activate Freeze mode, there’s a thick blue line that you can drag along the trend. This is a cursor. It shows you the data values of the pens at that point where you drag the line to. You can activate a second thick blue line (or cursor) by selecting Two Cursors from this drop-down list. You can do this if you want to compare data from two different instants of time. For an illustrated example, refer to Freeze Mode below in this topic. |
|
|
|
Causes the Freeze mode cursor(s) to appear not only in Freeze mode but also while collecting the data. For an illustrated example, refer to Freeze Mode below in this topic. |
|
|
|
Freeze/Unfreeze Trend: Enter and exit Freeze mode. In Freeze mode, you are still collecting data, but the chart display does not display this new data. When you leave Freeze mode, all of the data collected that would have been displayed while you were in freeze mode appears in the chart. For more information, refer to Freeze Mode later in this topic. |
|
|
|
Previous Trend Page and Next Trend Page: Skip back or forward in trend history. These buttons are active only when you are in Freeze mode. |
|
|
|
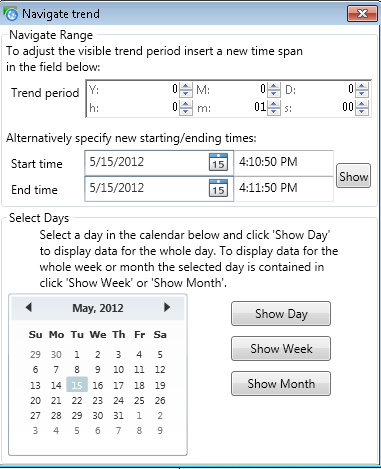
Set Right Time: Enter the time you want to view in the Navigate trend dialog box. When you click OK or Apply the cursor moves to that time. This button is active only when you are in Freeze mode. |
|
|
|
Show/Hide Legend: The Legend displays data for the chart's pens. The legend's location and the properties that appear in the legend are determined during configuration of the chart. For a description of all possible legend properties, refer to the Legend Options for Trend Charts topic. |
|
|
|
Show/Hide Operator Comments: Shows and hides comments (if any) that operators have made about data on the chart. When the button is yellow, comments are showing; when the button is plain, comments are not showing. |
|
|
|
Refresh Data: Refreshes the data that displays in the chart. |
|
|
|
Show/Hide the Side Panel: Shows or hides the side panel of the trend chart. For more information, refer to the Side Panels for Trends topic. |
|
|
|
Export Data: Opens a report of trend data. For detailed information, refer to the Exporting Trend Data topic. |
|
|
|
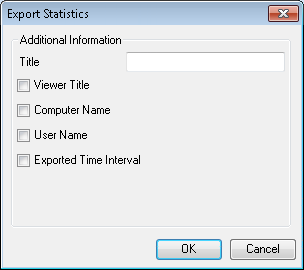
Statistics: Writes pen statistics to a report. Clicking this button opens the Export Settings dialog box so you can add a title, and select options to appear in the statistics report that is produced. For more information refer to the Statistics Report for Pens in a Chart topic. |
|
|
|
Print: Lets you print the TrendWorX Viewer, the active view, or a single chart, and provides a preview before printing. |
|
|
|
Load: Loads a TrendWorX64 Viewer configuration from a file. |
|
|
|
Save: Saves changes to the configuration file. |
Use Freeze mode to stop the trend display from moving so you can examine your runtime data in a static display. During Freeze mode data is still collecting, but the trend chart does not refresh to reflect incoming data. In Freeze mode you can view any operator comments that have been created for historical pens during the current trend period.
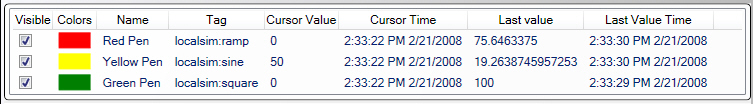
Also in Freeze mode, there is a blue line, called a cursor, that you can drag anywhere in the trend window. This cursor, when you grab it, displays the description, value, and time for each pen at the cursor's current location. If you add an operator comment to a historical pen, it appears at this cursor location. The cursor can even display a pen's text-based (String) or blank/empty (null) values.
The Cursor option in the TrendWorX ribbon lets you display a second cursor if you want to compare data from two different points in time. The example below shows two cursors in use. Note that if you click the Real-Time button, these same cursors will remain after you leave Freeze mode.
|
|
Note: If you wish to hide the cursor that normally appears in Freeze Mode, open the TrendWorX64 Viewer Configurator in Configuration mode, navigate to the selected chart's Advanced settings, and set the ShowCursor property in the Cursor category to False. |
Two Cursors in Freeze Mode, with Data Displayed for Cursor 1.
(This image was taken without the Summary pane to make the example easier to read.)
When in the toolbar changes slightly. A slider displays that allows you to see a different time period of data, by moving the slide bar left and right.
To switch between runtime mode and freeze mode:
Click the Freeze button ![]() on the Runtime toolbar to go into freeze mode.
on the Runtime toolbar to go into freeze mode.
Click the Freeze button on the Runtime toolbar again to leave freeze mode and display current runtime data.
You can move your view by any of the following operations:
Click the previous trend page and next trend page buttons in the runtime toolbar to move the cursor back or forward a short amount of time.
Move the focus in the Summary pane, which is described below in this topic, to move the cursor back or forward a large amount of time.
Click the Set Right Time button on the runtime toolbar and enter the time you want the cursor to display at in the Navigate trend dialog box.
Click the Period button in the runtime toolbar ![]() or the Period button in the TrendWorX ribbon
or the Period button in the TrendWorX ribbon ![]() to change the period length displayed in the detail view and in the summary view. You can also select a specific period length using the Trend Period Tool Bar (shown beneath the plots).
to change the period length displayed in the detail view and in the summary view. You can also select a specific period length using the Trend Period Tool Bar (shown beneath the plots).
A summary view, if enabled, also appears below the trend chart; this summary is described in more detail later under the Summary Pane heading.
When you leave Freeze mode, TrendWorX64 Viewer displays the trend data you would have seen had you stayed in runtime mode. The chart refreshes with the data that is current for the trend period in the window.
You may want to view data collected over a specific period of time within a chart. The Trend Period Tool Bar provides options for selecting different periods of time to view a trend. This toolbar is hidden in TrendWorX64 Viewer by default, but you can show and even customize it within the Show Trend Period Tool Bar section of the Time & Rate Tab, which appears as a Chart tab within the TrendWorX64 Viewer Configurator.
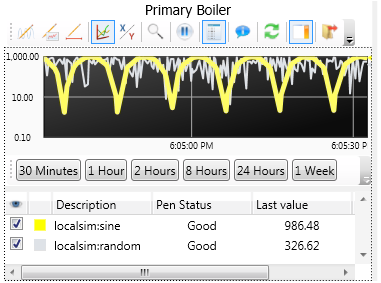
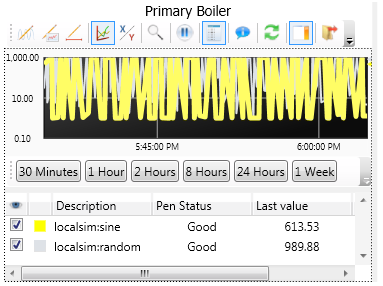
The images below demonstrate how the chart's appearance changes before and after selecting the 30 Minutes button on the Trend Period Tool Bar:
The TrendWorX Viewer's Trend Period Tool Bar Before and After Selecting "30 Minutes" Button
|
Before Selecting "30 Minutes" Button |
After Selecting "30 Minutes" Button |
|
 |
 |
If you use the Trend Period Tool Bar within a TrendWorX64 Viewer window inside a GraphWorX64 display, the buttons within the Trend Period Tool Bar will not resize with the TrendWorX64 Viewer window. Therefore some buttons on the toolbar may disappear if the TrendWorX64 Viewer window becomes small. To access these buttons, click on the gray arrow on the right edge of the tool bar. The hidden toolbar buttons will appear beneath and to the right of this gray arrow.
|
|
Note: You can resize the TrendWorX64 Viewer window inside a GraphWorX64 display only in Configuration mode. |
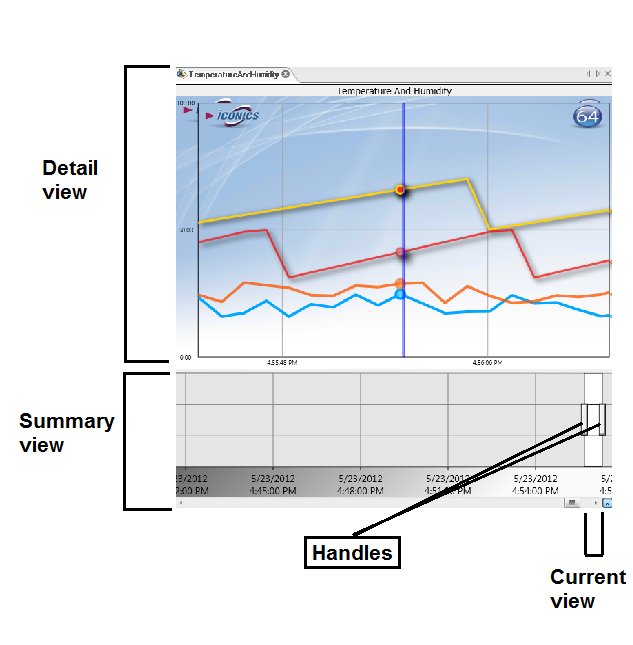
Over time you can collect much more data in the data buffer than you can display in Freeze mode. The Summary View pane gives you a way to view all collected data while moving your detailed view through time. When you hold the mouse cursor over the Summary pane, handles appear which you can grab and move, letting you focus in on one period of time.
The TrendWorX Viewer's Summary Pane
To display the Summary View:
In Configuration mode, click the Configure Viewer button on the TrendWorX64 Viewer Configuration ribbon.
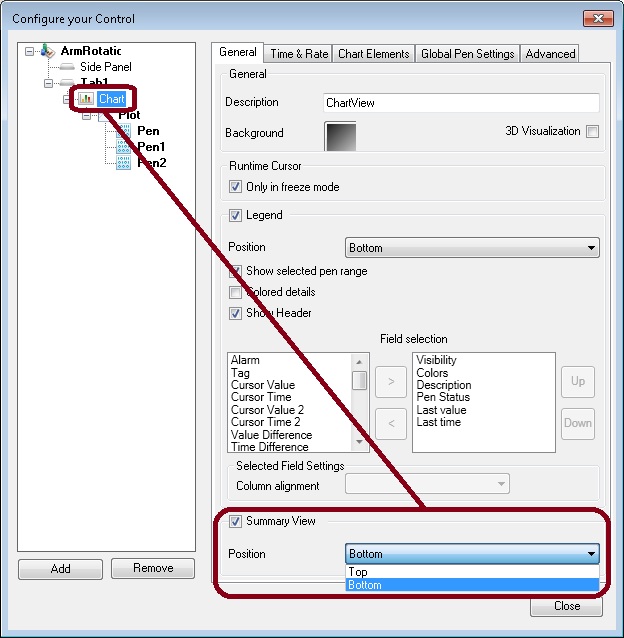
Select Chart from the tree control.
Put a check mark in the Summary View check box in the Summary View section.
Select the Position where you want the Summary View to display: either at the Bottom or the Top of the chart.
See also: