
To Add an Analyzer Group:
Open the Workbench and expand the Project Explorer and then the Internet of Things node.
Right-click the Analyzer Groups node then click on Add Analyzer Group from the dropdown menu, as shown below.
Adding an Analyzer Group from the Project Explorer
-OR-
Select the Analyzer Groups node in the Project Explorer then click on the Add Analyzer Group button, shown below, in the Edit section of the Home ribbon in the Workbench.
Add Analyzer Group Button

This opens the Analyzer Group properties, shown below, which are comprised of an Assets tab and a Faults and Diagnostics tab. Enter a name for the new Analyzer Group in the Name text entry field.
Analyzer Group Properties

Analyzer Group Properties - Assets Tab
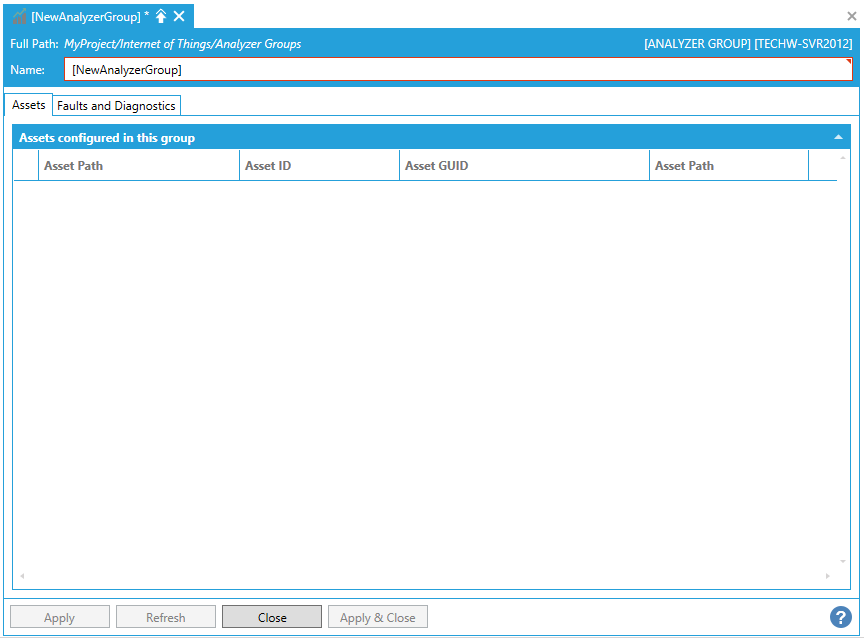
Assets configured in this group
For assets configured in the Analyzer Group, multiple properties will be listed including Asset Path, Asset ID, Asset GUID, and Asset Path.
Analyzer Group Properties - Faults and Diagnostics Tab

Navigation Settings
Current asset -Use the pulldown menu to select a current asset from those associated with the Analyzer Group.
Show faults details - Click this checkbox to show additional fault details (including Related Values 1 - 20, if any) in the Faults associated to the asset section below.
Faults associated to the asset
This section will display properties of the faults that are associated to the selected asset, including Name, Description, Enabled, Severity, Rule Expression, Cost Expression (and Related Values (1-20) if the Show faults details checkbox is checked).
Diagnostic model associated to the asset
This section will display the diagnostic model, including Causes, of the diagnostic model associated to the asset.
Once you have verified your settings, click on the Apply button and then the Close button to return to the Workbench.
See Also:
IoTWorX Configuration in Workbench