
To Create a New Data Flow:
Open the Workbench, then expand the AnalytiX node and then the BI Server node. Right-click on the Data Flows node (or a Data Flow Folder), then select Add Data Flow, as shown below.
Add Data Flow in the Project Explorer in the Workbench
-OR-
Select the Data Flows node (or a data flow folder), then select Add Data Flow (shown below) in the Edit section of the Home tab in the Workbench.
Add Data Flow Button

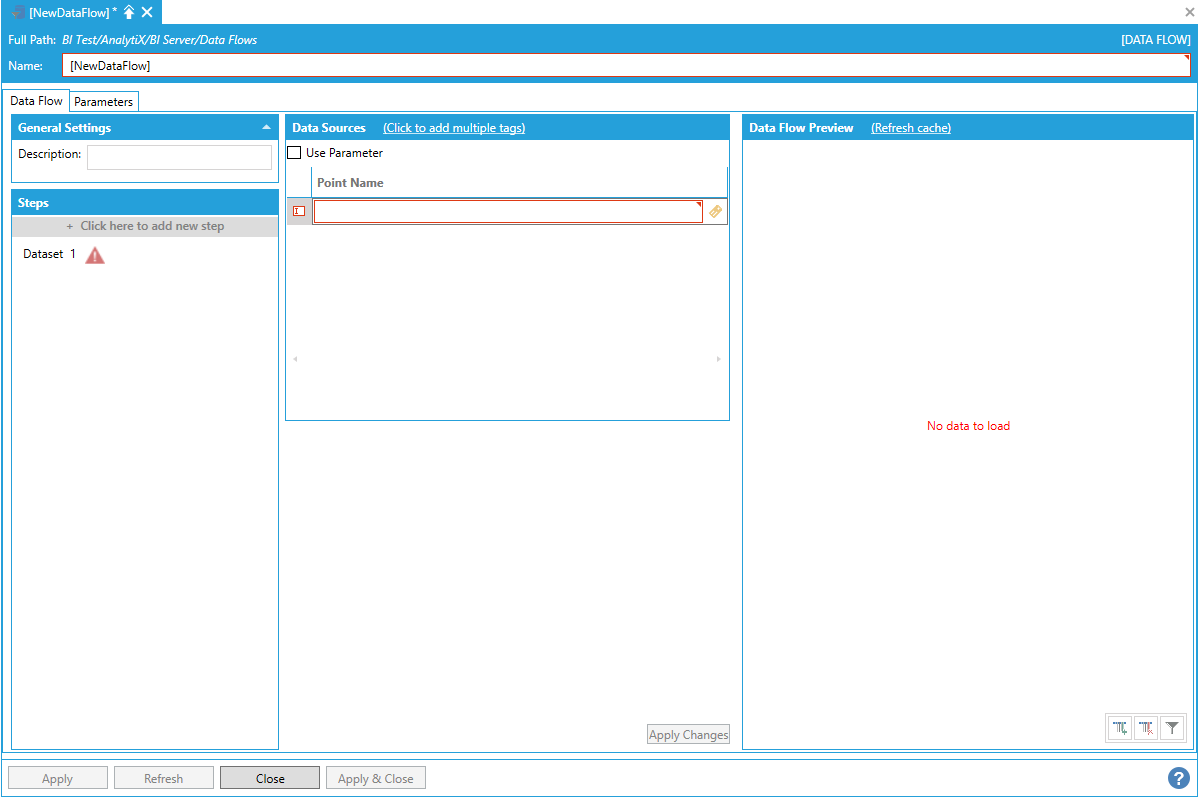
This opens the Data Flow properties window, as shown below. Enter a name for the data flow in the top text entry field.
New Data Flow Properties
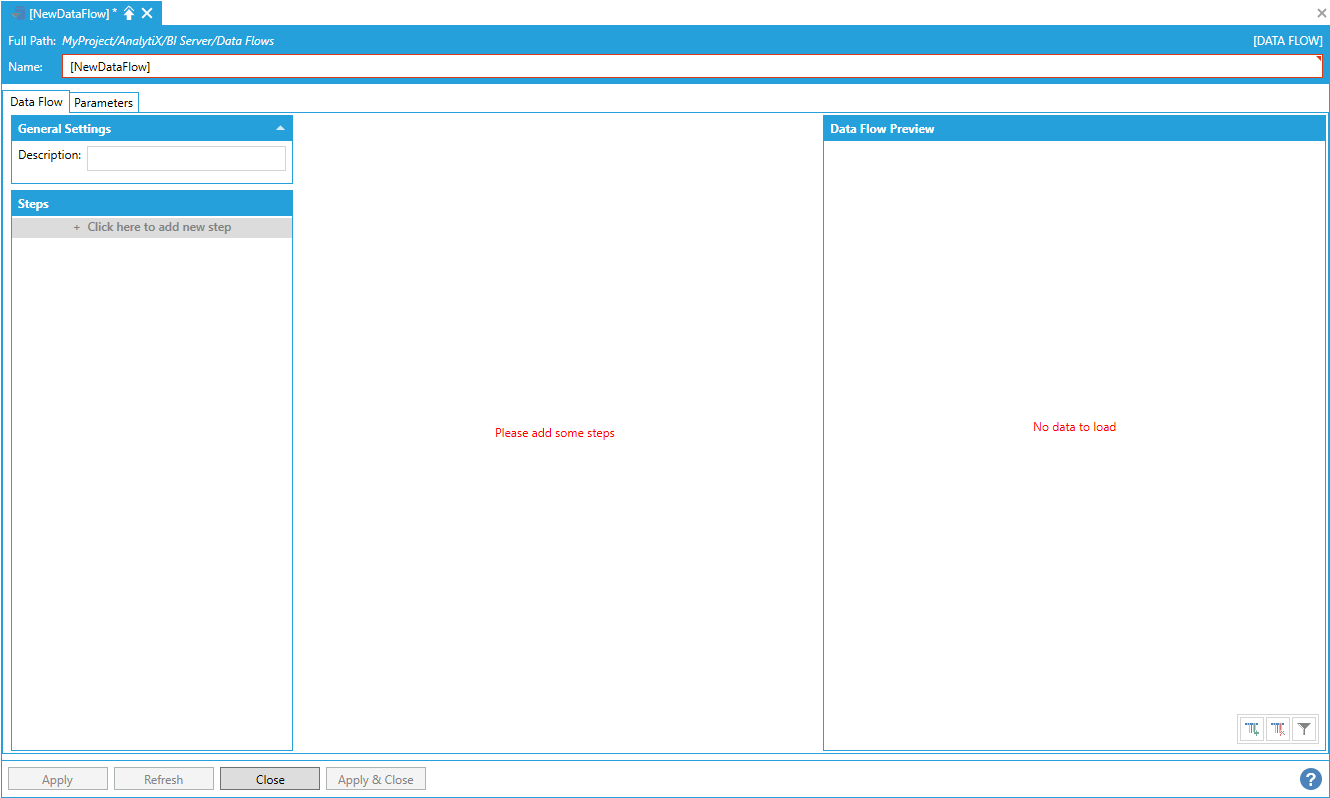
To start configuring the data flow, click on the + Click here to add new step button to display the list of available steps. For example, add the Data Sources > Hyper Historian > Hyper Historian Raw Data step.
Adding the Hyper Historian Raw Data Step
Hyper Historian Raw Data Step

Once the step is added, the configuration settings for the step will be displayed.
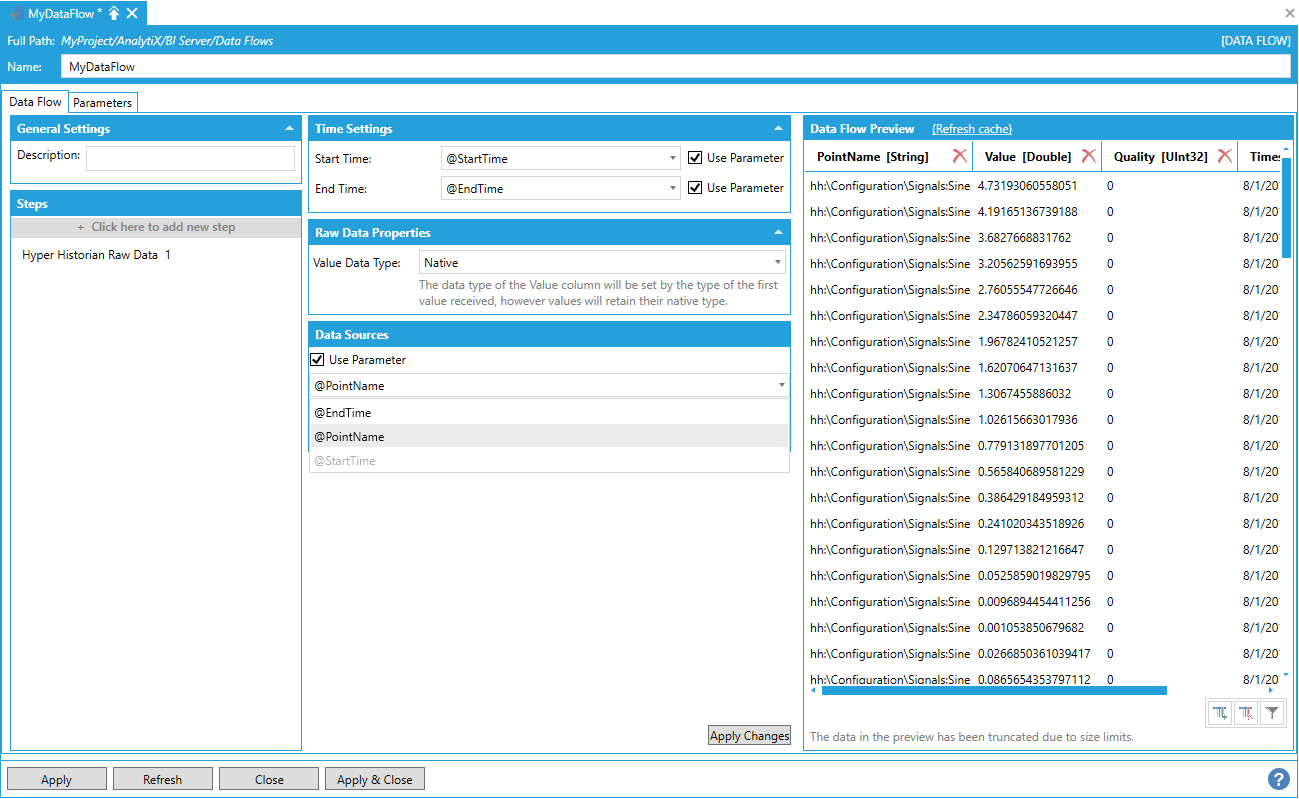
Configuration Settings for the Hyper Historian Raw Data Step
Configuration Settings for the Hyper Historian Raw Data Step
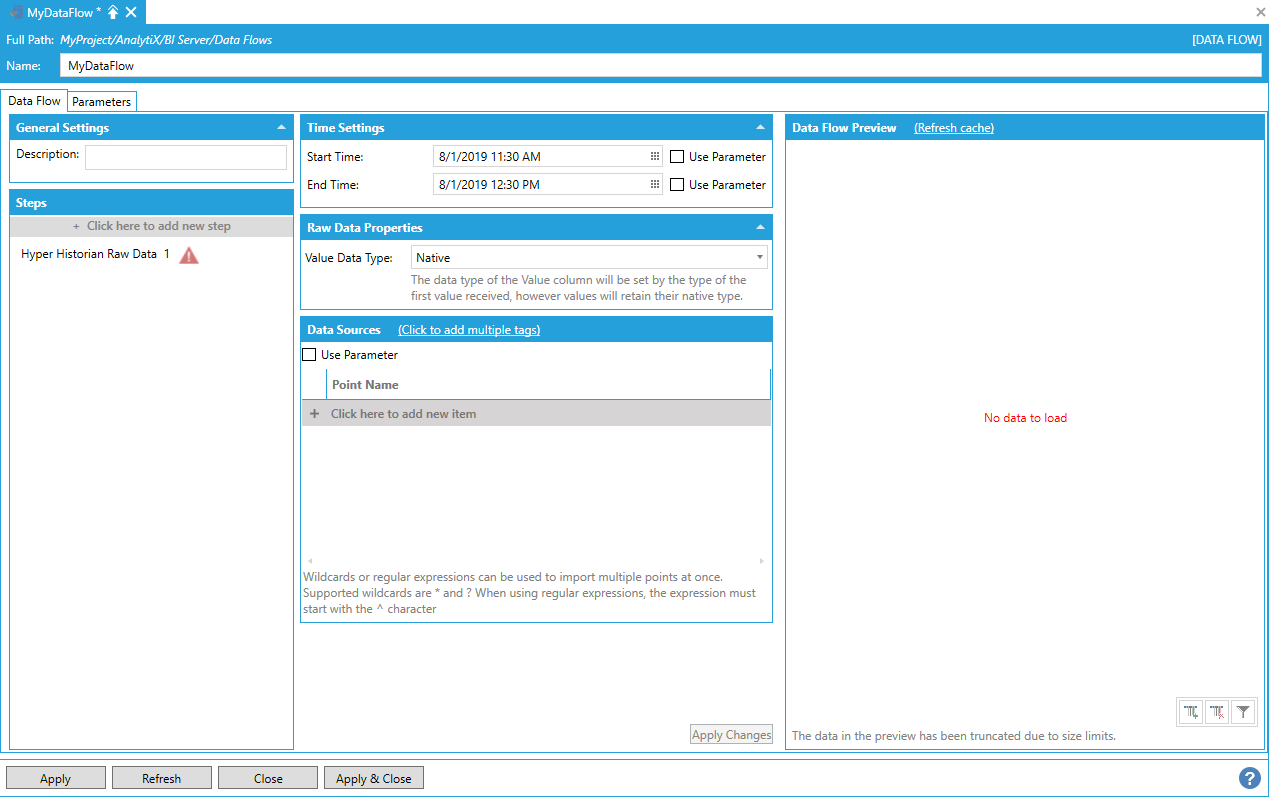
To complete the step’s configuration, we need to provide at least one historical tag name for the step to read. For example, we can use the default:
hh:\Configuration\Signals:Sine
Once the tag name has been entered under the Data Sources panel, click the Apply Changes button at the bottom to load the Data Flow Preview.
Data Preview Loaded

Select Apply to save your settings. Select Close to close the entire data flow configuration window. Select Apply & Close to do both. Your new data flow will now appear in your selected location in the project explorer.
Note: The Data Flow Configuration Form does cache the data source data for performance reasons, but also to avoid querying a potentially expensive data source continuously when in configuration mode. After the preview data is loaded for the first time, it is cached on disk and will persist even after closing and re-opening Workbench. To delete the cached data and re-query the data source, click the Refresh Cache hyperlink button next to the Data Flow Preview’s panel title. Changing some of the settings for the step will also drop the cached data and make a fresh request to the data source with the new parameter values.
Note: The cached data is used by the Workbench Configurator only. Executing the data flow in runtime will always query the data source for data.
Data Flow parameters can be defined using the Parameters tab of the data flow configuration form.
Parameters Tab of the Data Flow Configuration Form

Parameters are extremely useful when creating dynamic data flows. For example, assume we are configuring a data flow that reads historical data for several historical tags: the start and end time of the historical read can be parameterized so that clients can override the configured default values when executing the data flow.
To create a new data flow parameter, select “Click here to add a new item”.
Adding a New Item to the Parameters Tab in the Data Flow Properties
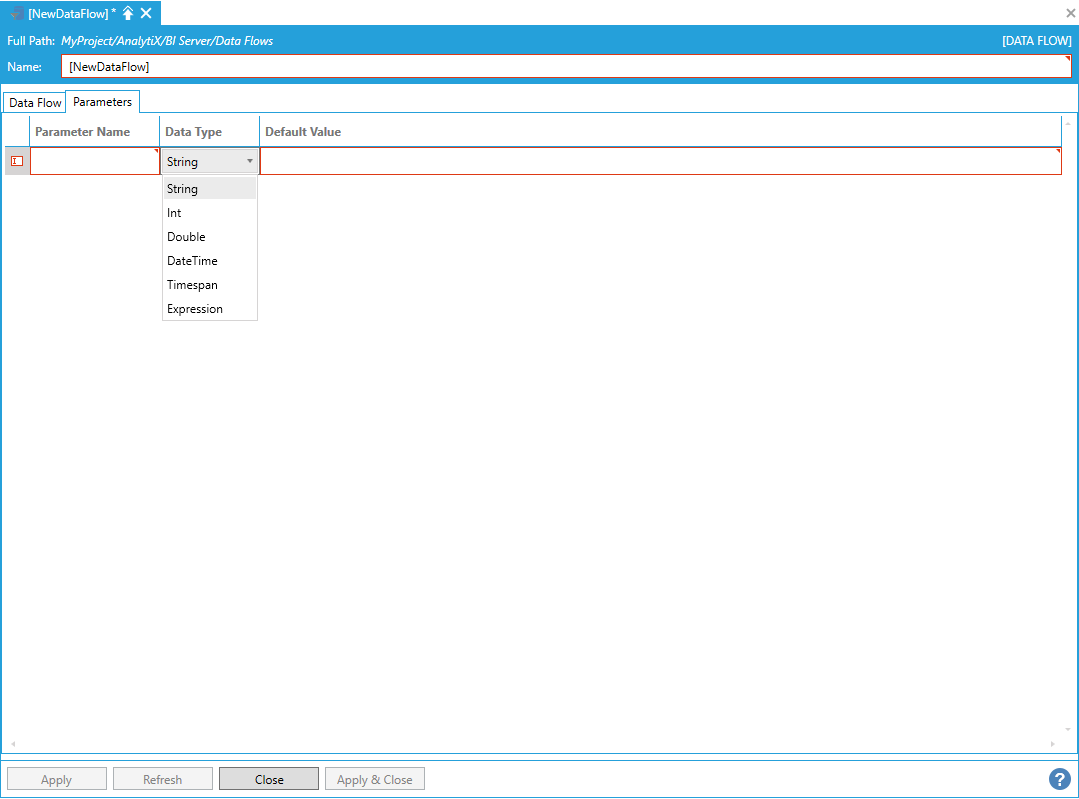
You will be required to give a name to the parameter, specify the parameter data type and provide a suitable default value. Continuing with the historical read example above, we can define the start time of the historical read as a date/time parameter as follows.
Example of Completing the Parameters Tab Settings
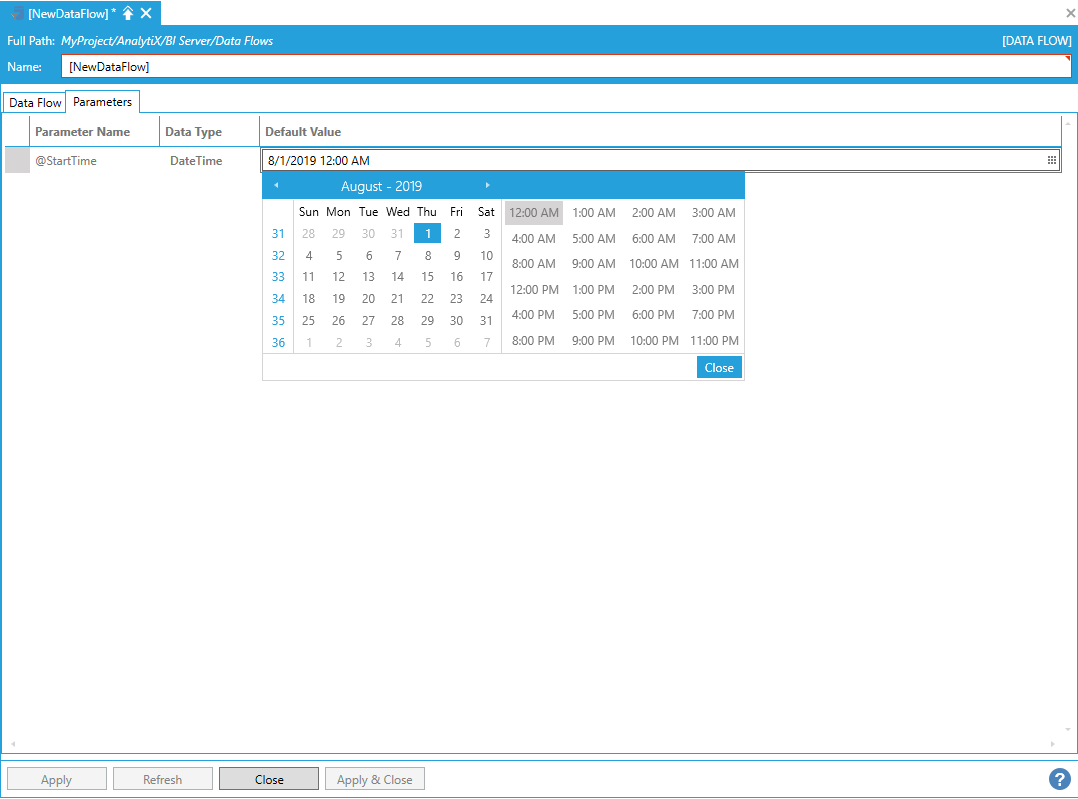
The Default Value field automatically provides with the appropriate editor for some of the selected data types. The supported data types are:
String. Text input - for example point names.
Int. Whole numbers, positive or negative.
Double. Double precision floating point values.
DateTime. Date/time values – for example start or end times.
Timespan. For durations – for example processing intervals.
Expression. Allow to compute the parameter value on the fly based on a dynamic expression. The expression cannot reference any real-time value, but it can reference other parameters.
Parameters of type Expression can reference built-in functions like now(), to dynamically retrieve the current date and time. You can also utilize Quality-based Functions in the Expressions in AnalytiX-BI Server.
Using the now() Function in the Parameters Tab

To complete our historical read example, we can add one last parameter for the point name of type string.
Adding Parameter for Point Name of Type String in the Parameters Tab

To bind a step setting that supports dynamic parameters to a data flow parameter, check the Use Parameter box, and a drop-down list with the currently available data flow parameters will be shown. In the example below, we are binding @StartTime, @EndTime and @PointName to the related settings in the Hyper Historian Raw Data step.
Click the Apply Changes button to execute the dataflow and load the preview data.
Binding a Step Setting Supporting Dynamic Parameters to a Data Flow Parameter
Parameters that don’t have a data type that is compatible with the current setting are grayed out and cannot be selected.
Note: The actual data type of parameters of type Expression is only resolved at runtime, so these parameters can be bound to any setting (like above @EndTime is available also for Point Name). If the data type is incorrect during runtime, the Data Flow will terminate in error.
Once configured, data flow parameters become part of the point name associated with the Data Flow and can then be changed by the client when requesting the Data Flow. The notable exception is parameters of type Expression as they are dynamically evaluated and so not exposed in the data flow point name.
If we save the data flow with the parameters pictured above with the name MyDataFlow, in runtime it will yield the following point name when browsed.
Selecting the Configured Data Flow in the Data Browser
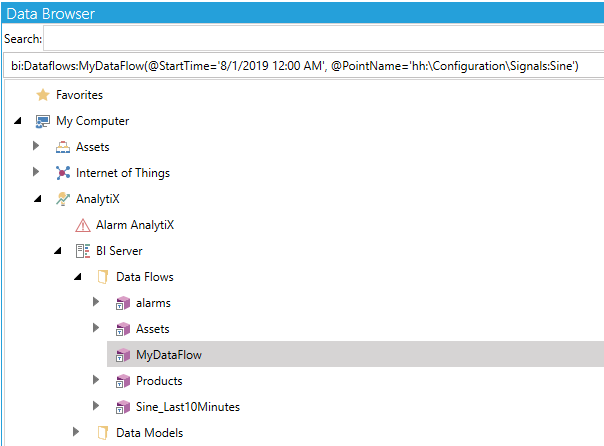
A few things to notice:
1. Data flow parameters are appended using parentheses
2. Data flow parameters start with an @ character
3. String, date/time values and timespans must be enclosed in single quotes. Integers and doubles do not need to be enclosed in single quotes.
Note: Parameters of type Expression are not automatically added to the point name. However, they can still be overridden manually by adding them to the data flow point name with the desired value – which must be an expression. Parameters that are omitted from the point name (either of type expression or any other type) will assume the default value configured in the form.
Data flow parameters support multiple values. To specify multiple values for a parameter in runtime, the parameter can be repeated in the point name as many times it is necessary to specify all the desired values. In our example above, if we wanted to pass more than one point name to our data flow in runtime, we could use a point name like the following:
bi:Dataflows:MyDataFlow(@StartTime='8/1/2019 12:00 AM' @PointName='hh:\Configuration\Signals:Sine',
@PointName='hh:\Configuration\Signals:Ramp')
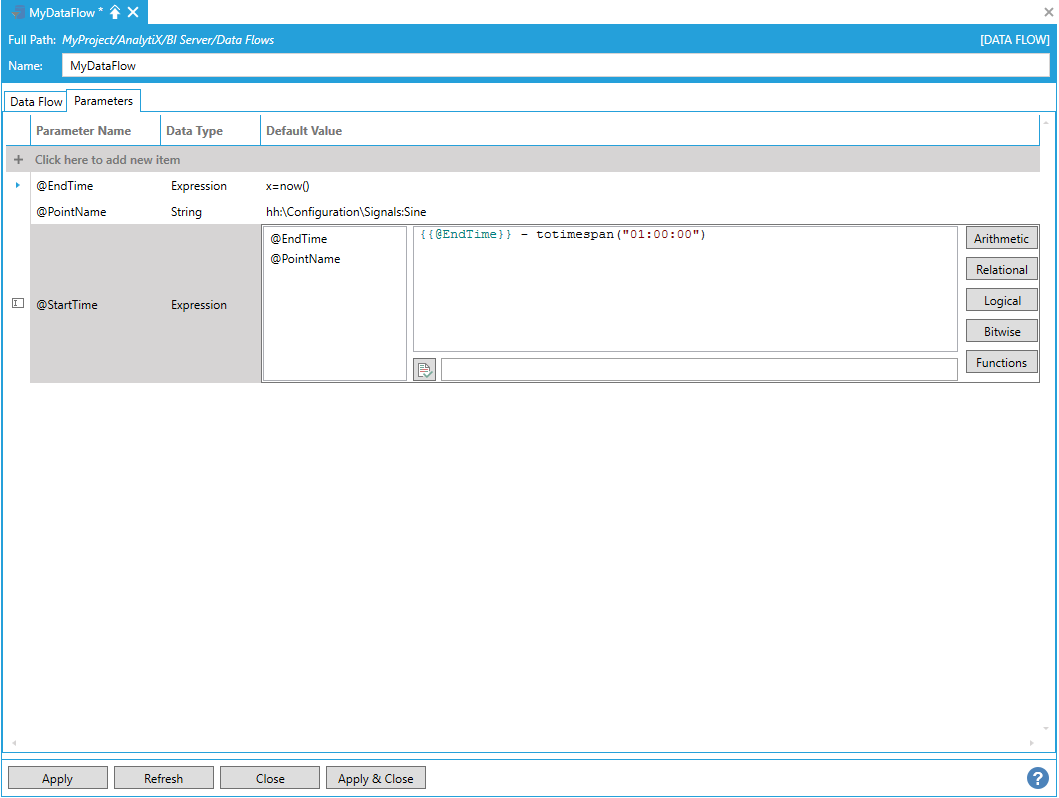
Parameters of type Expression can reference other parameters, for example we can modify our @StartTime parameter to be an expression referencing the @EndTime parameter and subtracting one hour from it using the totimespan function, as shown below.
totimespan Function
When checking the Use Parameter checkbox, configured data flow parameters are not the only items that will be shown in the list. If the Data Flow consists of more than one step, it is possible to use columns coming from the previous step as the input of the next step. This is where the flexibility of Data Flows really shows.
For example, let’s assume that we have a database with a table that contains a list of historical tags that we want to retrieve history for. Using a DataSet step, we can quickly ingest the table into a data flow.
Note: This requires configuring a GridWorX data source connected to the database table first, which can then be consumed as a dataset from the data flow.
Configuring a GridWorX Data Source Connection to the Database Table
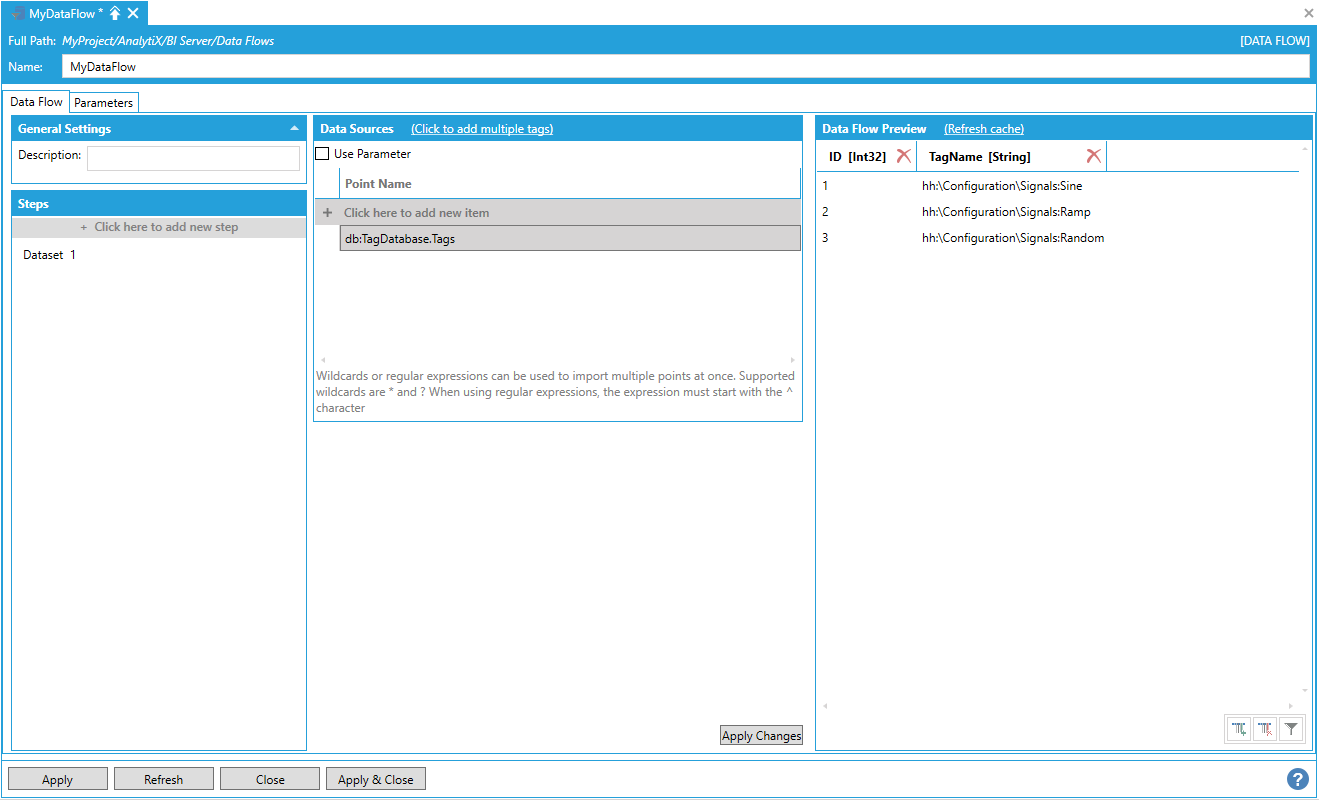
Next, we can add a Hyper Historian Raw data step. If we check the Use Parameter checkbox under the Data Sources panel, the data flow allows us to pick also columns coming from a previous step along with the data flow parameters.
Adding a Hyper Historian Raw Data Step

If we select the TagName column coming from the previous DataSet step, we will instruct the data flow to pass all rows in that column as the Point Name parameter of the Hyper Historian Raw Data step. The end result is to read historical data in the specified interval for all tags coming from the previous step.
Selecting the TagName Column

The ability to use columns from previous steps as input of the current step opens a vast array of possibilities for dynamic configuration.
Typically, the first step in any data flow is a data source step, as they provide the data to further process. AnalytiX-BI data flows are capable to connect to several type of data sources, which we will cover in the next sections, and provide several dimension-building and transformation steps.
Data Sources Include:
Data Sources > Historical Data > Hyper Historian Raw Data
Data Sources > Historical Data > Hyper Historian Aggregated Data
Data Sources > Historical Data > Historical Alarms
Data Sources > AnalytiX > FDDWorX
Data Sources > AnalytiX > Quality AnalytiX > Quality Histogram
Data Sources > AnalytiX > Quality AnalytiX > Quality Chart
Data Sources > GridWorX Point Builder
Data Sources > Asset Property Values
Dimensions Include:
Transformation Steps Include:
This data source allows to quickly ingest large amounts of raw data that is stored in Hyper Historian or any other HDA server.
To start, select Click here to add new step and then Data Sources > Historical Data > Hyper Historian Raw Data. You will be presented with the following configuration form.
Data Flow Configuration Form

To fully configure this step, it is necessary to specify the Start Time and End Time that describe the desired time interval for which to import the data, and the name of the point(s) to read history for.
Note: Start and end times are expressed using local time when entering values using the date/time pickers, however values returned from the server will have their timestamps in UTC.
To enter a point name, select Click here to add new item.
Entering a Point Name

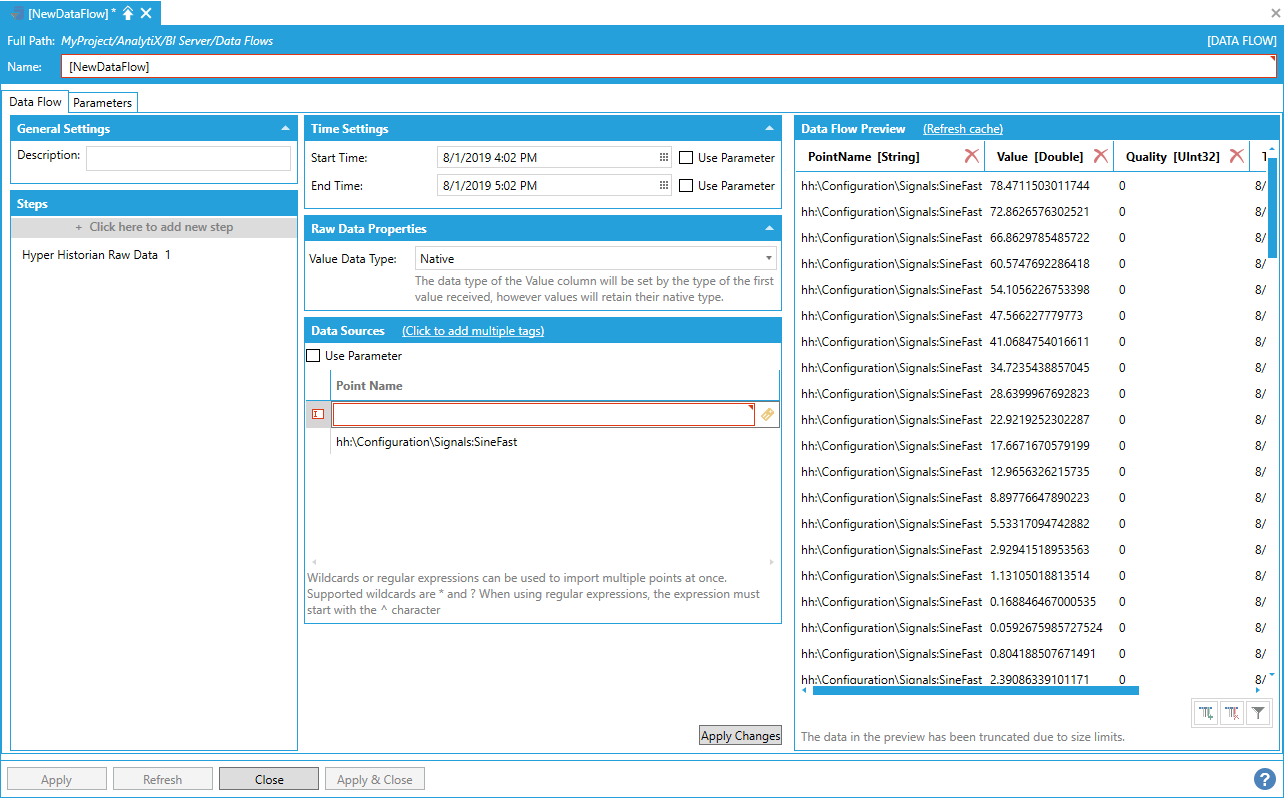
The point name can either be typed manually, browsed by selecting the tag icon, or dropped from the Workbench Data Browser panel. Once a selection is made, the Data Flow Preview panel will show a preview of the data.
Preview of Configured Data in the Data Flow Preview Panel

AnalytiX BI data flows also allow to quickly ingest data for multiple historical tags, and there are several different ways to read multiple historical tags within a data flow.
Is it possible to select multiple points. To enter more point names, you can select Click here to add new item multiple times to create new entries in the list, or you can use the Click to add multiple tags link in the header to select multiple tags from the Data Browser at once.
Creating Multiple Items
The final – and more flexible – way of ingesting data for multiple historical tags is to use the Data Flow’s built-in wildcard (or regular expression) import. For example, to retrieve data for all points that start with “Sine” in the Signals folder, the following point name containing a wildcard can be used.
hh:\Configuration\Signals:Sine*
Using the Data Flow's Built-In Wildcard Importing
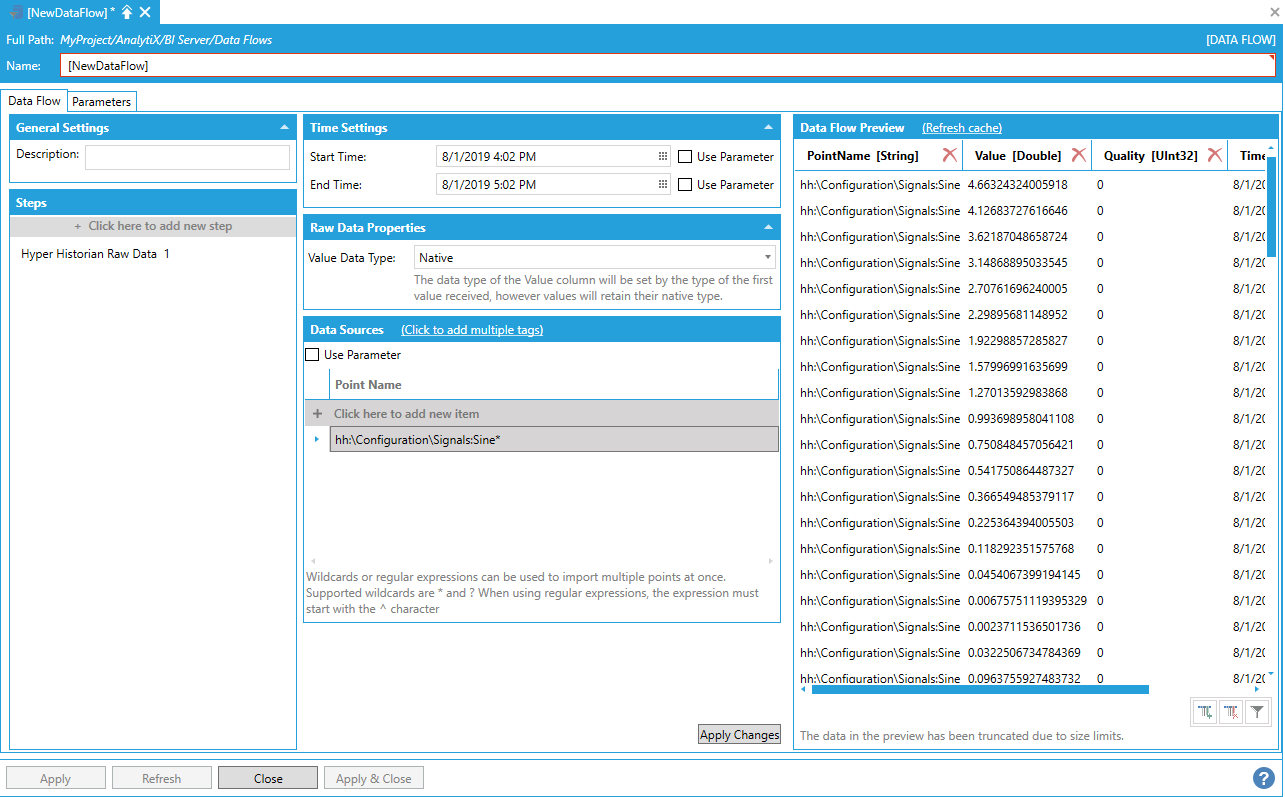
The data flow, when executed, will dynamically request historical data for all the points configured in Hyper Historian that match the wildcard expression (in this case: Sine, SineFast and SineSlow).
In cases where the matching logic is more complex and simple wildcards are not enough, it is possible to use a regular expression to match point names. In the example below, we are matching all points, in any folder, that end in either SineFast or SineSlow (in this way we don’t match “Sine”) with the regular expression:
^.*(SineFast|SineSlow)
Using a Regular Expression to Match Point Names

Note: Regular expressions must start with the ^ character.
Start Time, End Time and Point Name for the Hyper Historian Raw Data step can all be bound to data flow parameters.
The Value Data Type setting allows the user to explicitly set the type of the Value column. For example, in cases where the step is configured to read multiple tags (via explicit list, parameter or wildcard) it is possible that different tags return values of a different data type: when the Value Data Type setting is set to the default of Native all the values will retain their own data type, however the overall type of the Value column will be set to the type of the first value received. When using such a data flow as the source for a Data Table, it might cause issues if the values are of incompatible types.
When explicitly setting a value other than Native for Value Data Type, the step will try to convert all the values in the Value column to the desired type: if the conversion is not possible (or fails) the value will be set to null and the quality to Bad. This is the recommended option.
Return to List of Data Sources
This data source allows to quickly request and ingest large amounts of processed data from Hyper Historian or any other HDA server.
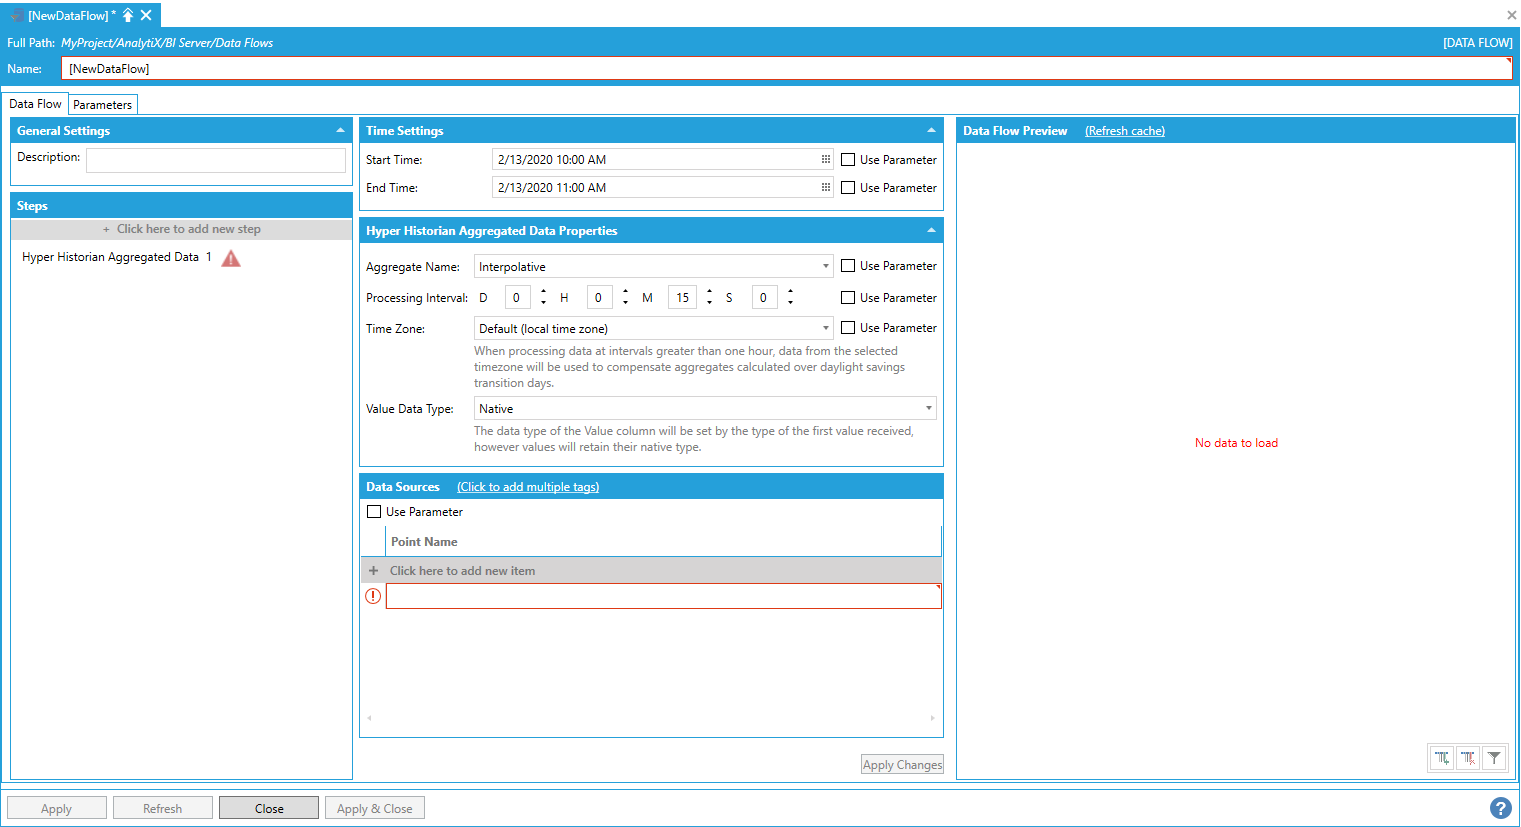
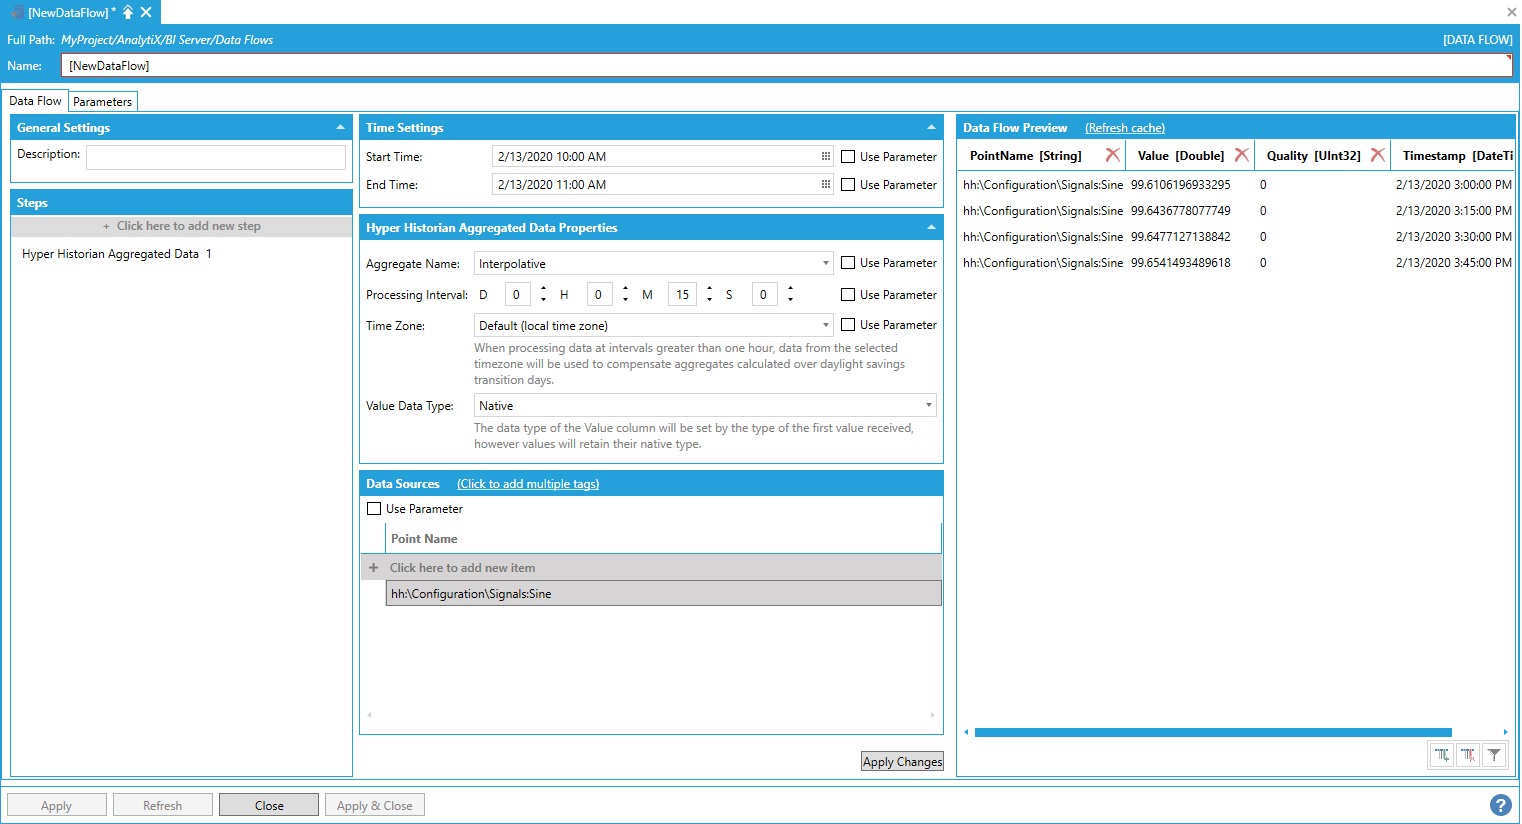
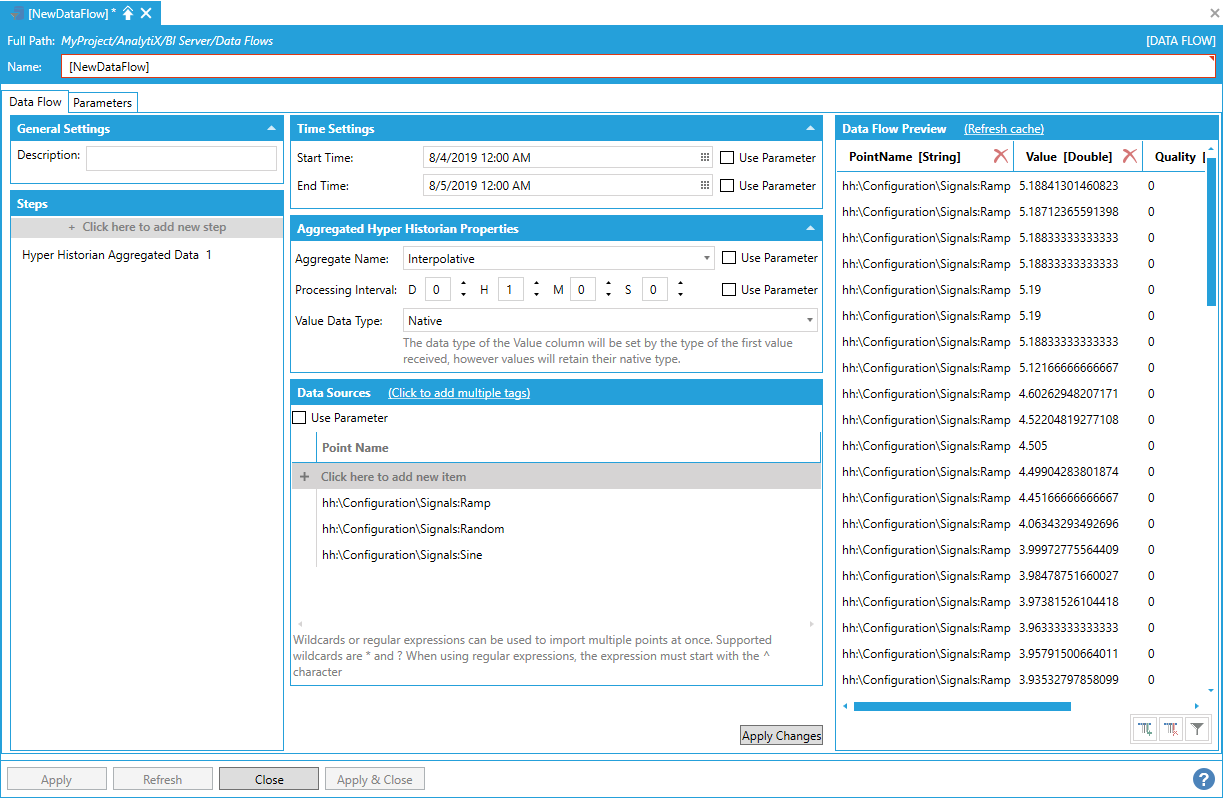
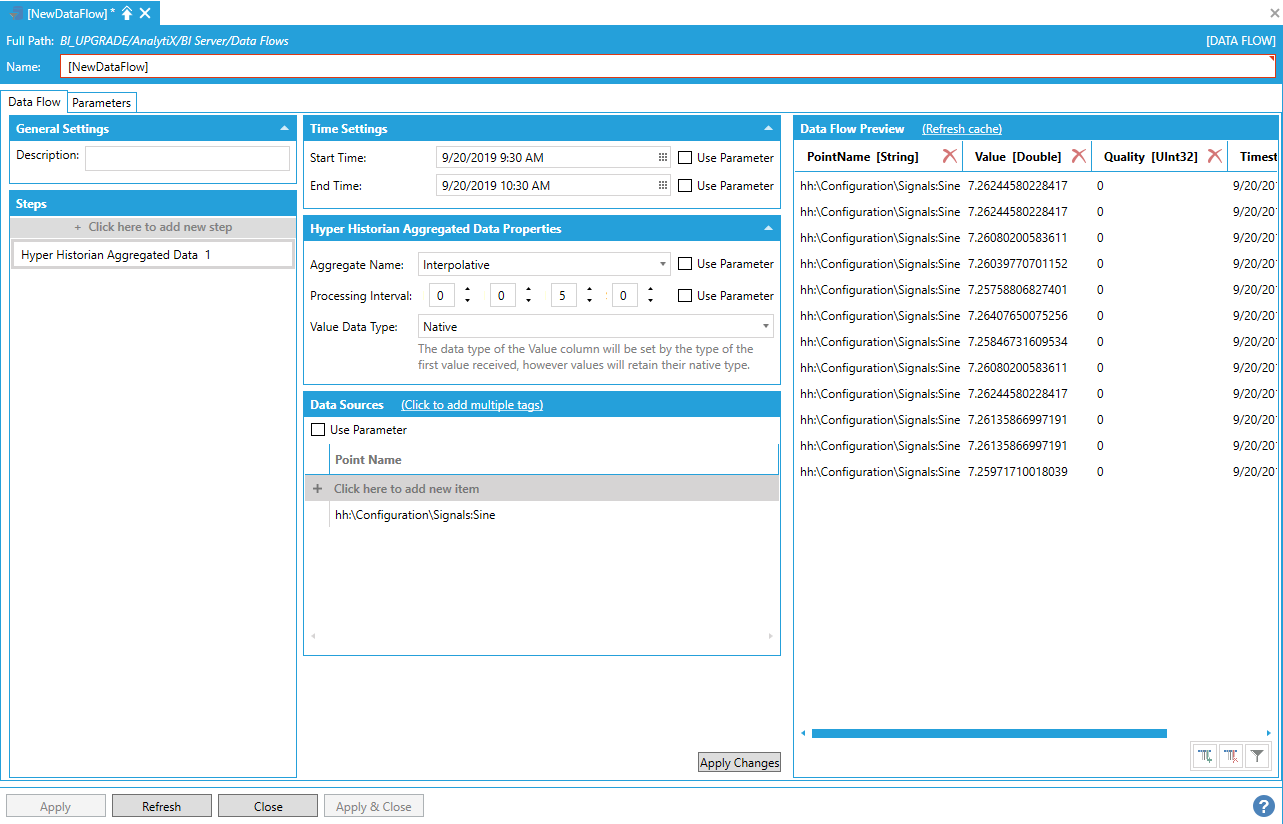
To start, select Click here to add new step then select Data Sources > Historical Data > Hyper Historian Aggregated Data. You will be presented with the following configuration form.
Data Flow Configuration Form

To fully configure this step, it is necessary to specify the Start Time and End Time that describe the desired time interval for which to import the data, an Aggregate Name that specifies the type of aggregate to calculate, a Processing Interval that specifies the interval for which we want Hyper Historian to calculate the aggregate and the name of the point(s) to read history for.
Note: Start and end times are expressed using local time when entering values using the date/time pickers, however values returned from the server will have their timestamps in UTC.
The Aggregate Name can be selected from a list of aggregates supported by Hyper Historian, while the processing interval can be specified in days, hours, minutes and seconds.
Selecting the Aggregate Name

Note: If the desired aggregate is not in the drop-down list, it is possible to create a parameter of type string and set it to the custom aggregate name. Then, check the Use Parameter checkbox for the Aggregate Name setting and pick the parameter to use the custom aggregate name.
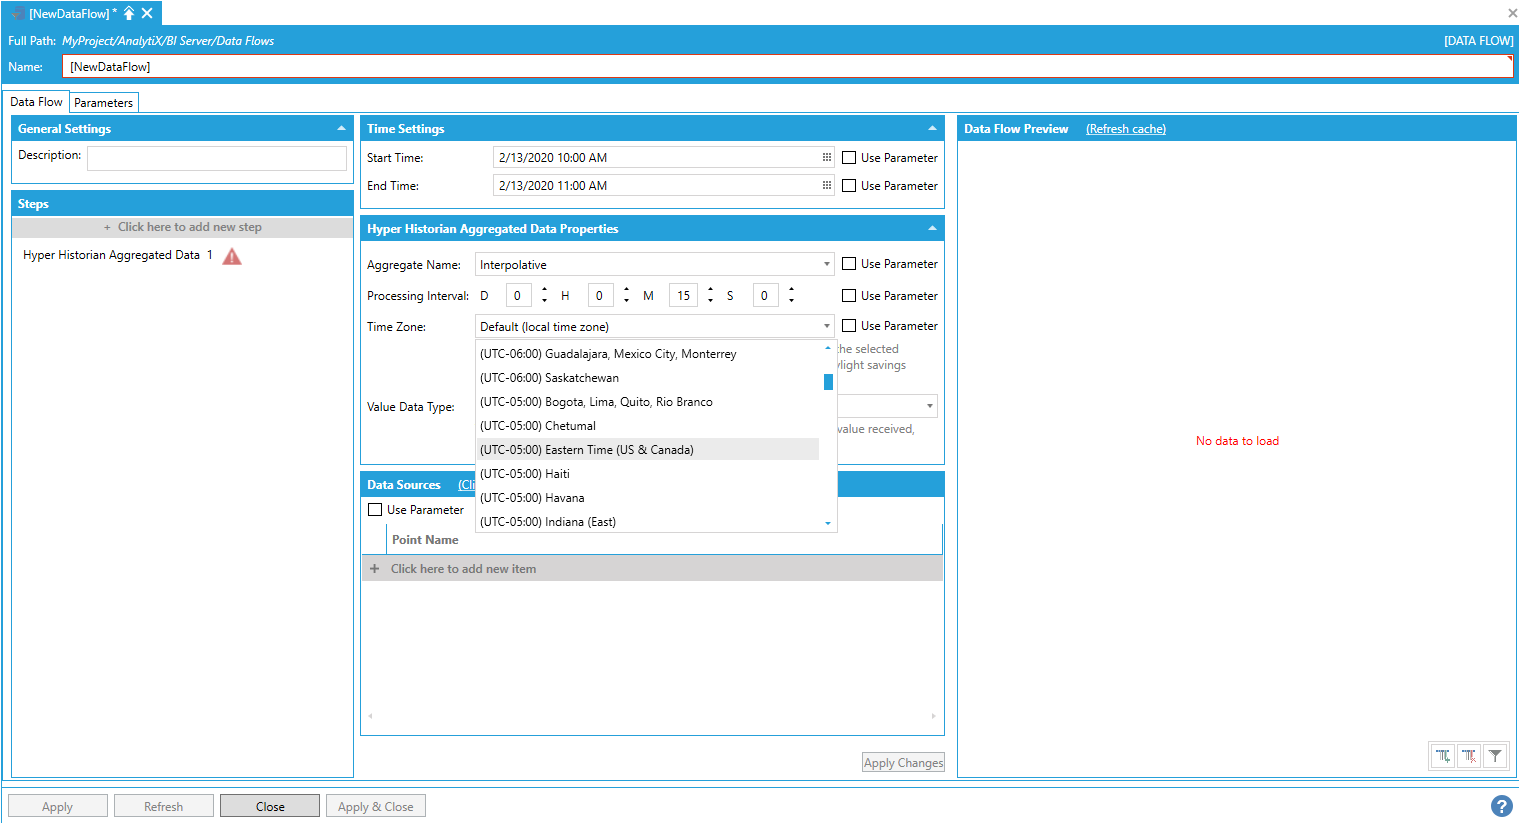
Optionally, it is possible to specify a time zone that will be used to retrieve information about Daylight Savings transition days. If no selection is made, the local time zone will be used.
The time zone setting is only applied when configuring processing intervals larger than one hour, and will be used to properly modify the request for aggregated values from Hyper Historian on Daylight Savings transition days. For example, when Daylight Savings time starts the day will typically have 23 hours rather than 24: if the dataflow is supposed to calculate a daily running total, the result would be incorrect if the processing interval is not adjusted to take the time shift into account.
Note: it is possible to specify the time zone using a parameter, in which case the parameter must represent the ID of the time zone as it is defined by the system. On Windows systems, it corresponds to the subkeys of the HKEY_LOCAL_MACHINE\Software\Microsoft\Windows NT\CurrentVersion\Time Zones registry key.
Configuring a Custom Time Zone
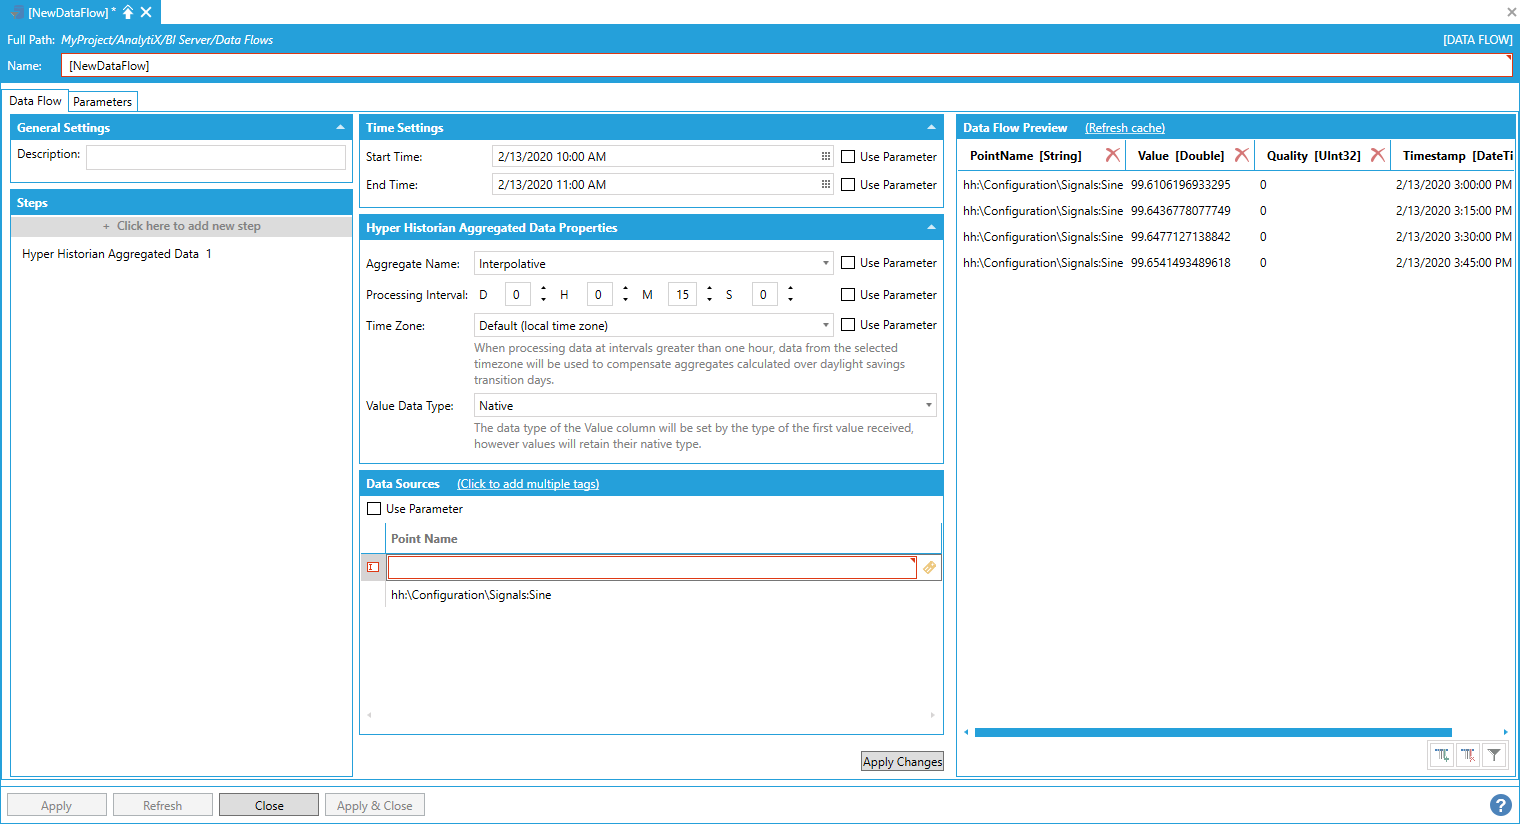
To enter a point name, select Click here to add new item.
Entering a Point Name
The point name can either be typed manually, browsed by clicking on the tag icon, or dropped from the Workbench Data Browser panel. Once a selection is made and changes applied, the Data Flow Preview panel will show a preview of the data. In the example below we are requesting the interpolated value of the Sine signal calculated at 15 minutes interval.
Data Preview Pane Showing a Preview of Configured Data
AnalytiX BI data flows also allow for quick ingestion of data for multiple historical tags, and there are several different ways to read multiple historical tags within a Data Flow.
To enter more point names, you can select Click here to add a new item multiple times to create new entries in the list, or you can use the Click to add multiple tags link in the header to select multiple tags from the Data Browser at once.
Entering Multiple Items
The final, and most flexible, way of ingesting data for multiple historical points is to use the data flow’s built-in wildcard (or regular expression) import. For example, to retrieve data for all points that start with “Sine” in the Signals folder, the following point name containing a wildcard can be used:
hh:\Configuration\Signals:Sine*
Using the Data Flow's Built-In Wildcard Importing
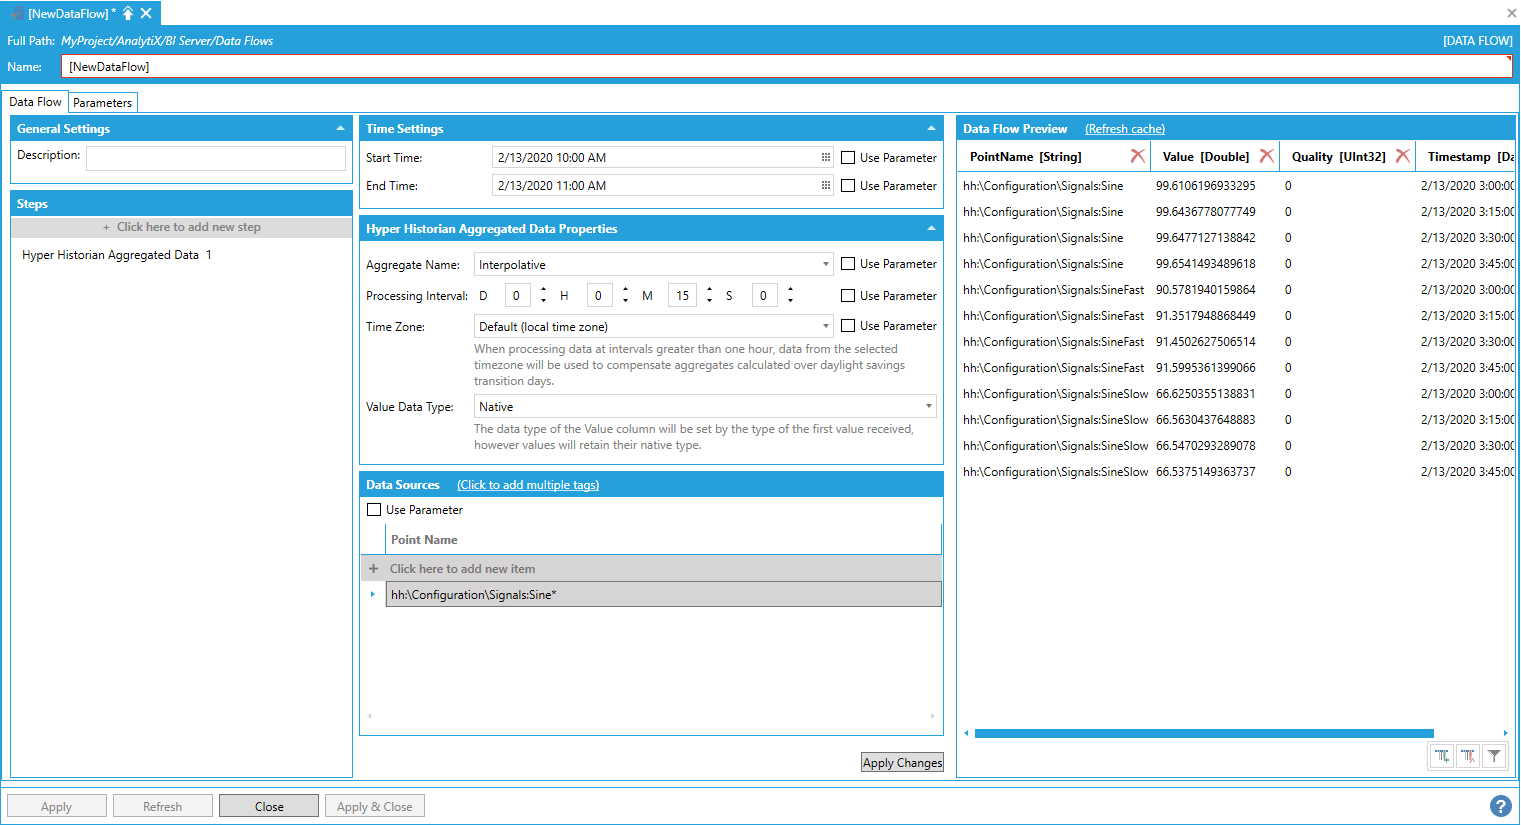
The data flow, when executed, will dynamically request historical data for all the points configured in Hyper Historian that match the wildcard expression (in this case: Sine, SineFast and SineSlow).
In cases where the matching logic is more complex and simple wildcards are not enough, it is possible to use a regular expression to match point names. In the example below, we are matching all points, in any folder, that end in either SineFast or SineSlow (in this way we don’t match “Sine”) with the regular expression:
^.*(SineFast|SineSlow)
Using a Regular Expression to Match Point Names
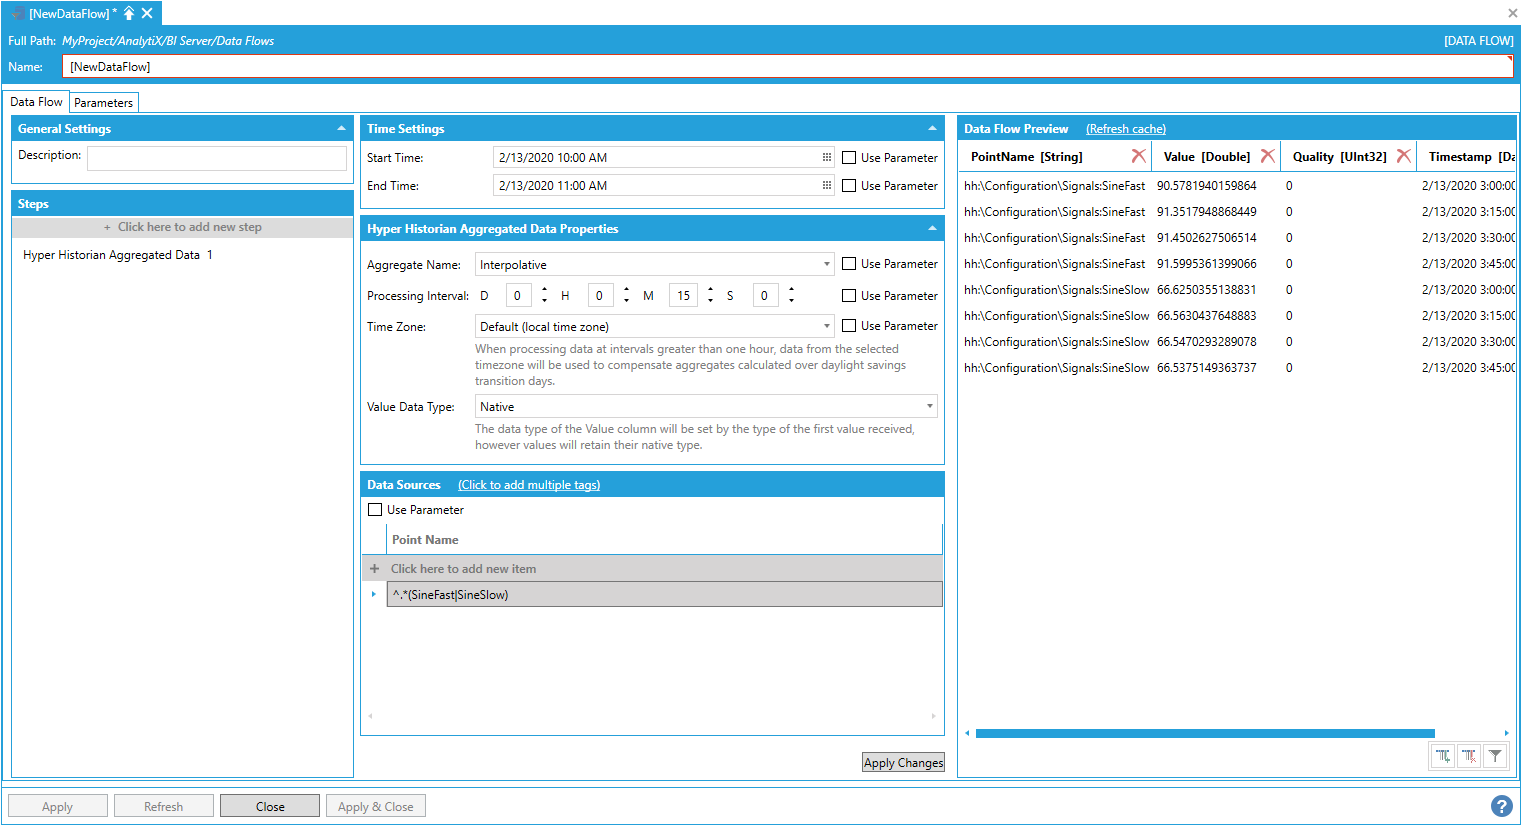
Note: Regular expressions must start with the ^ character.
Start Time, End Time, Aggregate Name, Processing Interval, Time Zone and Point Name for the Hyper Historian Aggregated Data step can all be bound to data flow parameters.
The Value Data Type setting allows the user to explicitly set the type of the Value column. For example, in cases where the step is configured to read multiple tags (via explicit list, parameter or wildcard) it is possible that different tags return values of a different data type: when the Value Data Type setting is set to the default of Native all the values will retain their own data type, however the overall type of the Value column will be set to the type of the first value received. When using such a data flow as the source for a Data Table, it might cause issues if the values are of incompatible types.
When explicitly setting a value other than Native for Value Data Type, the step will try to convert all the values in the Value column to the desired type: if the conversion is not possible (or fails) the value will be set to null and the quality to Bad. This is the recommended option.
Return to List of Data Sources
This data source allows for quick ingestion of historical alarms that have been stored in Alarm Logger.
To start, select Click here to add new step, then select Data Sources > Historical Data > Historical Alarms. You will be presented with the following configuration form.
Data Flow Properties

To fully configure this step, it is necessary to specify the Start Time and End Time that describe the desired time interval for which to import the data, and the name of the server to read historical alarms for.
Note: Start and end times are expressed using local time when entering values using the date/time pickers, however values returned from the server will have their timestamps in UTC.
To enter a server name, select Click here to add new item.
Entering a Point Name

The point name can either be typed in manually, browsed by clicking on the tag icon, or dropped from the Workbench Data Browser panel. Once a selection is made, click the Apply Changes button and the Data Flow Preview panel will show a preview of the data.
Data Flow Preview of Configured Data

Note: It is possible to ingest historical alarms from multiple servers at once by specifying more than one server under the Data Sources panel. When multiple servers are entered, the Data Flow will merge (union) records from all datasets. In this case, it is required that the datasets have the same schema, otherwise an error will occur.
By default, AnalytiX BI data flows ingest all the event fields configured in the server and produce them as columns in the resulting dataset. It is possible to select only the fields of interest by using the Event Fields configuration setting. To quickly select the desired fields, click on the Event Fields Editor button.
Selecting Event Fields
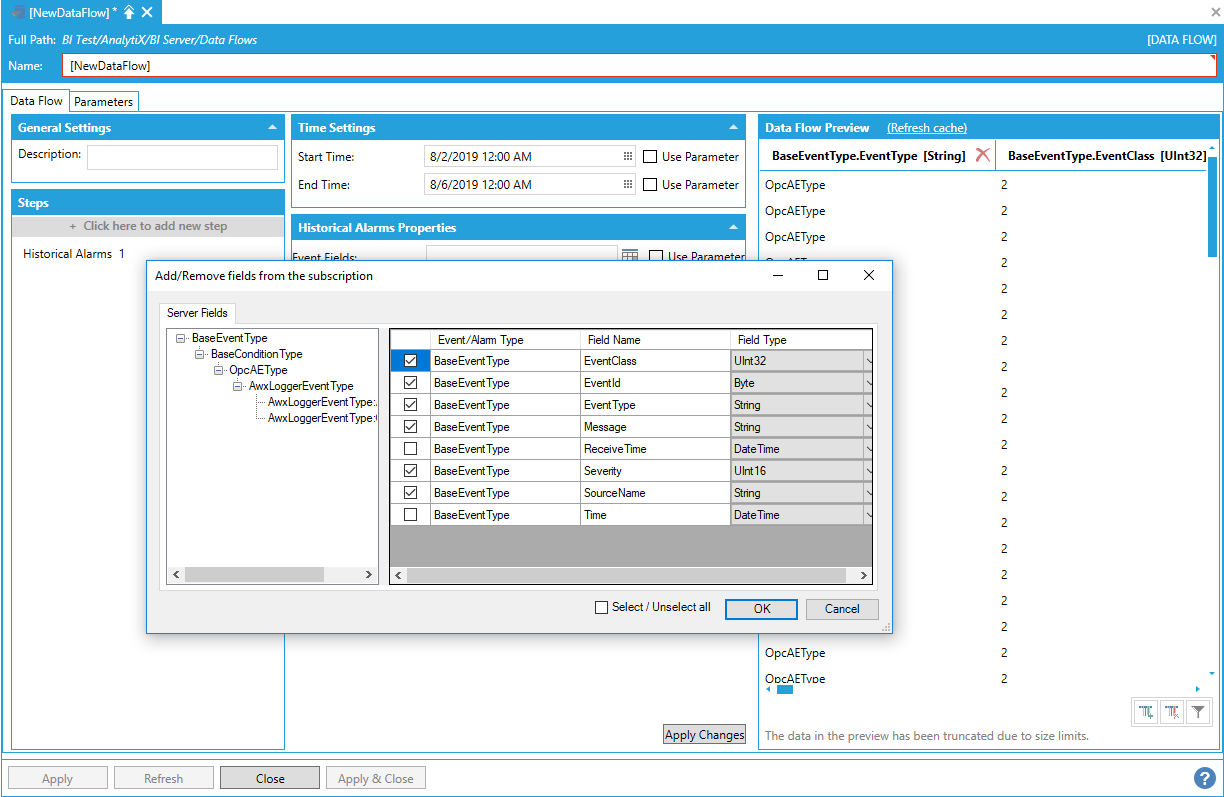
Use this dialog to quickly select the desired event fields. Once a selection is made, the Event Fields box will contain the list of selected fields. The format of the text in this box is a semicolon-separated list of event fields specified in the format {Field Type}.{Field Name}.
Populated Event Fields Box

By default, ingested fields will be imported as columns in the dataset where the column name is set to the name of the field. Since event fields are hierarchical, it is possible for two fields in different levels of the hierarchy to have the same name. When this happens, data cannot be represented as a flat dataset because the two columns will have the same name. That's why the Qualify Columns Name checkbox is checked by default.This will prepend the field names with the field type, thus creating a unique name. If field names are known to be unique, it is possible to uncheck the Qualify Column Names checkbox to produce more user-friendly column names.
Using the 'Qualify Column Names' Setting

Start Time, End Time, Event Fields and Point Name for the Historical Alarms step can all be bound to Data Flow parameters.
Return to List of Data Sources
This data source allows for quick ingestion of fault data that has been stored in FDDWorX.
To start, select Click here to add new step, then Data Sources > AnalytiX > FDDWorX. You will be presented with the following configuration form:
Data Flow Properties

To fully configure this step, it is necessary to specify the Start Time and End Time that describe the desired time interval for which to import the data. The next item is to choose the type of data to import from the FDD Data Source list.
Choosing Data Import Type from the FDD Data Source List
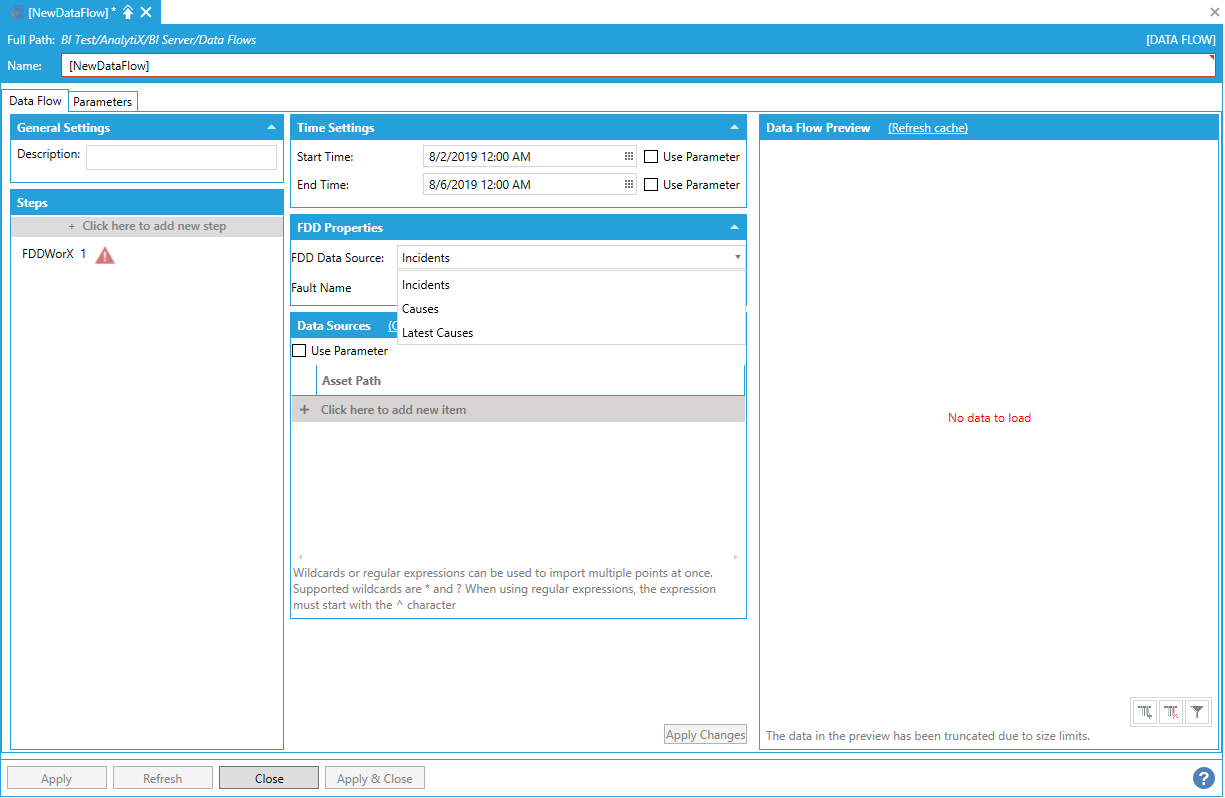
The choices are:
Incidents. Reads incidents for the specified fault(s) in the timeframe specified by Start Time and End Time.
Causes. Reads incident causes for the specified fault in the timeframe specified by Start Time and End Time.
Latest Causes. Reads the most recent incident causes for the specified fault. In this case the Start Time and End Time parameter will be ignored.
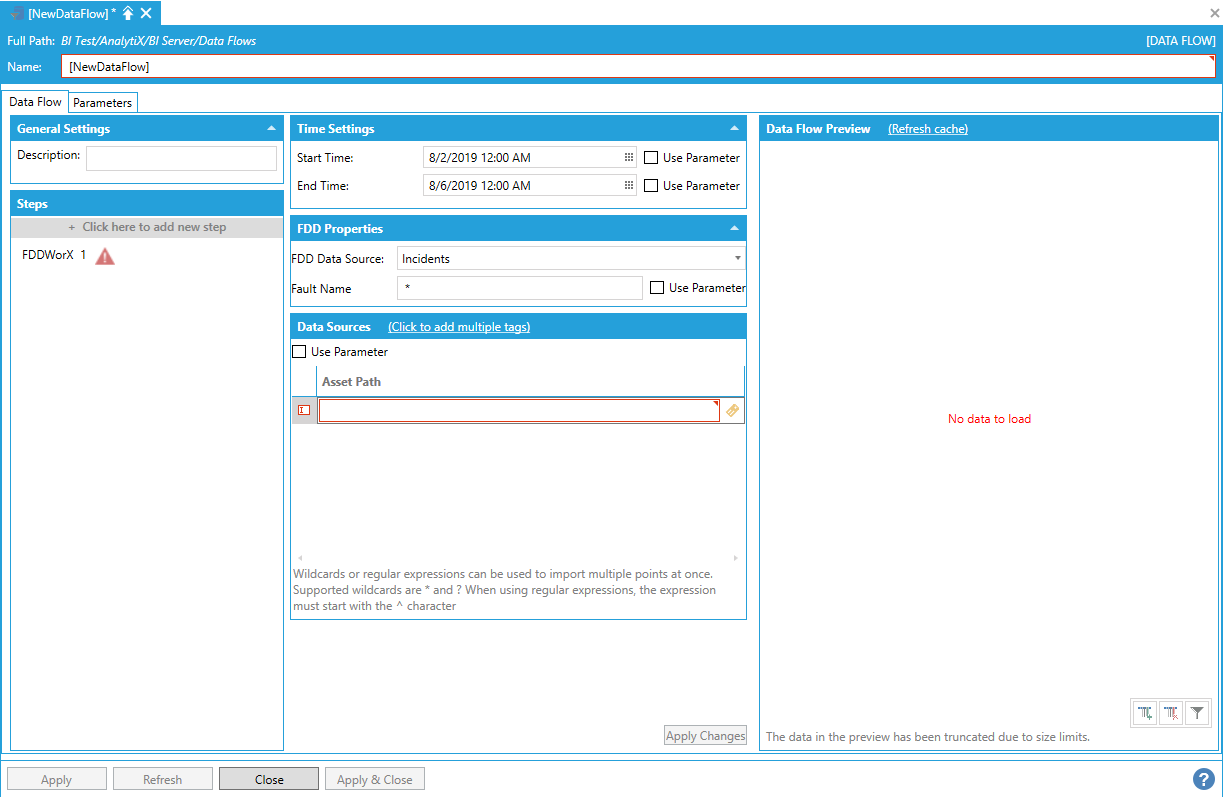
Once the data source has been decided, to finish the step configuration, it is necessary to specify the name of the fault for which to retrieve incidents or causes. For Incidents, it is possible to either enter the name of a specific fault or use the * (star) wildcard to retrieve incidents for all faults. For causes or Latest Causes, a fault name is required and the * wildcard cannot be used.
The last item to configure is the Asset Path under the Data Sources panel. To enter an asset path, select Click here to add new item.
Configuring the Asset Path
The asset path can either be typed manually, browsed by clicking on the tag icon, or dropped from the Workbench Data Browser Panel. Once a selection is made, the Data Flow Preview panel will show a preview of the data.
Data Flow Preview of Configured Data
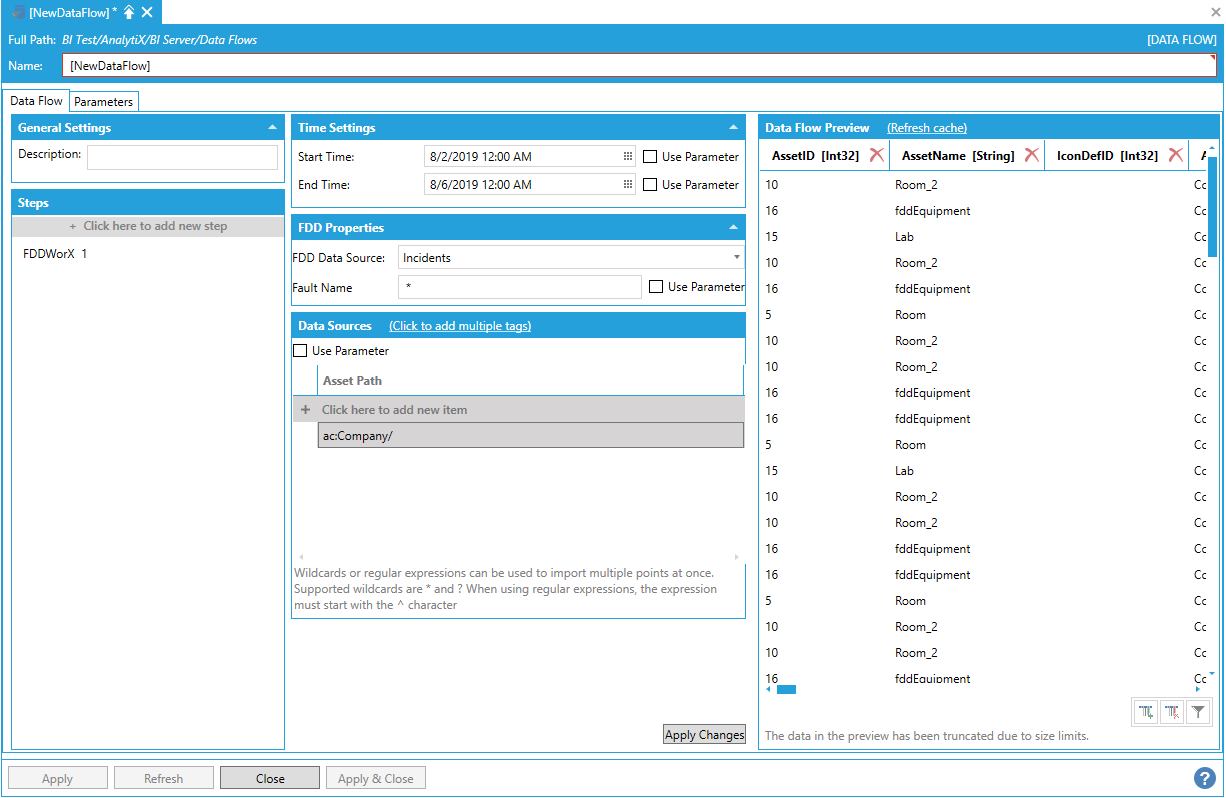
Note: The FDDWorX data source step automatically retrieves incidents recursively for the asset specified by Asset Path and its children, so it is not recommended to use wildcards in the Asset Path.
Start Time, End Time, Fault Name and Asset Path for the FDDWorX step can all be bound to data flow parameters.
Return to List of Data Sources
This data source allows to retrieve SPC data from Hyper Historian that can be used to produce SPC histogram charts.
To start, select + Click here to add new step, then select Data Sources > AnalytiX > Quality AnalytiX > Quality Histogram. You will be presented with the following configuration form.
Data Flow Properties
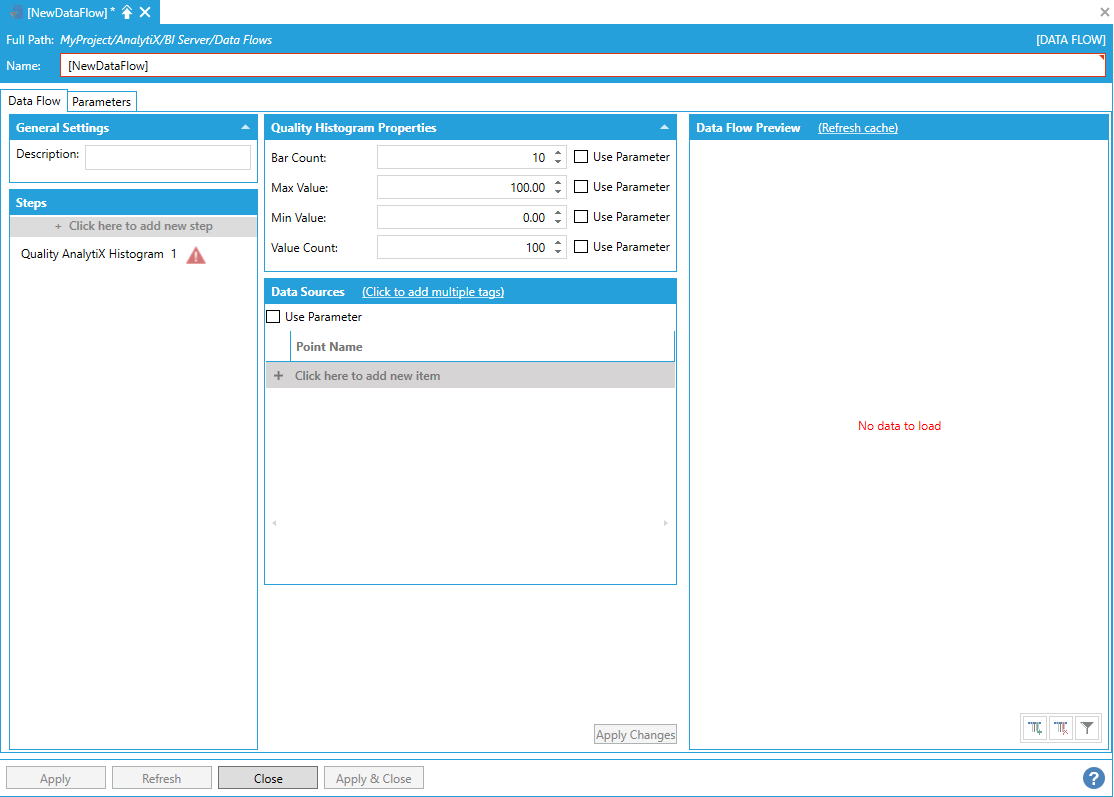
To fully configure this step, it is necessary to specify the name of the SPC point(s) to retrieve data for.
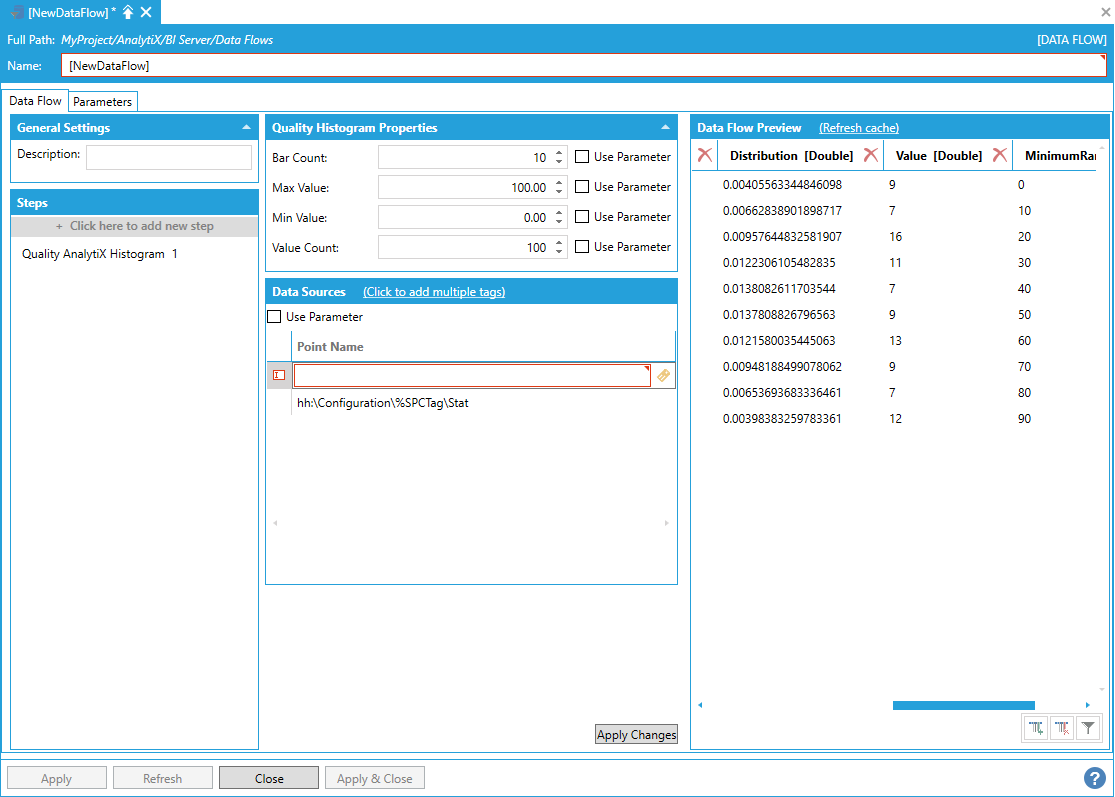
To enter a point name, select Click here to add new item.
Entering a Point Name

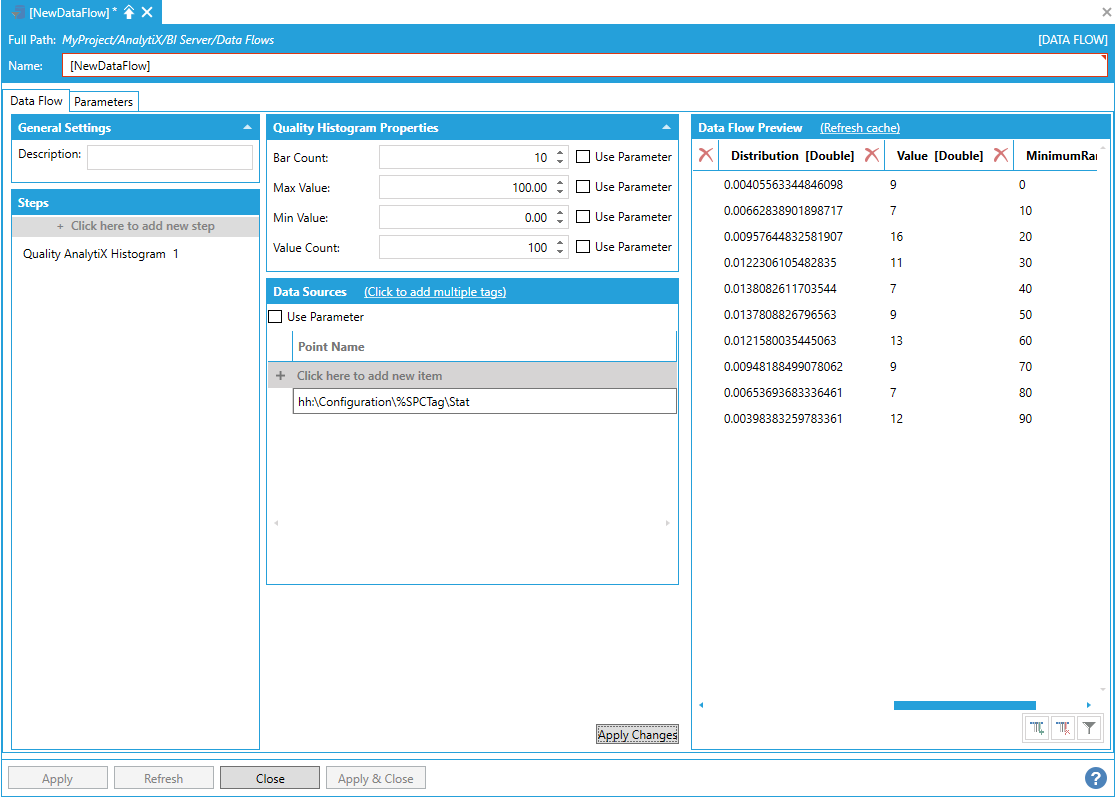
The point name can either be typed manually, browsed by selecting the tag icon, or dropped from the Workbench Data Browser panel. For Histogram Charts it is necessary to select Statistics folder under a SPC tag.
Once a selection is made, click the Apply Changes button and the Data Flow Preview panel will show a preview of the data.
Preview of Configured Data in the Data Flow Preview Panel
It is possible to select multiple points. To enter more point names, you can select + Click here to add new item multiple times to create new entries in the list, or you can use the + Click to add multiple tags link in the header to select multiple tags from the Data Browser at once.
Creating Multiple Items
Note: There is no wildcard import available for the Quality Histogram step, however the Point Name setting can be bound to a data flow parameter or a column from a previous step, which allows to pass multiple values.
Bar Count, Max Value, Min Value, Value Count and Point Name for the Quality Histogram step can all be bound to data flow parameters.
Return to List of Data Sources
This data source allows to retrieve SPC data from Hyper Historian that can be used to produce SPC charts.
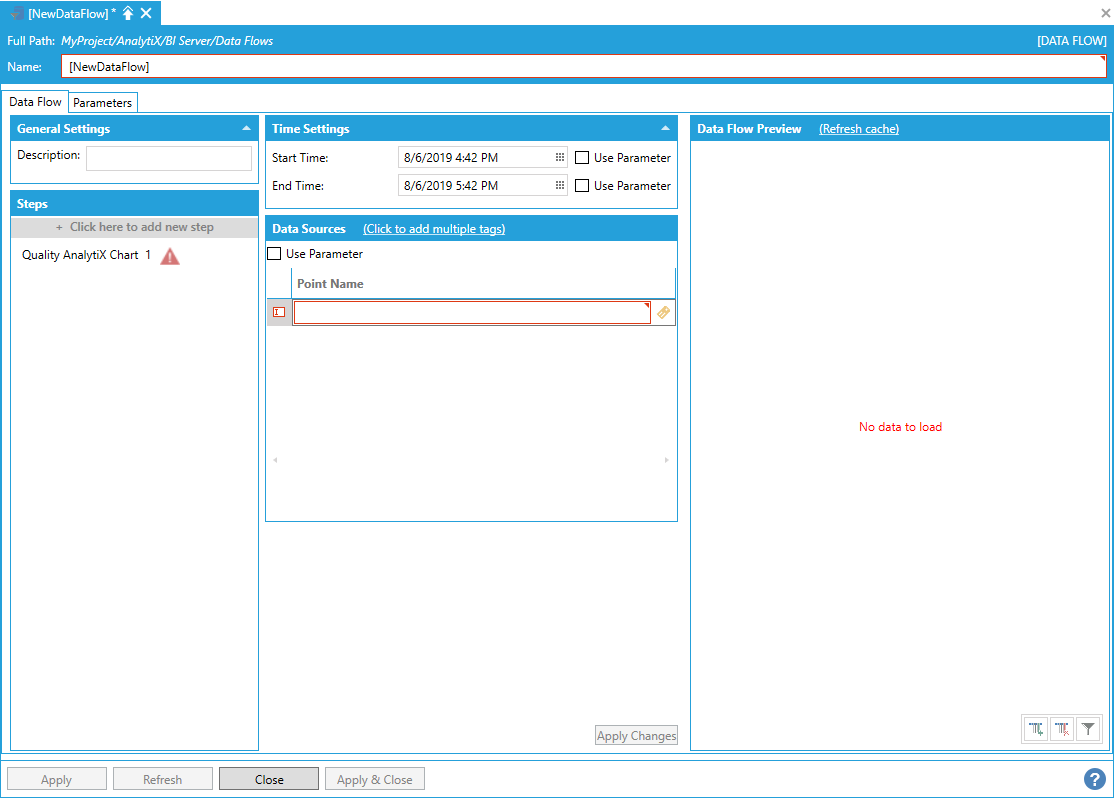
To start, select + Click here to add new step, then select Data Sources > AnalytiX > Quality AnalytiX > Quality Chart. You will be presented with the following configuration form.
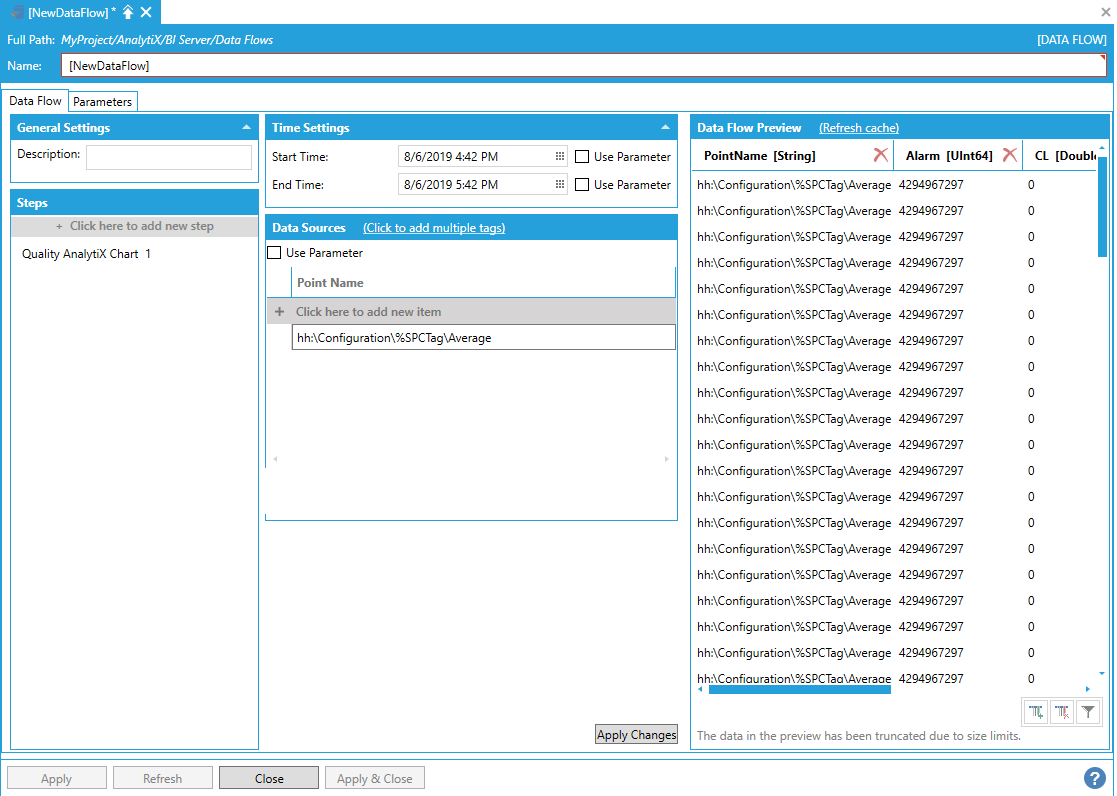
Data Flow Properties

To fully configure this step, it is necessary to specify the Start Time and End Time that describe the desired time interval for which to import the data, and the name of the SPC point(s) to retrieve data for.
Note: Start and end times are expressed using local time when entering values using the date/time pickers, however values returned from the server will have their timestamps in UTC.
To enter a point name, select + Click here to add new item.
Entering a Point Name
The point name can either be typed manually, browsed by selecting the tag icon, or dropped from the Workbench Data Browser panel. For Quality Charts it is necessary to select either the Average or Range folders under a SPC tag.
Once a selection is made, click the Apply Changes button and the Data Flow Preview panel will show a preview of the data.
Preview of Configured Data in the Data Flow Preview Panel
It is possible to select multiple points. To enter more point names, you can select + Click here to add new item multiple times to create new entries in the list, or you can use the + Click to add multiple tags link in the header to select multiple tags from the Data Browser at once.
Creating Multiple Items

Note: There is no wildcard import available for the Quality Chart step, however the Point Name setting can be bound to a data flow parameter or a column from a previous step, which allows to pass multiple values.
Start Time, End Time and Point Name for the Quality Chart step can all be bound to data flow parameters.
Return to List of Data Sources
This data source allows for quick ingestion of data from GridWorX.
Note: While the DataSet data source could also be used to retrieve data from GridWorX, the GridWorX Point Builder is typically a better choice because it can automatically parse parameters expected by GridWorX points, and it provides a simpler UI to fill the parameter values.
To start, select Click here to add new step, then select Data Sources > GridWorX Point Builder. You will be presented with the following configuration form.
Data Flow Properties
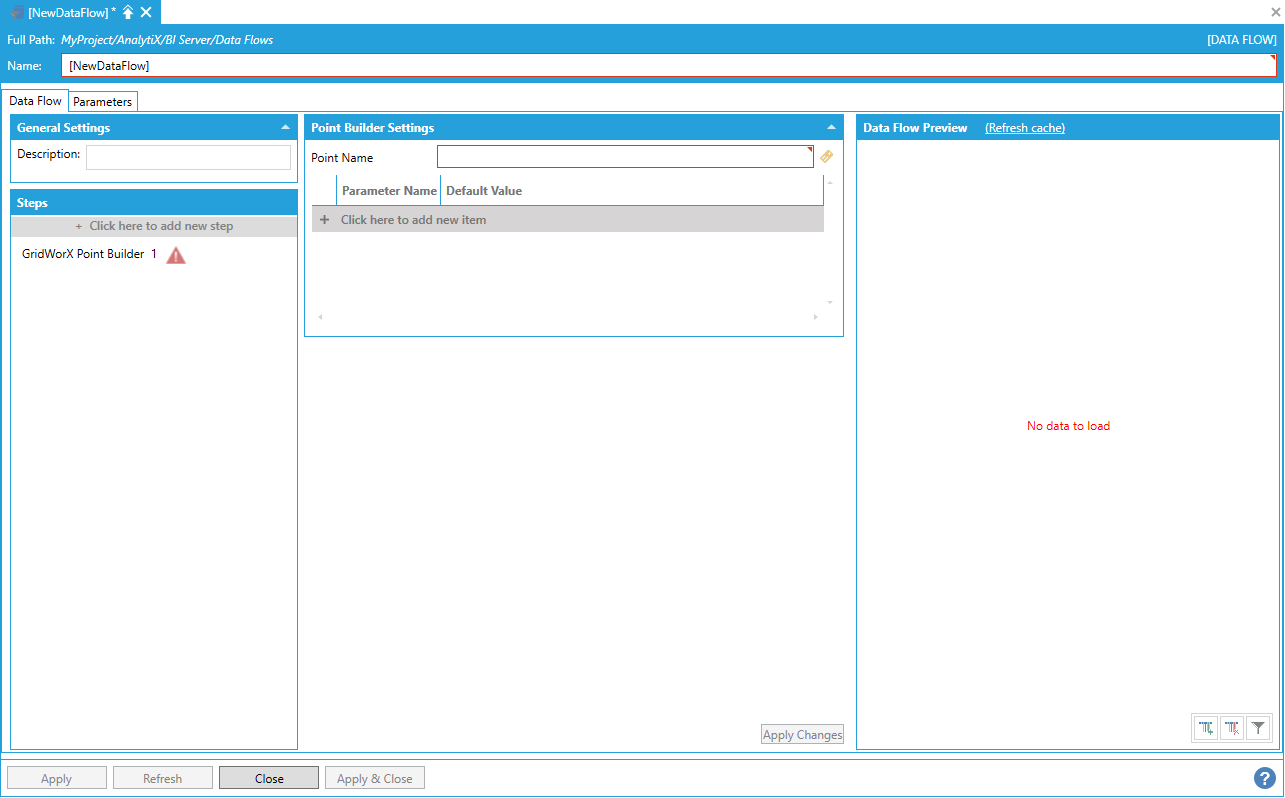
To start configuring this step, it is necessary to specify a GridWorX point name for which to retrieve data for. To enter a point name, either type it in the Point Name box, select the tag button to launch the Data Browser or drop a point from the Workbench Data Browser Panel.
If the point contains parameters, the parameter names will be parsed and displayed individually as fields below the point name.
Specifying a GridWorX Point Name

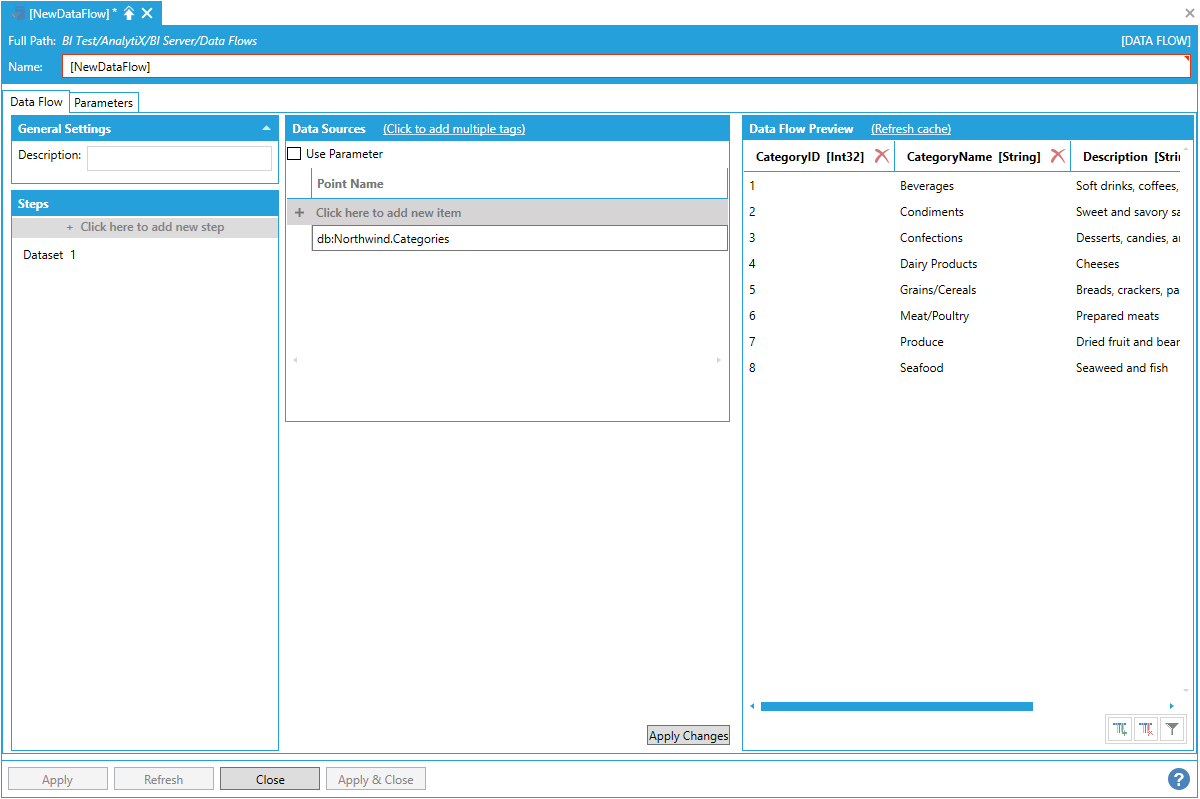
Once the desired value of the parameter has been entered and changes applied, the Data Flow Preview panel will display a preview of the data.
Data Flow Preview of Configured Data
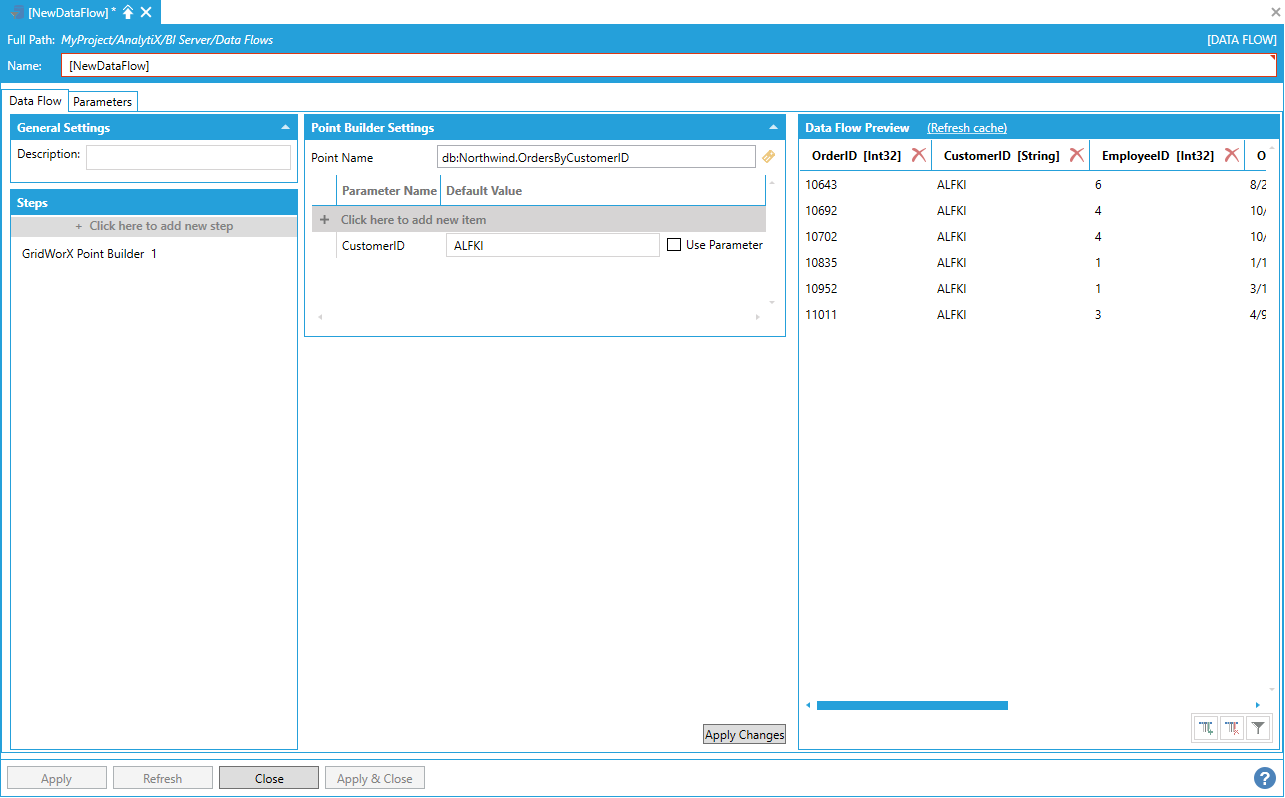
The GridWorX Point Builder block generates the name of the point to request based on the configuration and the GridWorX point syntax. The value specified in the Point Name box is used as base name and all the parameters will be appended inside angle brackets: the result string will be used to request the data. In the example above, the resulting point will be:
db:Northwind.OrdersByCustomerID<@CustomerID=ALFKI>
Note: Point names can also be generated manually by entering the base point name and adding the required parameters to the table using Click here to add new item.
The main advantage of using the GridWorX Point Builder step is that GridWorX parameters can be bound to data flow parameters, which is especially useful when the values are coming from a previous step. Assume, for example, that we have a dataset source that returns a list of customer IDs.
Dataset Returning a List of Customer IDs

We then can pipe the CustomerID column into the GridWorX Point Builder step.
Including the CustomerID Column in the GridWorX Point Builder
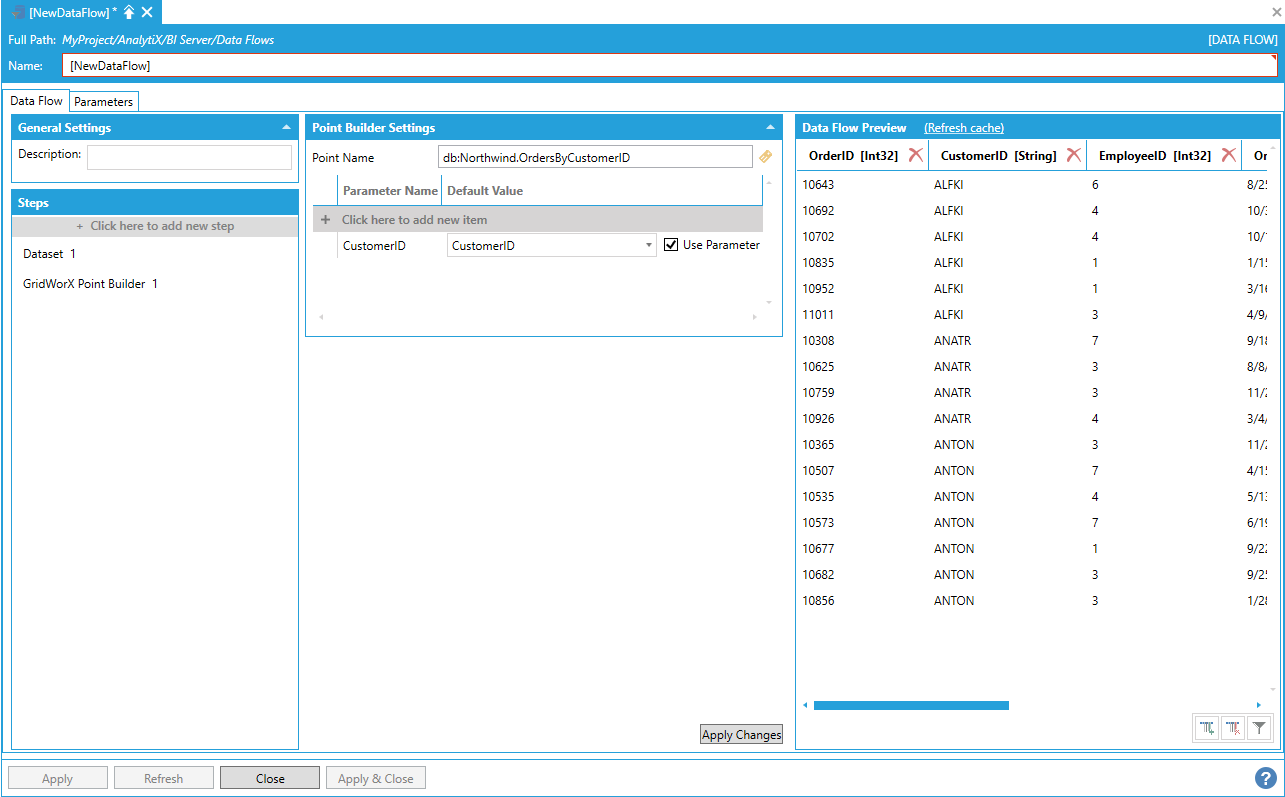
The result is executing the GridWorX data source multiple times for all the rows coming from the previous step, and merging (union) the results in a single dataset.
Return to List of Data Sources
This data source allows for quick ingestion of data from a generic dataset exposed by ICONICS servers.
To start, select Click here to add new step, then select Data Sources > DataSet. You will be presented with the following configuration form.
Data Flow Properties

To fully configure this step, it is necessary to specify the name of the dataset point from which to read the data from.
To enter a point name, select Click here to add new item.
Entering a Point Name
The point name can either be typed manually, browsed by clicking the tag icon, or dropped from the Workbench Data Browser panel. Once a selection is made, click the Apply Changes button and the Data Flow Preview panel will show a preview of the data.
Data Flow Preview of Configured Data
Note: It is possible to ingest multiple datasets at the same time by specifying more than one dataset point under the Data Sources panel. When multiple points are entered, the data flow will merge (union) records from all datasets. In this case, it is required that the datasets have the same schema. Otherwise, an error will occur.
The Point Name for the dataset step can be bound to data flow parameters.
Return to List of Data Sources
This data source allows for efficiently getting a snapshot of multiple real-time points, by reading their current value.
To start, select Click here to add new step, then select Data Sources > Real-time. You will be presented with the following configuration form.
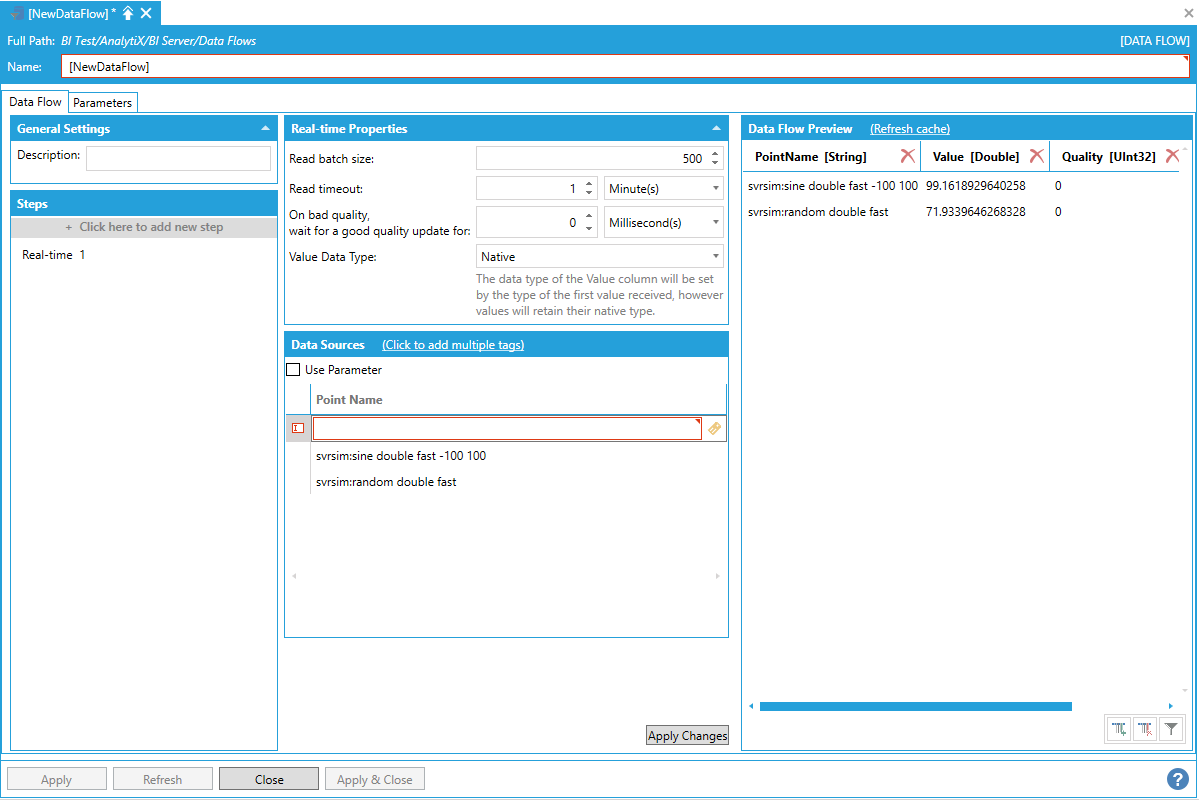
Data Flow Properties
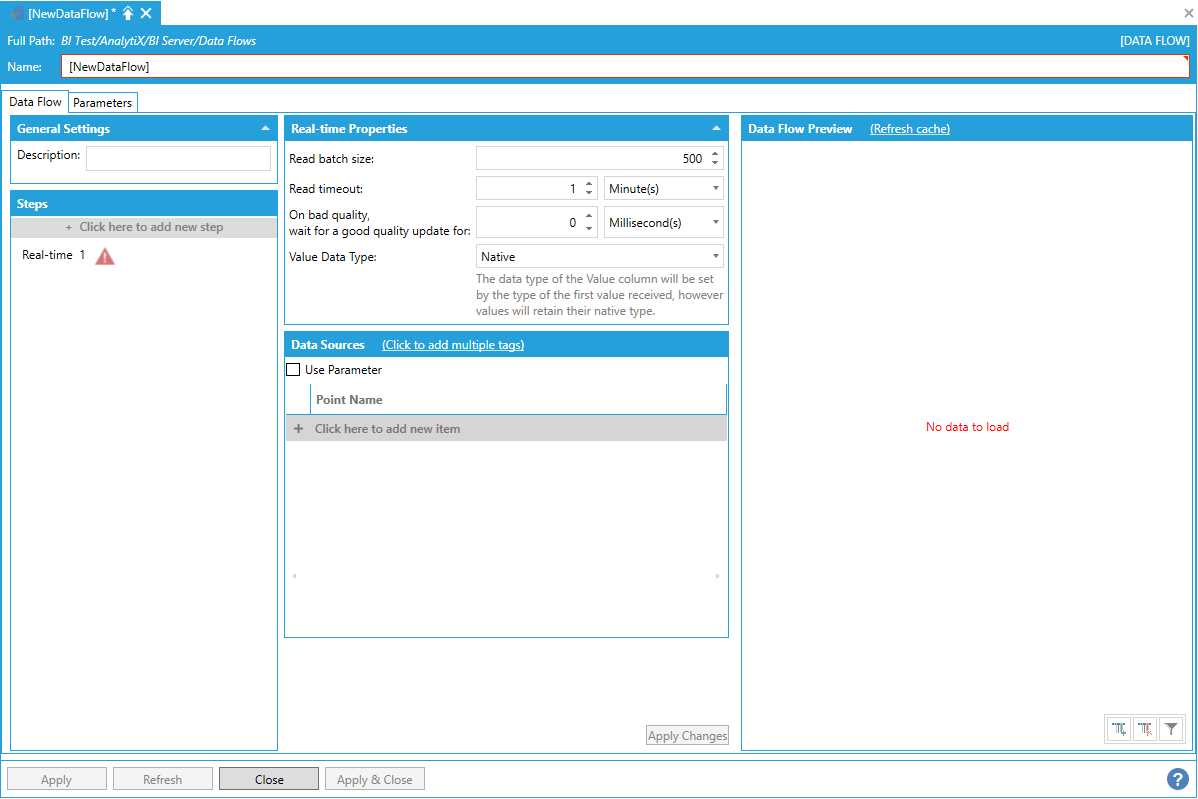
To fully configure this step, it is necessary to specify the name of at least one of real-time point from which to get the current value from.
To enter a point name, select Click here to add new item.
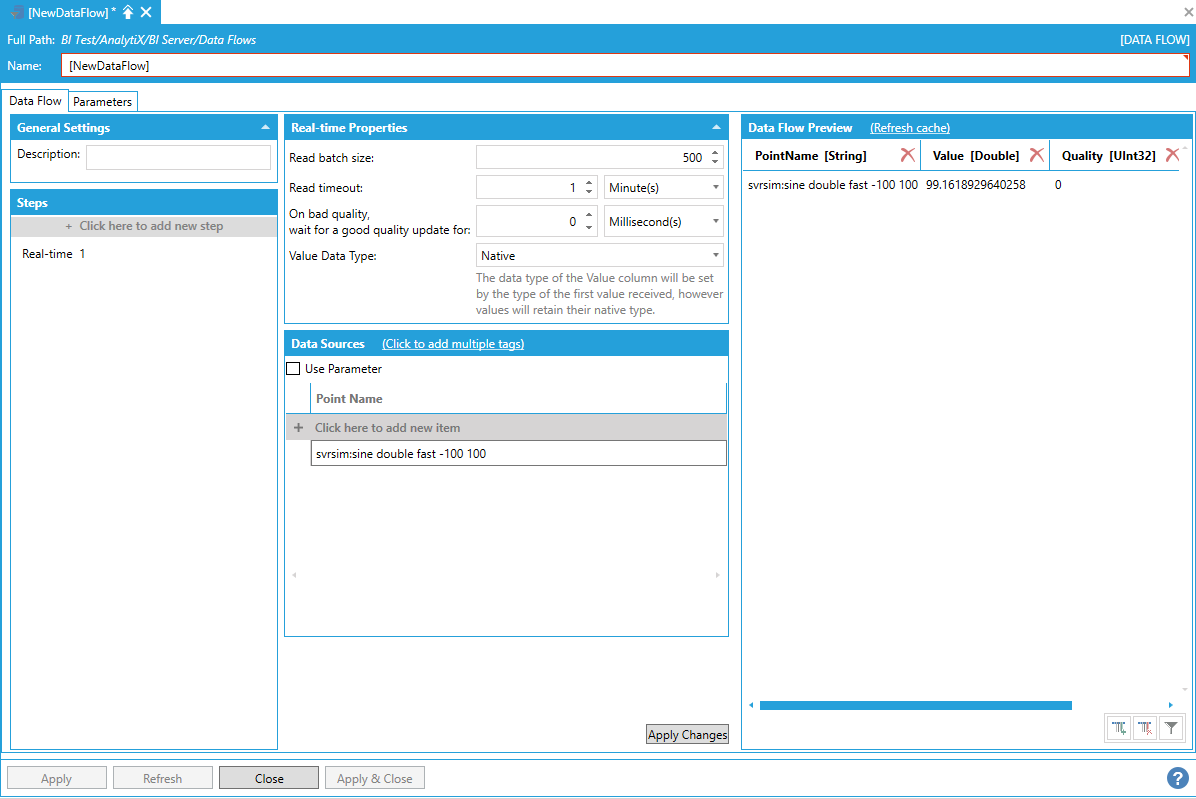
Adding a Point Name

The point name can either be typed manually, browsed by clicking the tag icon, or dropped from the Workbench Data Browser panel. Once a selection is made, click the Apply Changes button and the Data Flow Preview panel will show a preview of the data.
Data Flow Preview of Configured Data
AnalytiX BI data flows can also ingest data for multiple points in one step. To enter more point names, you can select + Click here to add new item multiple times to create entries in the list, or you can use the + Click to add multiple tags link in the header to select multiple tags from the Data Browser at once.
Adding Multiple Points
The Point Name for the dataset step can be bound to data flow parameters, which means it can also be connected to a previous step in the data flow. This allows to pass a dynamic list of points to read to the Real-Time step.
The step’s behavior can be fine-tuned using the parameters available in the form:
Read Batch Size - Defines the maximum number of points to read concurrently. When reading more points than the configured batch size, all the points after the batch size will be queued – when one of the points in the batch finishes the read, the next point in the queue will be scheduled for reading. The order of the reads is not guaranteed.
Read Timeout - Specifies the timeout on each single read operation. If the read times out, the point will have a null value and a bad quality in the data flow’s output.
On bad quality, wait for a good quality update for - When set to a value greater than zero, and the read returns a bad quality value, the step will wait for the configured time for a good quality update from the point before sending the bad quality value to the output.
Value Data Type - This setting allows the user to explicitly set the type of the Value column. For example, in cases where the step is configured to read multiple points (via explicit list or parameter) it is possible that different points return values of a different data type: when the Value Data Type setting is set to the default of Native all the values will retain their own data type, however the overall type of the Value column will be set to the type of the first value received. When using such a data flow as the source for a Data Table, it might cause issues if the values are of incompatible types. When explicitly setting a value other than Native for Value Data Type, the step will try to convert all the values in the Value column to the desired type: if the conversion is not possible (or fails) the value will be set to null and the quality to Bad. This is the recommended option.
Return to List of Data Sources
This data source allows for quick reading of the current value for large amounts of AssetWorX Equipment Properties with minimal configuration.
To start, select Click here to add new step, then select Data Sources > Asset Property Values. You will be presented with the following configuration form.
Data Flow Properties
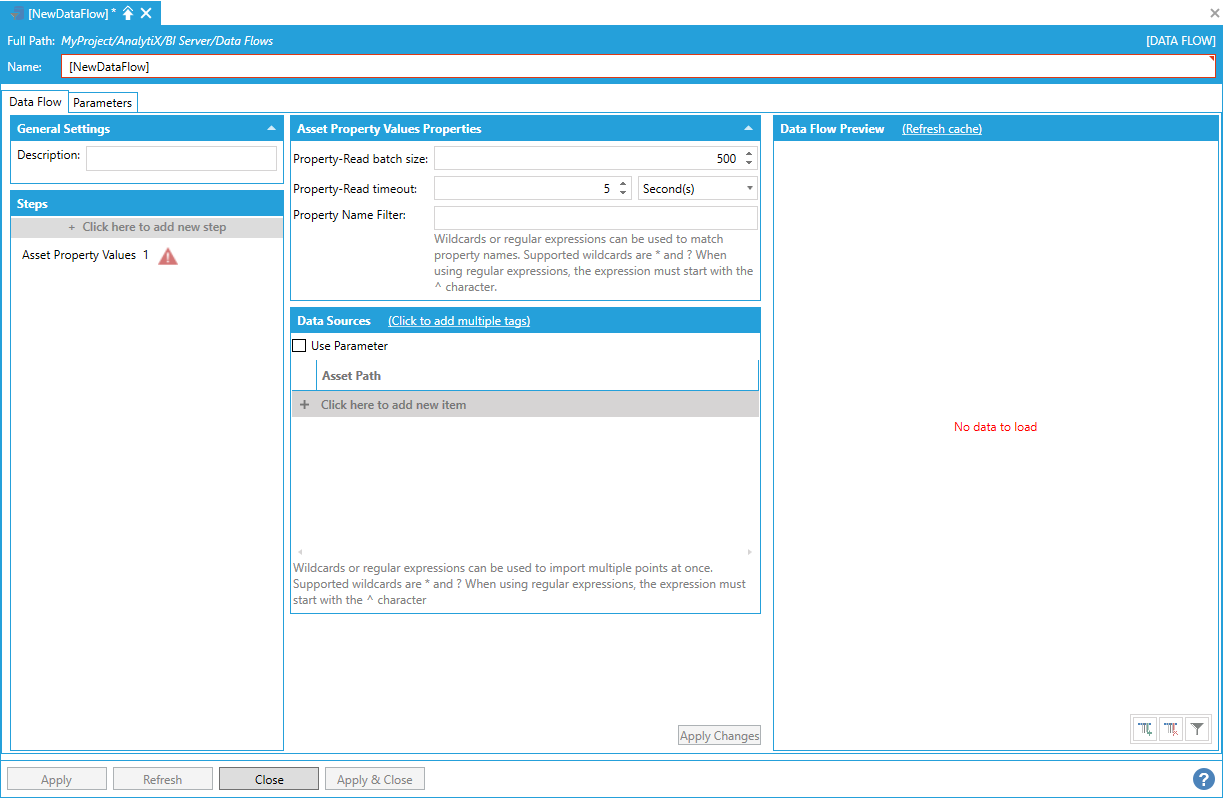
To fully configure this step, it is necessary to specify the path of at least one asset. From this asset, we will get the current values of its properties.
To enter an asset path, select Click here to add new item.
Entering an Asset Path

The asset path can either be typed manually, browsed by clicking on the tag icon, or dropped from the Workbench Data Browser Panel. Once a selection is made, the Data Flow Preview panel will show a preview of the data.
Data Flow Preview of Configured Data
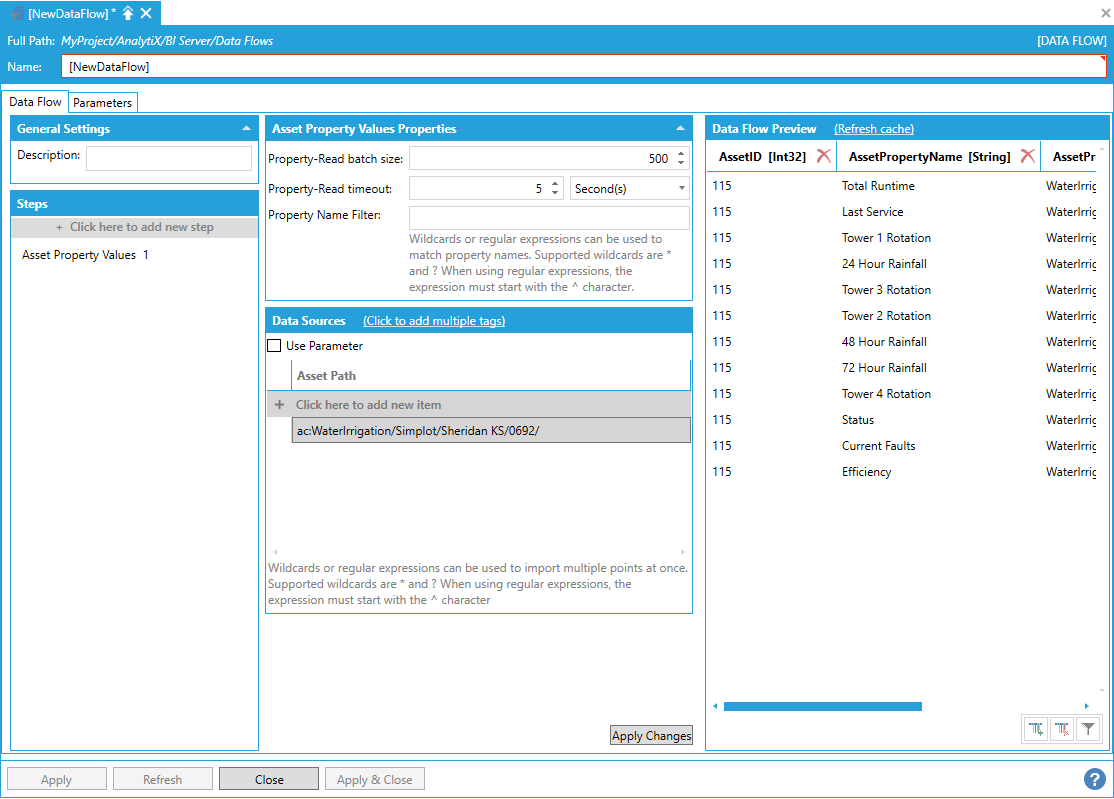
Note: Only Equipment Properties that have their Real Time Data source type configured in AssetWorX will be read by this step.
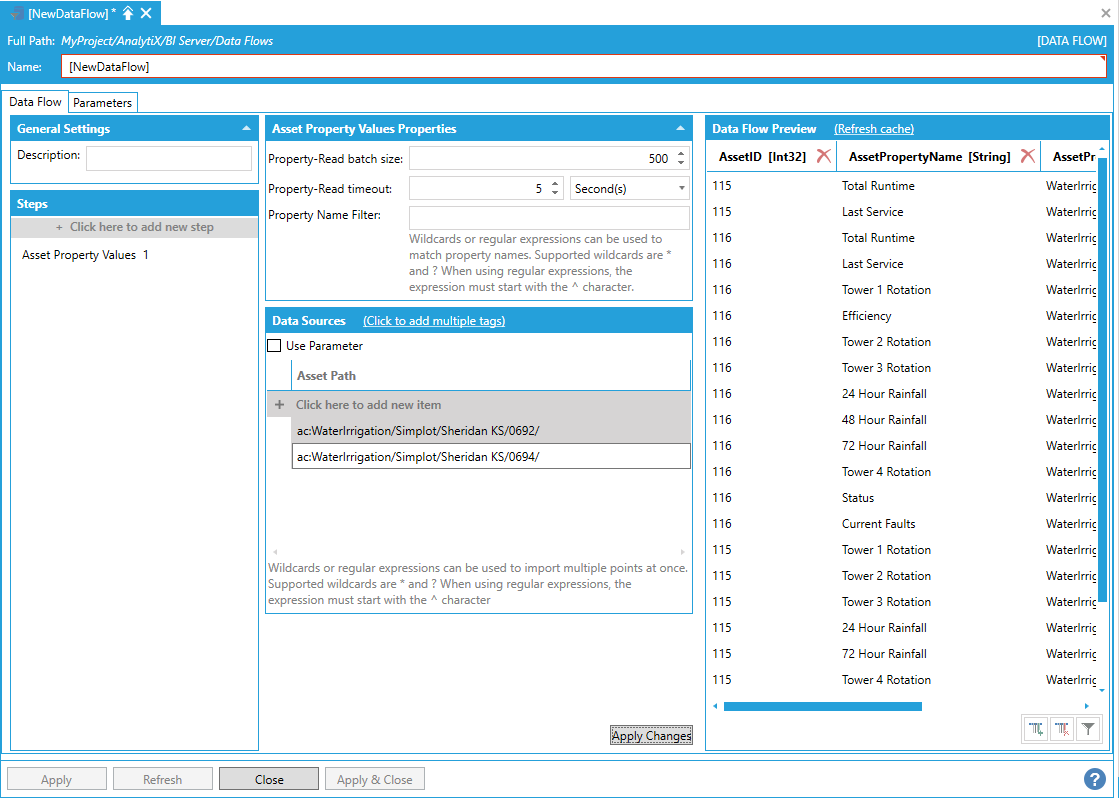
AnalytiX BI Data Flows also allow to quickly ingest data for multiple assets, and there are several different ways to read Equipment Properties from multiple assets within a data flow.
To enter more assets, you can select + Click here to add new item multiple times to create new entries in the list, or you can use the + Click to add multiple tags link in the header to select multiple tags from the Data Browser at once.
Creating Multiple Asset Paths
The final, and most flexible, way of ingesting Equipment Property values for multiple assets is to use the data flow’s built-in wildcard (or regular expression) import. For example, to read Equipment Property values for all assets under the Company asset, the following path containing a wildcard can be used.
Using Data Flow's Built-In Wildcard Importing
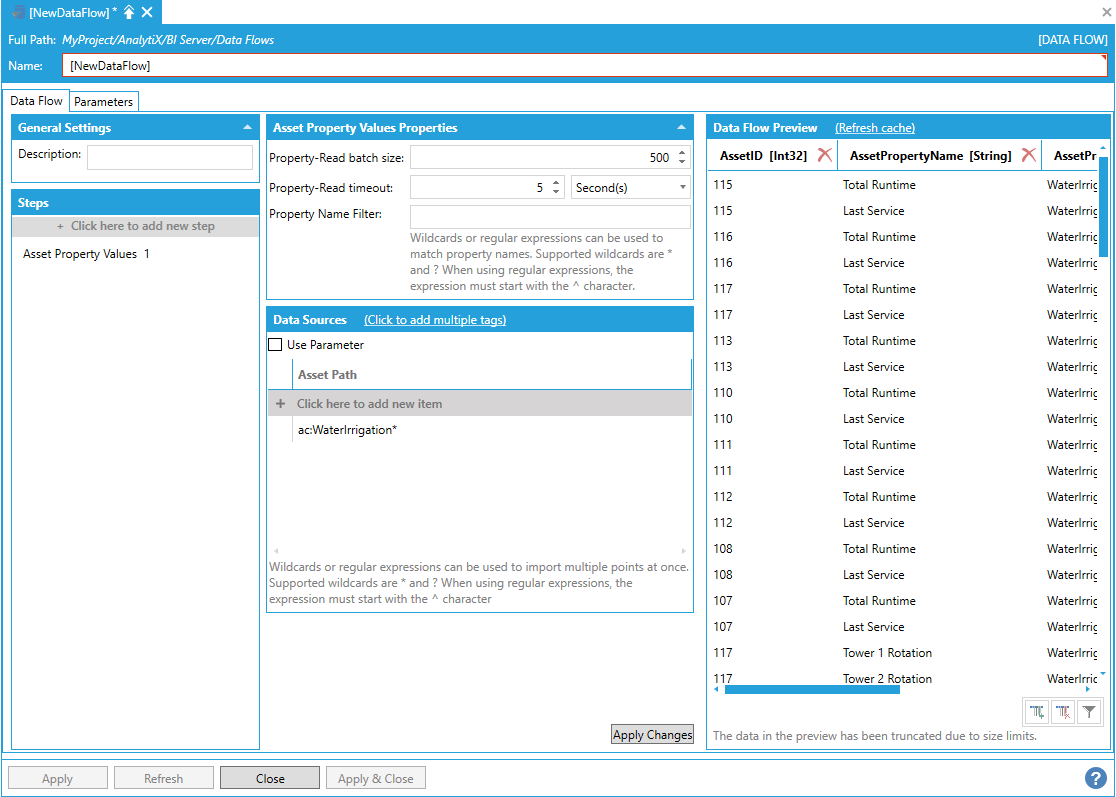
The data flow, when executed, will dynamically query the AssetWorX configuration and read all Equipment Property values for all assets that match the wildcard expression.
In cases where the matching logic is more complex and simple wildcards are not enough, it is possible to use a regular expression to match asset paths. With the following regular expression, we are matching all assets under the “Sheridan KS” asset that start with 6 but not end with 2 (in this way, we don't match the "0692" asset.
^WaterIrrigation/Simplot/Sheridan KS/0\d\d[^2]/
Using a Regular Expression to Match Asset Paths

Note: Regular expressions must start with the ^ character and must not contain the ac: prefix.
Since the Asset Property Values step allows to read large numbers of real-time values from Equipment Properties, the reading process can be fine tuned using the Property-Read batch size, Property-Read timeout and Property Name Filter configuration settings.
Property-Read batch size configures how many Equipment Properties to request at once from AssetWorX. Larger values are likely to make the Data Flow complete faster as the reads execute in parallel, however values too large might strain AssetWorX. When reading more properties than the configured batch size, all the properties after the batch size will be queued – when one of the properties in the batch finishes the read, the next property in the queue will be scheduled for reading. The order of the reads is not guaranteed.
Property-Read timeout configures after how much time a property read does time out. If the read times out, the point will have a null value and a bad quality in the data flow's output.
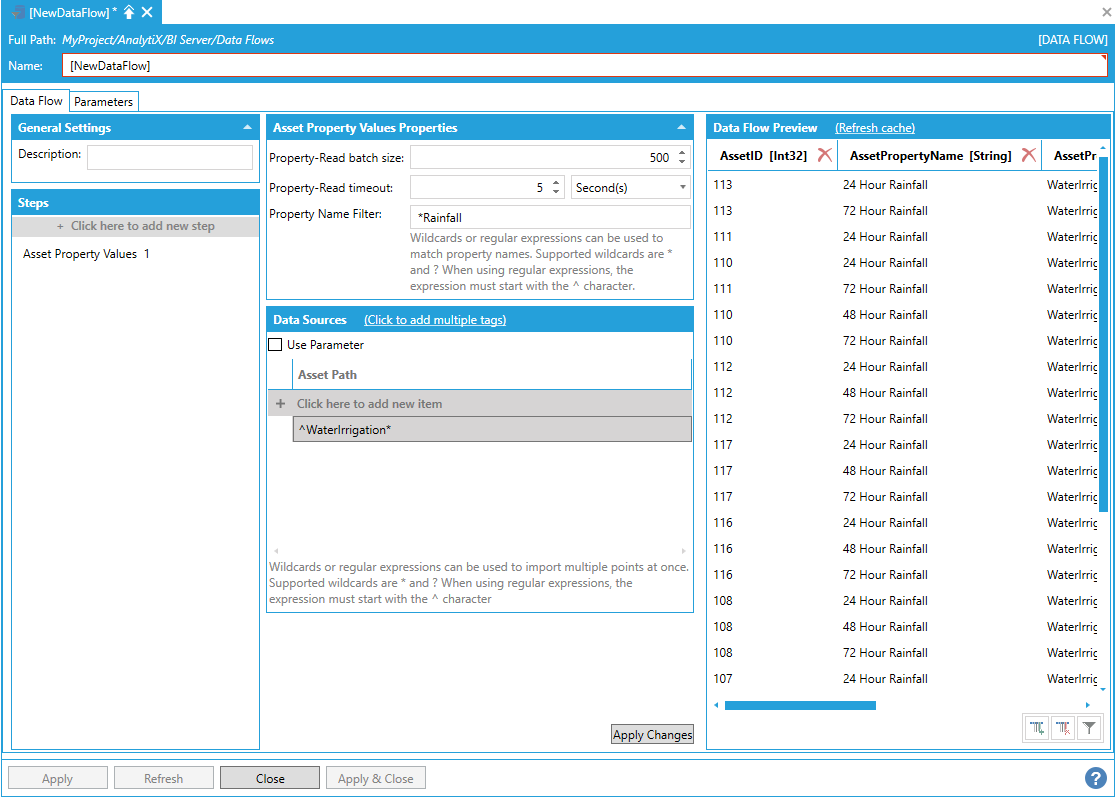
Property Name Filter allows to further filter the equipment properties to read (by default all equipment properties of the selected assets will be read). This field accepts a string filter that can use wildcards (* or ?) or a regular expression (which must start with the ^ character).
For example, we could instruct the Asset Property Reader step to only read equipment properties that end in “Rainfall”
Filtering the equipment properties before reading
The Asset Path for the Asset Property Reader step can be bound to Data Flow parameters, which means it can also be connected to a previous step in the Data Flow. This allows to pass a dynamic list of asset paths to the Asset Property Reader step.
Return to List of Data Sources
Dimensions are special data flows that can be used as input for dimension tables in Data Models and can also contain hierarchical columns. Dimension tables are typically the center of a data model (similar to the Star schema concept) and can then be linked to one or more facts table containing data to enable filtering, drill-down and roll-ups.
Note: Hierarchical columns are always returned in a flat format when data flows are requested from other applications (servers like BridgeWorX or clients like GridWorX Viewer). They are interpreted as hierarchies when used as inputs for AnalytiX BI data models.
Return to List of Data Sources
This dimension source can be used to create a dimension table for AssetWorX Equipment.
To start, select Click here to add new step, then select Dimensions > Assets. You will be presented with the following configuration form.
Data Flow Properties
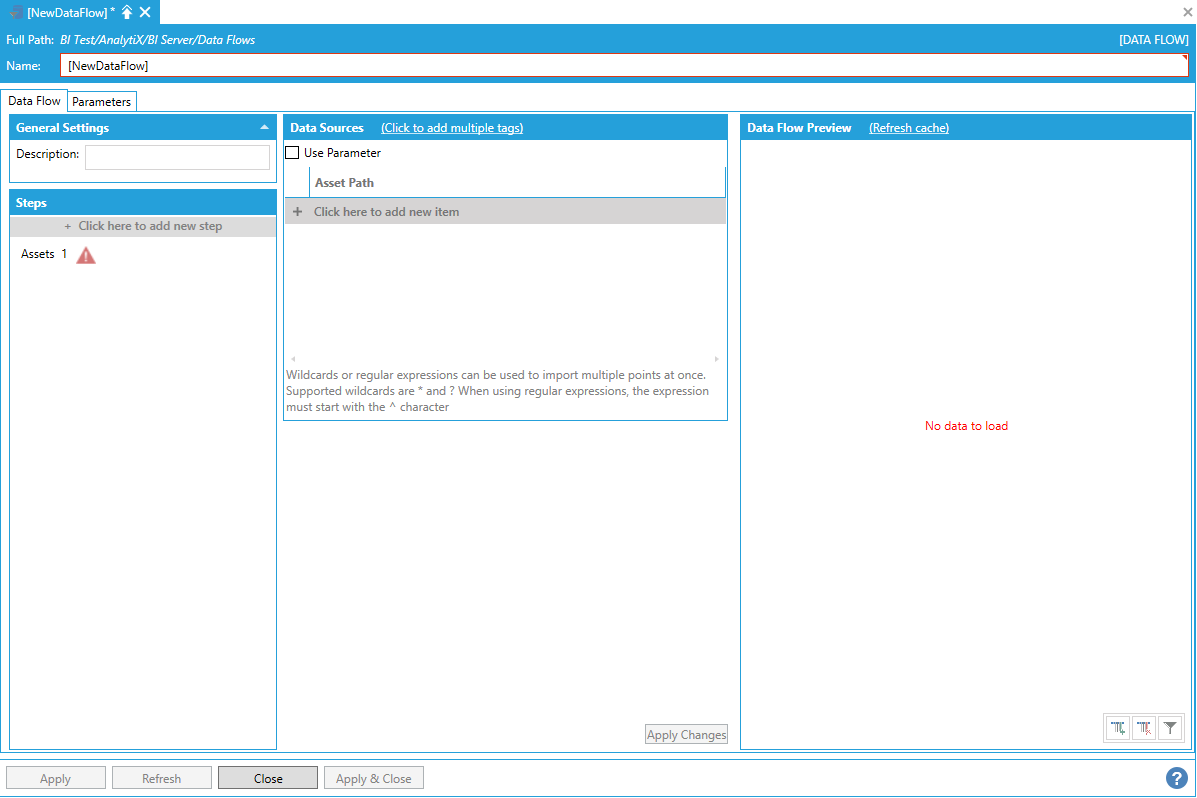
To fully configure this step, it is necessary to specify the path of at least one Asset to import. However, since the main purpose of this step is to eventually feed a dimension table at the center of an AnalytiX BI data model, it is usually necessary to import a whole hierarchy of assets.
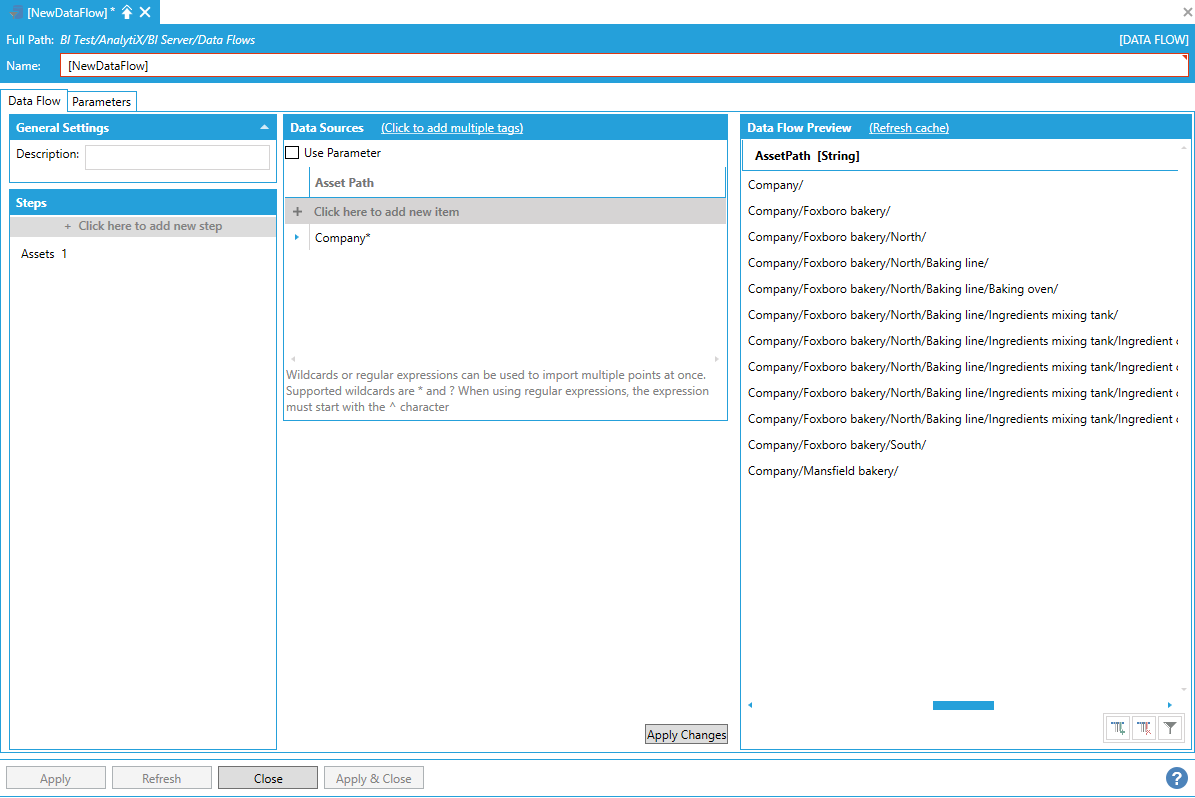
The easiest way of importing all the assets necessary to build a dimension table is to use the data flow’s built-in wildcard (or regular expression) import. For example, to import all assets under the “Company” asset, the following asset path containing a wildcard can be used.
Using the Data Flow's Built-In Wildcard Importing
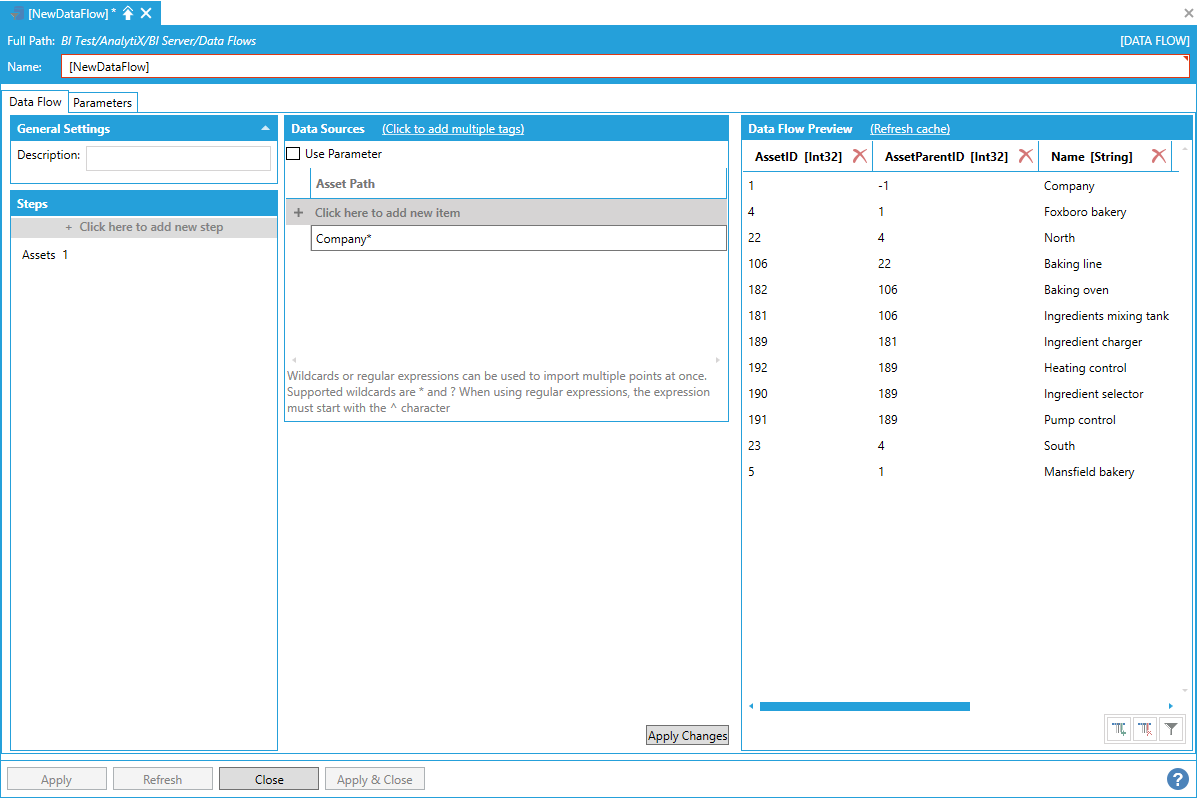
Note: To import the entire asset hierarchy configured in AssetWorX, the * wildcard can be used alone as Asset Path. It is also possible to use a regular expression for more sophisticated matching.
Note: Regular expressions must start with the ^ character and must not contain the ac: prefix.
The AssetPath column in the processed dataset represents the full path of the asset in the hierarchy.
Utilizing the Asset Path
The AssetPath column is also the dimension’s hierarchical column. The individual levels of the dimension are flattened out as columns in the processed dataset.
Individual Dimension Levels Flattened Out as Columns
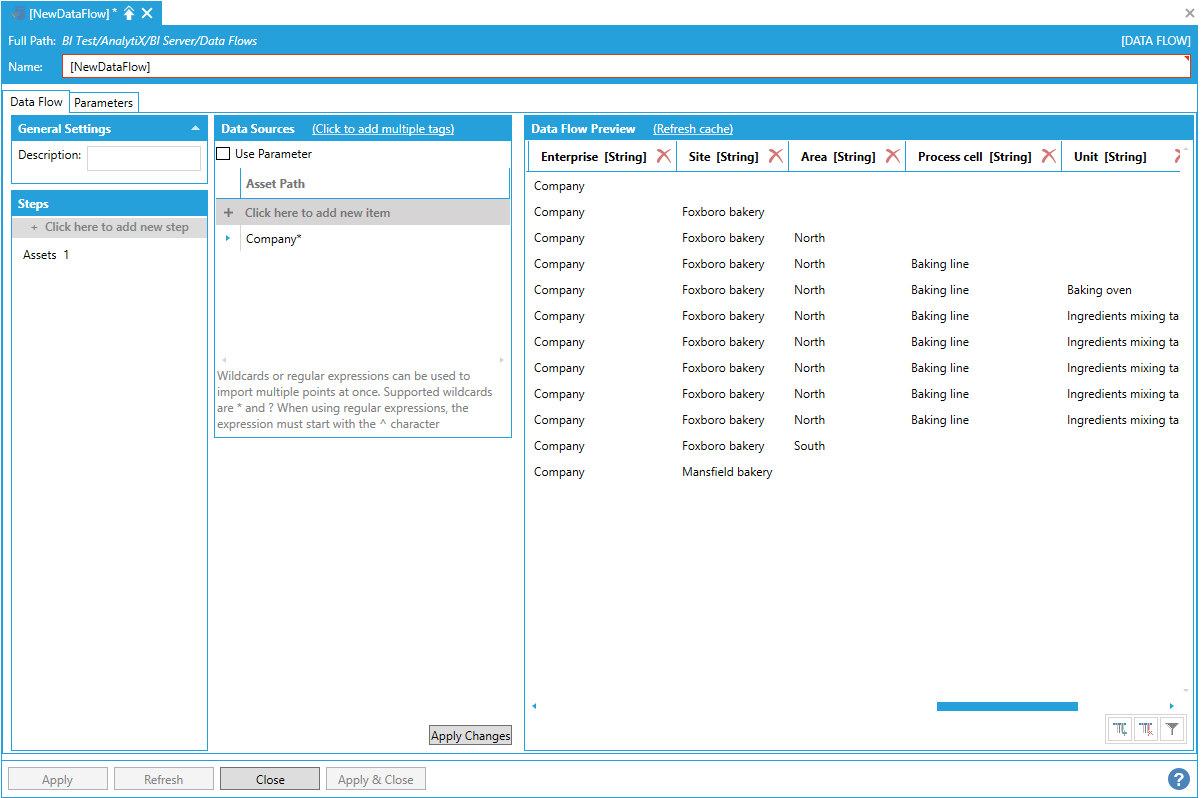
Note: AnalytiX BI tries to infer the name of the levels from the configured levels in AssetWorX and the level configuration of the individual assets. Dimension levels can be renamed by just renaming the associated column in the data flow.
The Asset Path for the Dimensions > Assets step can be bound to data flow parameters, which means it can also be connected to a previous step in the data flow. This allows to pass a dynamic list of asset paths to the Dimensions > Assets step.
Return to List of Data Sources
This dimension source can be used to create a child dimension table containing AssetWorX Equipment Properties.
To start, select + Click here to add new step, then select Dimensions > Asset Properties. You will be presented with the following configuration form.
Data Flow Properties
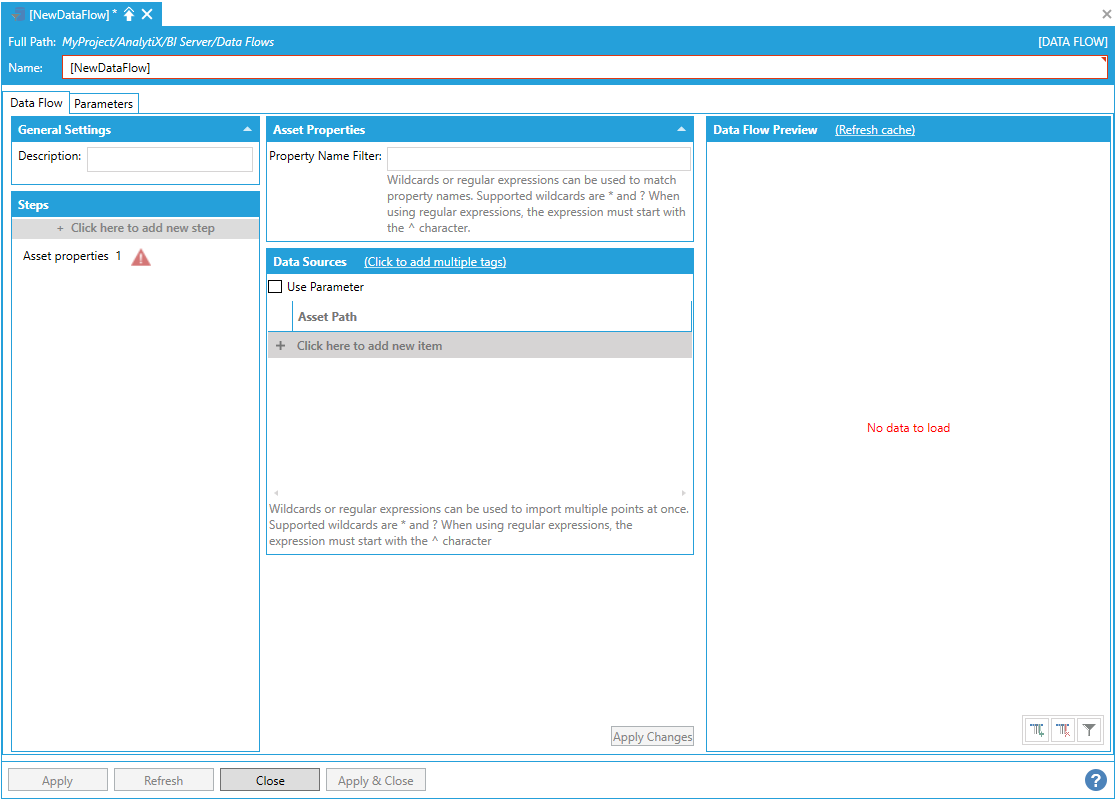
To fully configure this step, it is necessary to specify the path of at least one asset. However, since the main purpose of this step is to eventually feed a child dimension table for an AnalytiX BI data model, most users will want to import a whole hierarchy of Equipment Properties.
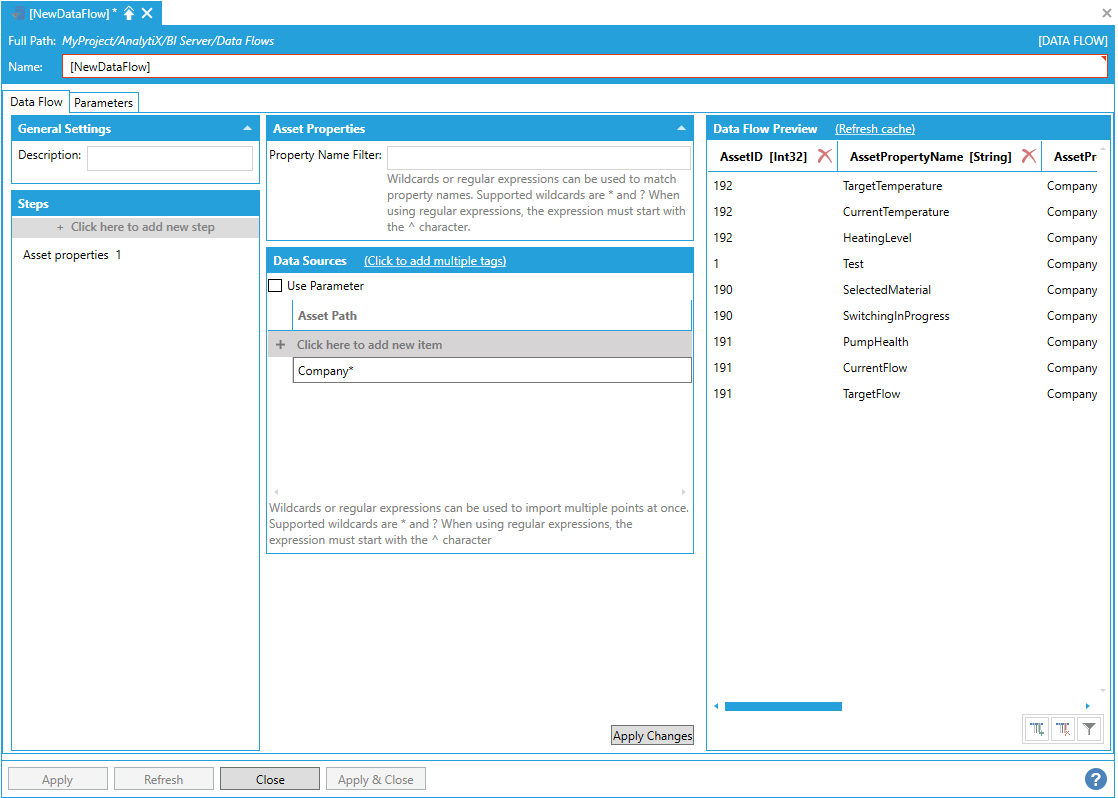
The easiest way of importing all the Equipment Properties necessary to build a dimension table is to use the data flow’s built-in wildcard (or regular expression) import. For example, to import all equipment properties for all assets under the “Company” asset, the following asset path containing a wildcard can be used.
Using the Data Flow's Built-In Wildcard Importing
Note: To import the entire asset hierarchy configured in AssetWorX, the * wildcard can be used alone as Asset Path. It is also possible to use a regular expression for more sophisticated matching.
Note: Regular expressions must start with the ^ character and must not contain the ac: prefix.
The processed dataset can then be linked to an Asset dimension table via the AssetID column used as a foreign key. The processed dataset also includes Boolean columns that indicate whether the Equipment Property exposes a real-time value, a dataset value or an historical value.
The Property Name Filter field allows to further filter the equipment properties to read (by default all equipment properties of the selected assets will be read). This field accepts a string filter that can use wildcards (* or ?) or a regular expression (which must start with the ^ character).
For example, we can use the following regular expression to only return equipment properties that end with Temperature or Flow:
^.+(Temperature|Flow)
Filtering Equipment Properties Using Property Name Filter

The Asset Path for the Dimensions > Asset Properties step can be bound to data flow parameters, which means it can also be connected to a previous step in the data flow. This allows to pass a dynamic list of asset paths to the Dimensions > Assets Properties step.
Return to List of Data Sources
This dimension source can be used to create a dimension table for Hyper Historian tags.
To start, select Click here to add new step, then select Dimensions > Historical Tags. You will be presented with the following configuration form.
Data Flow Properties

To fully configure this step, it is necessary to specify at least one tag to import. However, since the main purpose of this step is to eventually feed a dimension table at the center of an AnalytiX BI Data Model, it is usually necessary to import a whole hierarchy of tags.
The easiest way of importing all the tags necessary to build a dimension table is to use the data flow’s built-in wildcard (or regular expression) import. In the example below, we have built a hierarchy of electric meter tags in Hyper Historian resembling the structure of a building campus.
Using the Data Flow's Built-In Wildcard Importing
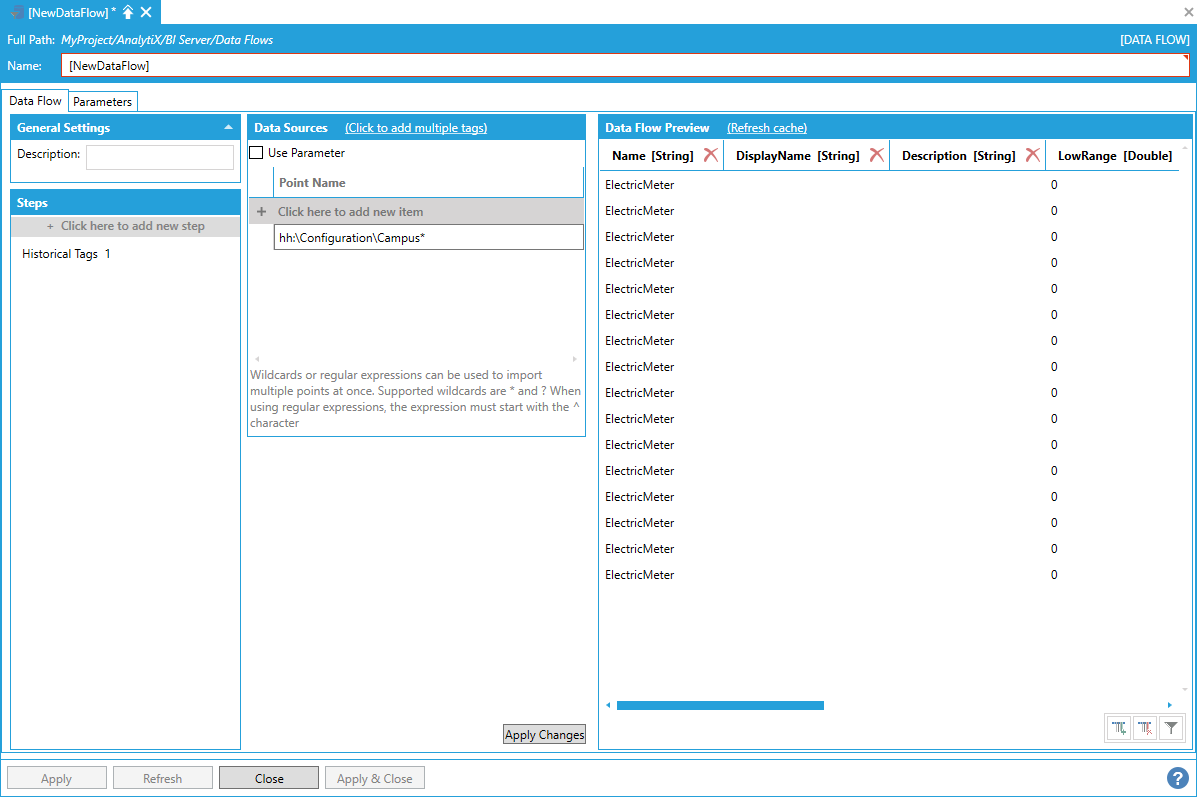
Note: To import the entire tag hierarchy configured in Hyper Historian, the * wildcard can be used alone as Point Name. It is also possible to use a regular expression for more sophisticated matching.
Note: Regular expressions must start with the ^ character.
The PointName column in the processed dataset represents the full path of the tags in the hierarchy.
Using the Point Name Column

The PointName column is also the dimension’s hierarchical column. The individual levels of the dimension are flattened out as columns in the processed dataset.
Individual Dimension Levels Flattened Out as Columns in the Processed Dataset
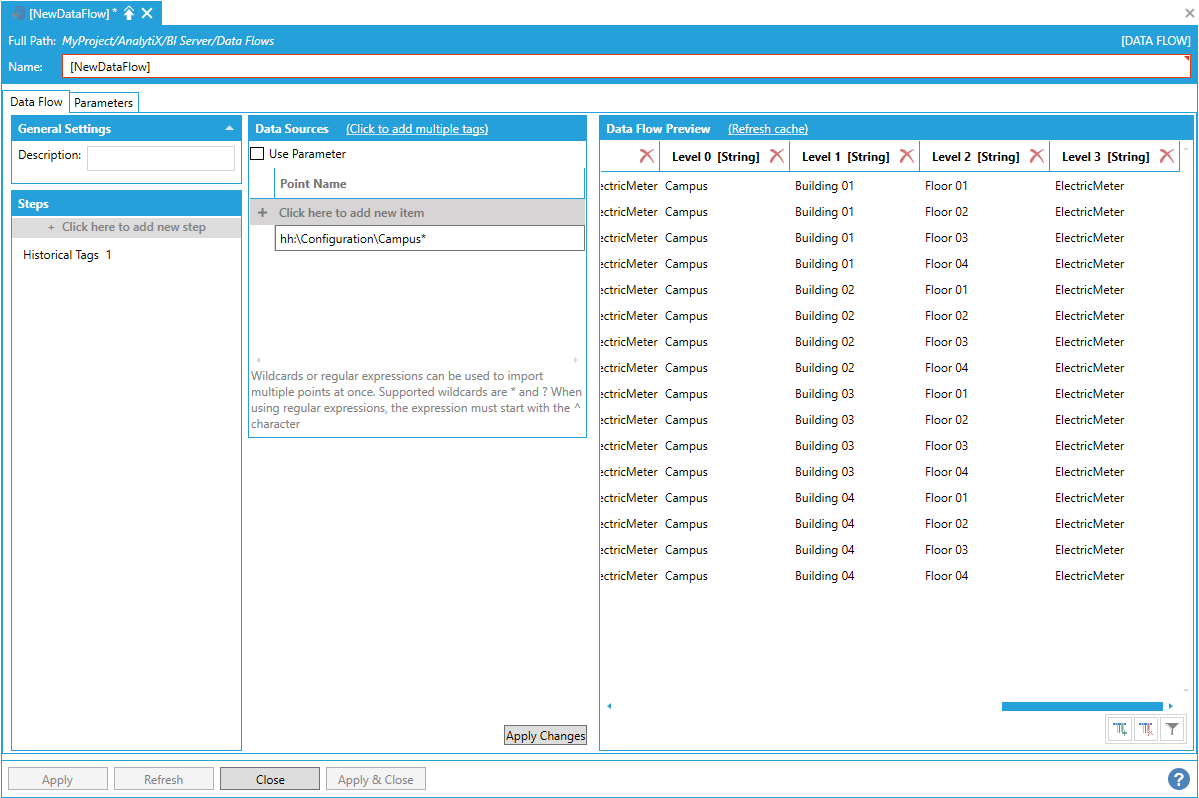
Note: Hyper Historian does not have the same concept of levels as AssetWorX, so AnalytiX assigns level names based on the position in the hierarchy. The topmost level will be named “Level 0”, the next “Level 1” and so on. Dimension levels can be renamed by just renaming the associated column in the data flow.
The Point Name for the Dimensions > Historical Tags step can be bound to data flow parameters, which means it can also be connected to a previous step in the data flow. This allows to pass a dynamic list of point names to the Dimensions > Historical Tags step.
Return to List of Data Sources
This dimension source can be used to create a date and time dimension.
To start, select + Click here to add new step, then select Dimensions > Time. You will be presented with the following configuration form.
Data Flow Properties

To fully configure this step, it is necessary to specify the start and end time for the dimension and the dimension resolution, which determines the step at which the time increases from the start time to the end time.
Configuring the Time Dimension

The time dimension contains several useful columns, including the individual parts of the date and time, the week number in the year, the month and day names (both in full and short format) and whether a day falls on the weekend or not.
The Start Time, End Time and Resolution for the Dimensions > Time step can all be bound to data flow parameters, which means they can also be connected to a previous step in the data flow.
Return to List of Data Sources
This step allows for parsing a JSON-formatted string, and representing JSON objects in a tabular format.
By itself, the Parse JSON step cannot produce any data, so it has to be added after a data source step that returns some JSON-formatted data (typically a web service). In the example below, we add a DataSet step that reads a web service point.
Adding a DataSet Step that Reads a Web Service Point
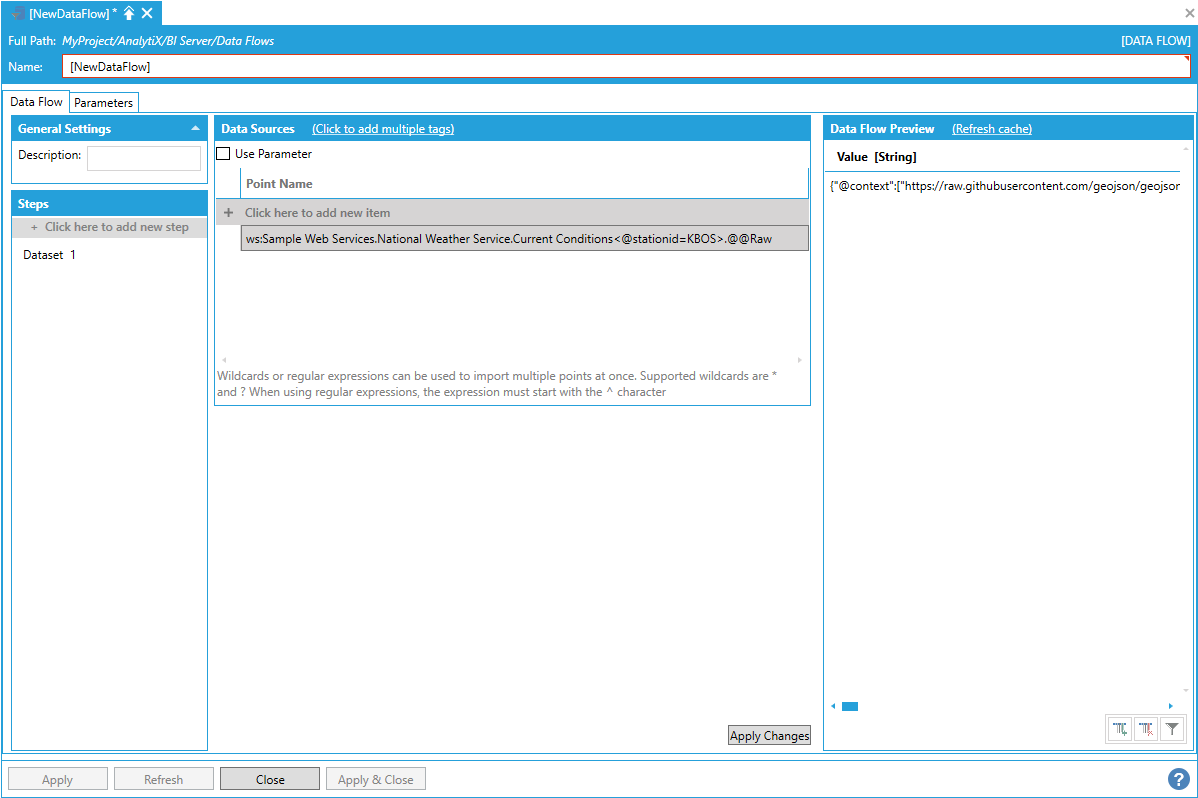
Note: When requesting the @@Raw point from any configured web method in the Web Services point manager, the result will be a one column, one row dataset containing the method’s response as a string.
To start, select +Click here to add new step, then select Parse JSON. You will be presented with the following configuration form.
Selecting Parse JSON
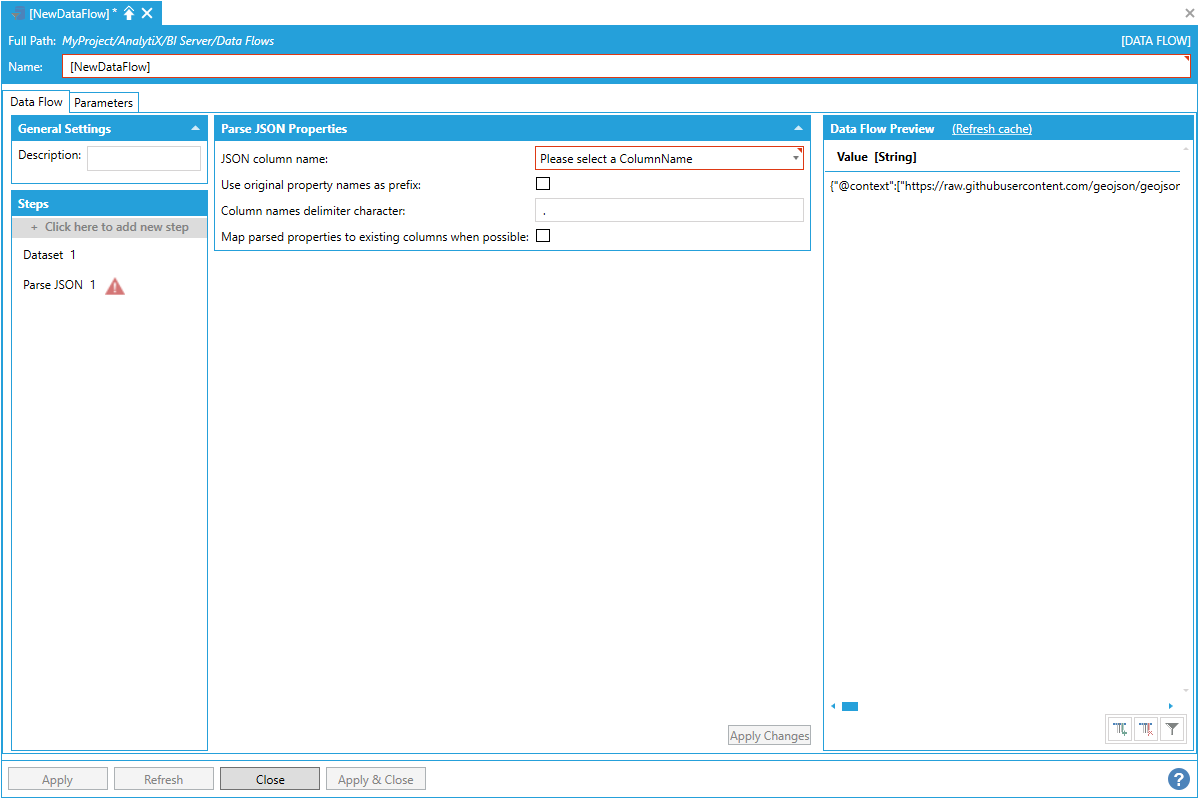
To fully configure this step, it is necessary to select a column that contains JSON as the step’s JSON column name. The chosen column must contain strings formatted as JSONs.
Selecting a JSON Column Name

The step will parse the JSON in the column and will transform it into tabular format. The mapping logic applied by the step is as follows:
JSON Objects are be expanded into a single row. For each property of the JSON object, a column with the same name will be appended to the output dataset.
JSON Arrays are expanded into multiple rows. For each element of the JSON array, a new row will be generated in the output dataset.
If a property of a JSON object (or an element of a JSON array) contains a JSON object (or a JSON array), the value of the property in the output dataset will contain the JSON string. In the example above, the Value column contained a JSON object, which has been mapped to several columns (id, type, geometry, properties).
Since two of the properties are JSON objects themselves (geometry and properties), we can apply another Parse JSON step to further parse the geometry property and expand the output dataset.
Further Parsing the Geometry Property and Expanding the Output Dataset
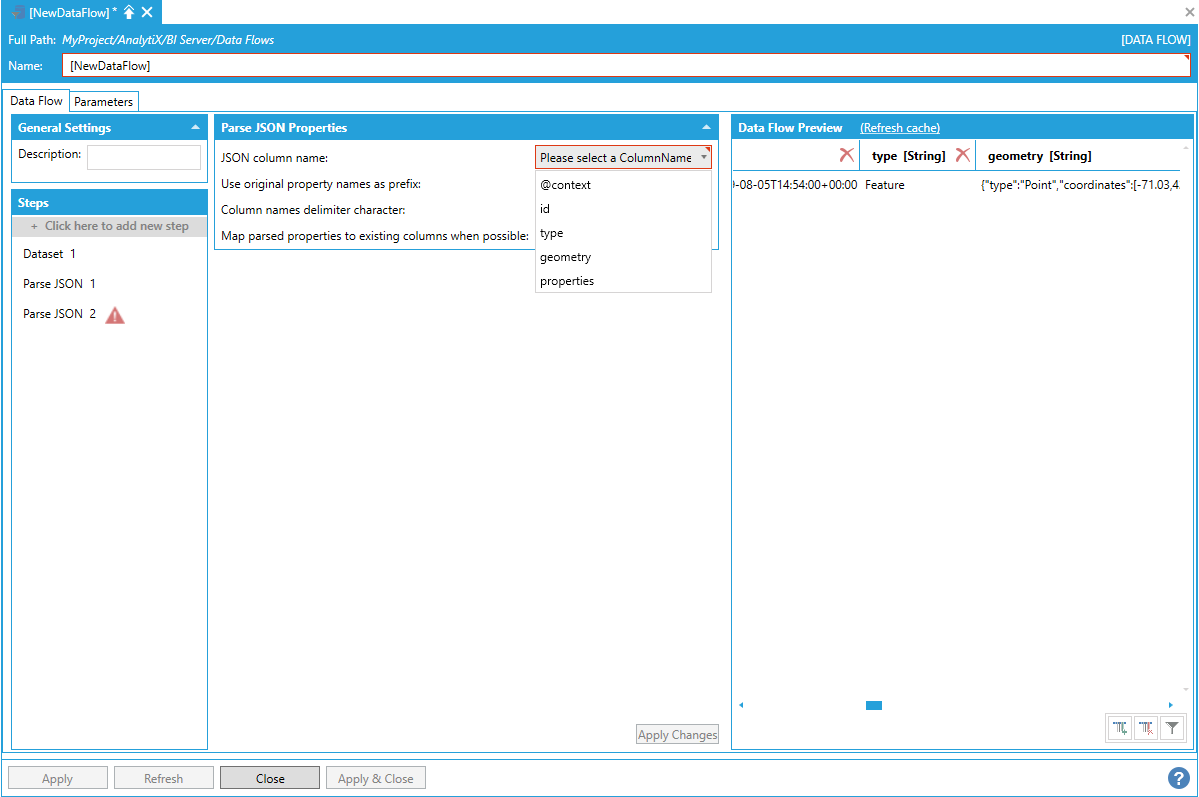
The geometry property contains a JSON object that has a property named “type”, which will produce a second “type” column in the output dataset, causing an error.
Error Caused by Second Type Column in Output Dataset
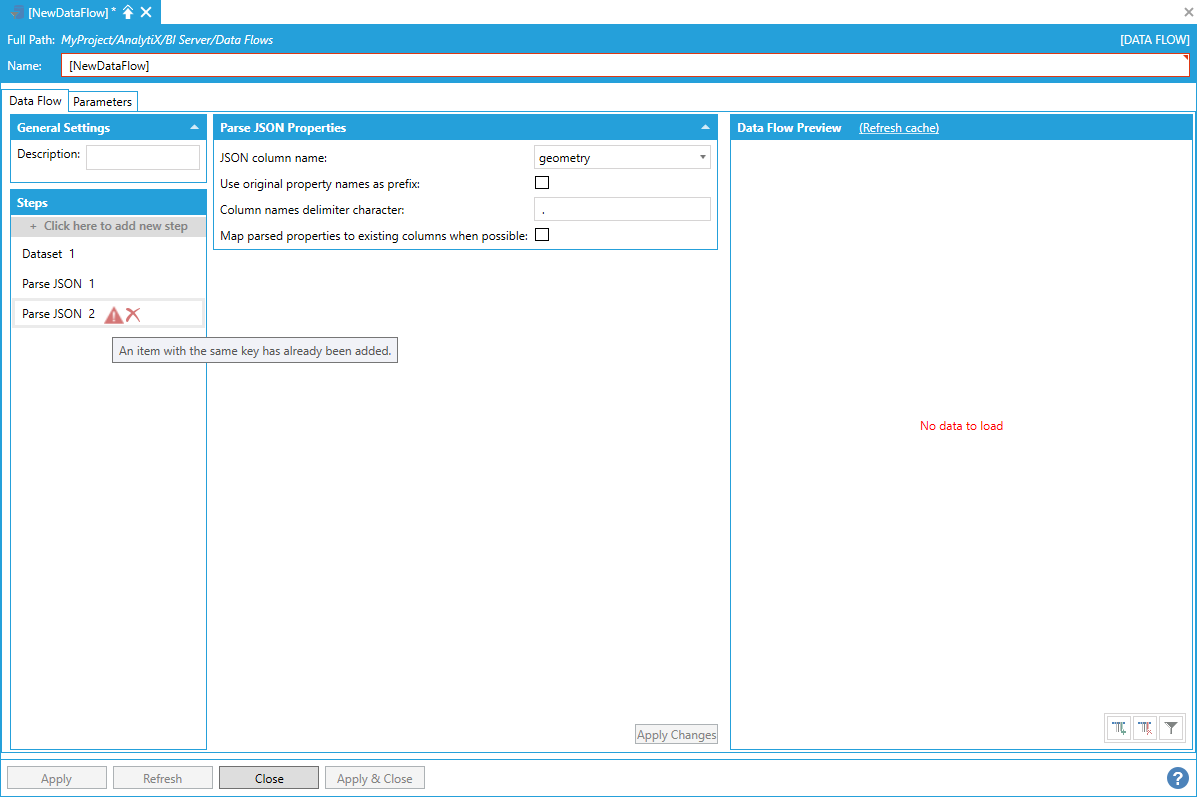
This might happen when flattening a hierarchy. To solve the issue, we can check the Use Original Property Names as Prefix checkbox, which will prepend column names with the parent property name, thus creating unique column names.
Checking 'Use Original Property Names as Prefix'

The geometry.coordinates column contains a JSON array, which we can further parse with another Parse JSON step.
geometry.coordinates Column Populated with a JSON Array
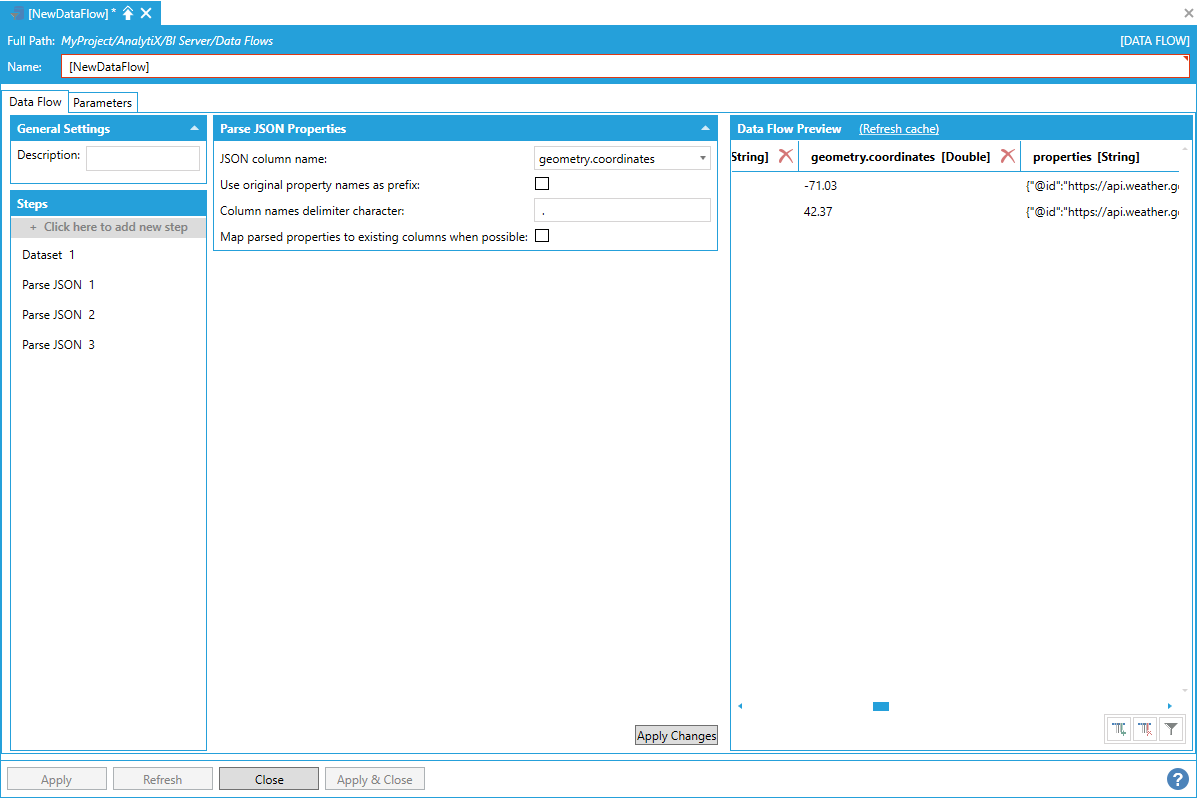
The geometry.coordinates column has been expanded into the individual array items, one row per each item in the array. Values for other columns are duplicated for all inserted rows.
It is possible to keep adding Parse JSON steps in order to parse and map JSON objects of any complexity.
The step’s behavior can be fine-tuned using the parameters available in the form:
Use original property names as prefix. As described above, this setting prefix the expanded property names with the name of the parent property.
Column names delimiter character. Allows to customize the separator character between the property name and the parent property name when use original property names as prefix is checked.
Map parsed properties to existing columns when possible. This is a setting that is useful in advancing parsing scenarios dealing with dynamic JSON schemas. You can add empty columns to the data flow and, when this setting is checked, the Parse JSON step will try to map a parsed property to an existing column with the same name rather than creating a new column in the output schema.
Return to List of Data Sources
This step allows to create new columns in the output dataset by defining an expression that will be evaluated for each row in the dataset to produce the value of the new column.
The Add Column step can produce data on its own when the expression returns a constant value or uses a built-in function like now(). However, it is most useful when added after a data source step. In the example below, we added a Hyper Historian Aggregated Data step that reads the average of some historical tags at 1-hour intervals.
Adding a Hyper Historian Aggregated Data Step

The output dataset only contains the Timestamp of the samples. However, assume that, for data modeling purposes, we are interested to which day of the week the sample corresponds.
To add this new column to our dataset, select + Click here to add new step, then select Add Column. You will be presented with the following configuration form.
Data Flow Properties

To fully configure this step, it is necessary to specify the new column’s name and the expression that will calculate the new column’s values. It is possible to enter the expression manually in the Expression field, select Configure the expression to launch the Expression Editor.
Launching the Expression Editor

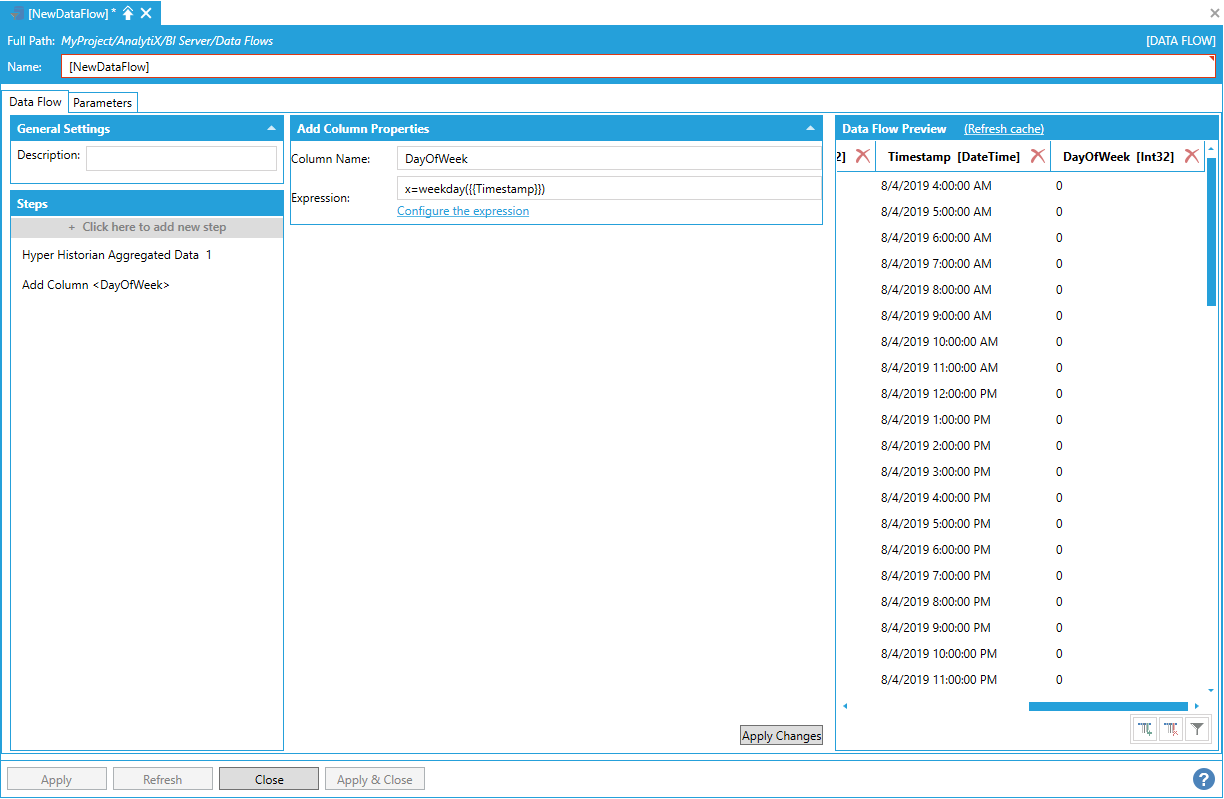
Notably, all the columns from the previous step are available as variables for the expression and can be utilized to produce the new column’s value. In the example above, we are calling the new column DayOfWeek and using the expression weekday({{Timestamp}}) to extract the day of the week from the timestamp column.
After clicking OK and clicking the Apply Changes button, the data flow displays the new column with the values computed by evaluating the expression for each row.
Data Flow Displaying the New Column with Values Computed by Evaluating the Expression for Each Row
There is no limit to the number of Add Column steps that can be added to a data flow. Each new step can use columns coming from the previous step as variables in the expression, including previously added columns.
Adding 'Add Column' Steps to the Data Flow

Return to List of Data Sources
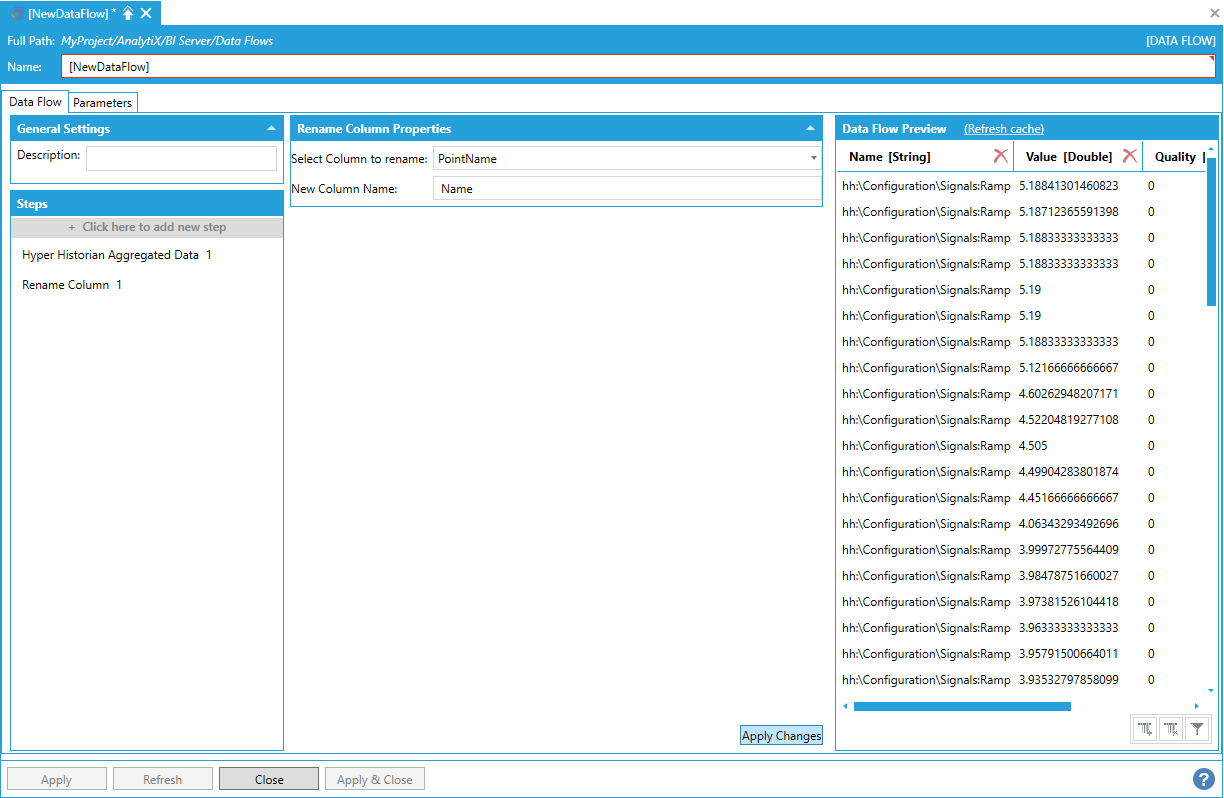
This step allows renaming a column in the output dataset.
By itself, the Rename Column step cannot produce any data, so it must be added after a data source step. In the example below, we added a Hyper Historian Aggregated data step that reads the average of some historical tags at 1-hour intervals.
Adding a Hyper Historian Aggregated Data Step

Assume we want to rename the PointName column to “Name”.
To rename the column, select + Click here to add new step, then select Rename Column. You will be presented with the following configuration form.
Data Flow Properties

To fully configure this step, it is necessary to select the column to rename from the list of currently available columns in the output dataset and specify the new column’s name. Once the selections have been made, click the Apply Changes button and the Data Flow Preview panel will update to reflect the changes.
Selecting the Column to Rename
The renamed column must be addressed using the new name in all subsequent steps.
Alternatively, it is also possible to click on the column header in the Data Flow Preview panel and enter the new name of the column there. The Steps panel will then automatically update to reflect the change.
Renaming the Column in the Column Header in the Data Flow Preview Panel

Note: The new column name must be a static string and cannot be an expression.
Return to List of Data Sources
This step is, in concept, very similar to the Add Column steps, with the only difference that the new column defined by the expression will replace one of the existing columns. You can think of this step as a Remove step and an Add Column step combined.
By itself, the Transform Column step cannot produce any data, so it must be added after a data source step. In the example below, we added a Hyper Historian Aggregated Data step that reads the average of some historical tags at 1-hour intervals.
Adding a Hyper Historian Aggregated Data Step

Assume we want to transform the Value column by rounding the values to two decimal places.
To transform the column in our dataset, select Click here to add new step, then select Transform Column. You will be presented with the following configuration form.
Data Flow Properties
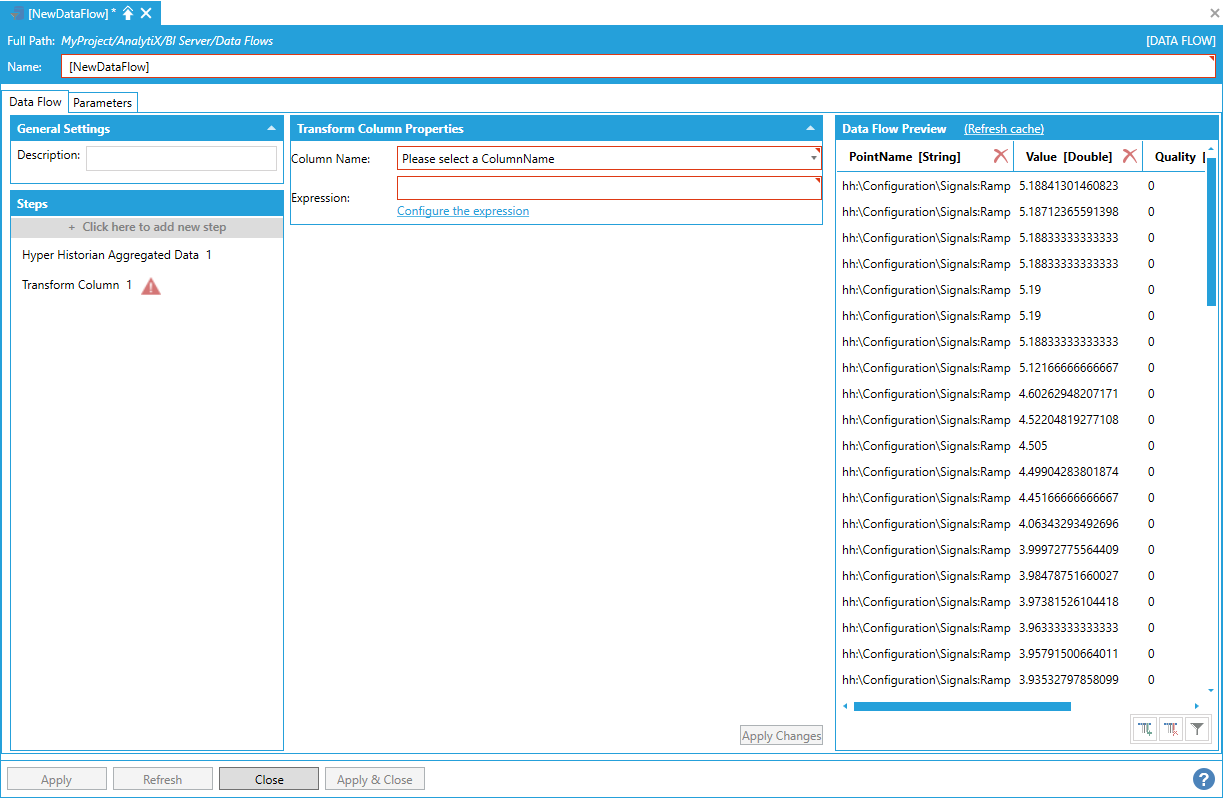
To fully configure this step, it is necessary to select the column to transform from the list of currently available columns in the output dataset and the expression that will calculate the transformed column’s values. It is possible to enter the expression manually in the Expression box, or select Configure the expression to launch the Expression Editor.
Launching the Expression Editor
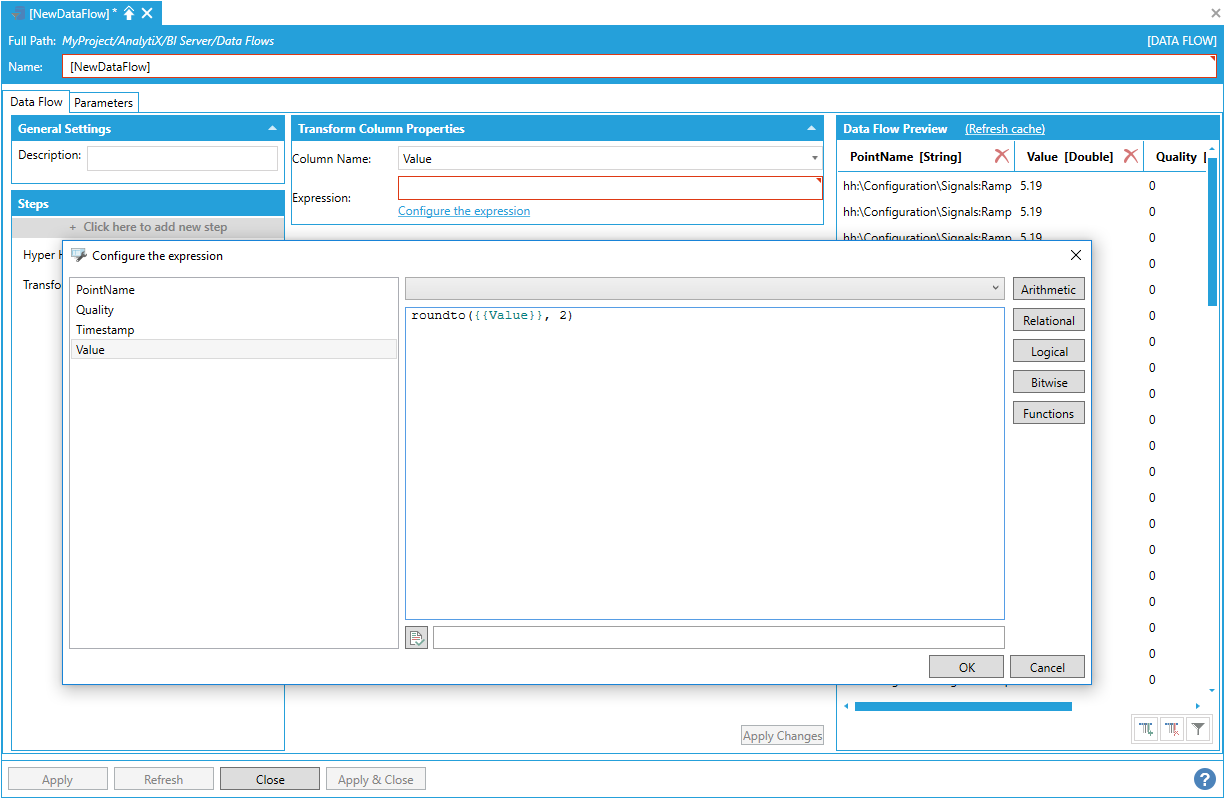
Notably, all the columns from the previous step are available as variables for the expression and can be utilized to produce the new column’s value. The expression is not limited to the values of the column being transformed.
After selecting OK and clicking the Apply Changes button data flow displays the transformed column with the values computed by evaluating the expression for each row.
Data Flow Displaying Transformed Column with Values Computed by Evaluating the Expression for Each Row

There is no limit to the number of Transform Column steps that can be added to a data flow.
Return to List of Data Sources
This step allows removing one or more columns from the output dataset.
By itself, the Remove Column step cannot produce any data, so it must be added after a data source step. In the example below, we added a Hyper Historian Aggregated Data step that reads the average of some historical tags at 1-hour intervals.
Adding a Hyper Historian Aggregated Data Step
Assume we want to remove the Quality column.
To remove the column, select Click here to add new step, then select Remove Column. You will be presented with the following configuration form.
Data Flow Properties

To fully configure this step, it is necessary to select one or more columns to remove from the list of currently available columns in the output dataset. The columns that are unchecked in the list will be removed. Once the selection has been made,click the Apply Changes button and the data flow Preview panel will update to reflect the changes.
Selecting a Column/Columns to Remove from the List of Currently Available Columns in the Output Dataset
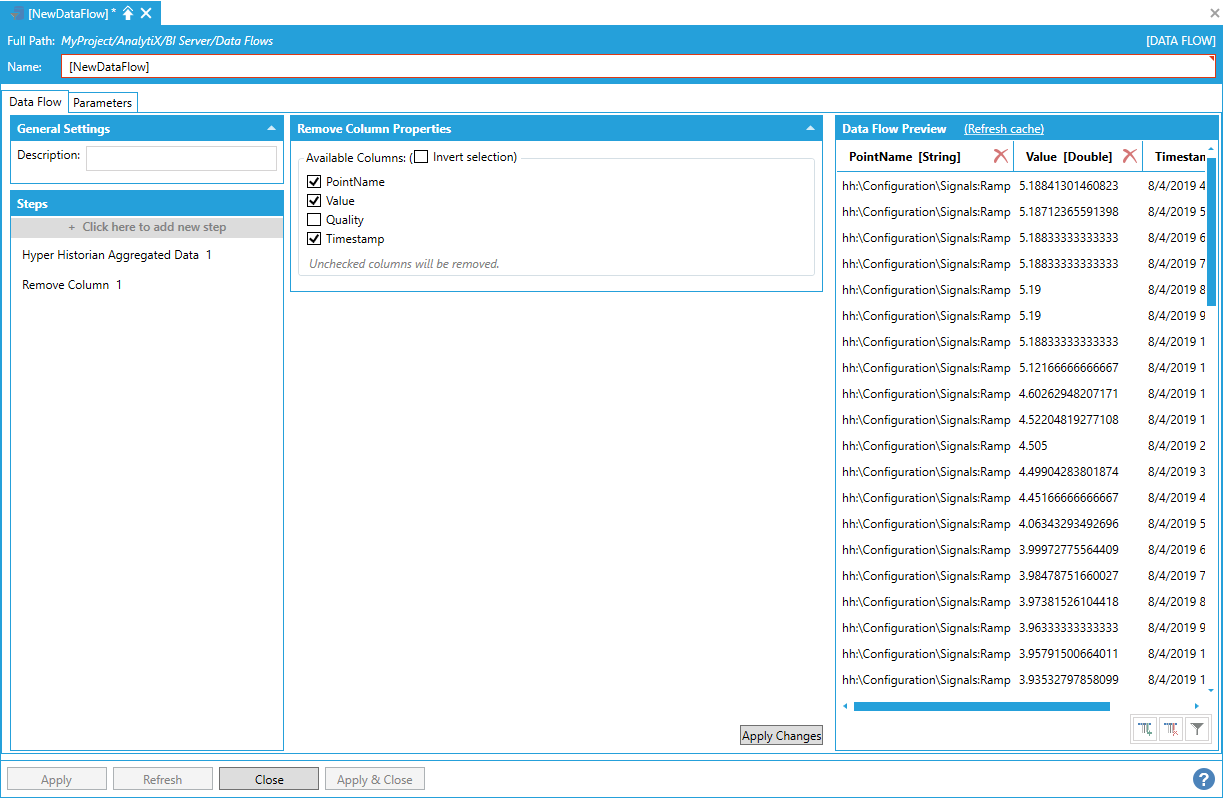
Alternatively, it is also possible to remove columns one by one by selecting Delete on the header of the column to remove in the Data Flow Preview panel. The Steps panel will then automatically update to reflect the change.
There is no limit to the number of Remove Column steps that can be added to a data flow, except when all columns have been removed.
Note: Columns that have been removed cannot be utilized in later steps.
Return to List of Data Sources
This step is extremely useful when it is necessary to change the data type of a column in the output dataset, for example to change a string value to integer or vice-versa.
By itself, the Change Column Type step cannot produce any data, so it must be added after a data source step. In the example below, we added a Hyper Historian Aggregated Data step that calculates the interpolated value of some historical tags at 1-hour intervals.
Adding a Hyper Historian Aggregated Data Step

Assume we want to change the data type of the Value column from double to integer.
To start, select Click here to add new step then select Change Column Type. You will be presented with the following configuration form.
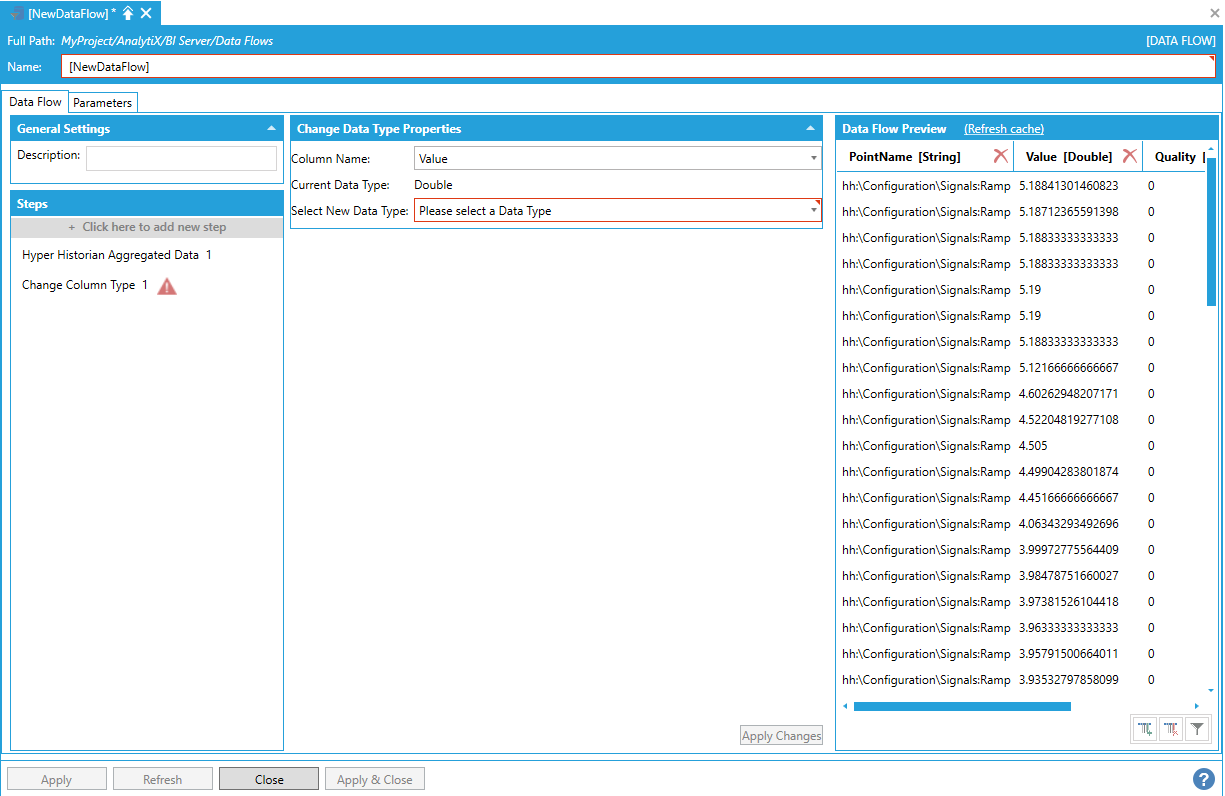
Data Flow Properties

To fully configure this step, it is necessary to select a column name. This is the column in the output dataset whose type we want to change. When selected, it will show the current type of the selected column.
Selecting the Column for Which to Change the Type from the List of Currently Available Columns in the Output Dataset
Next, select the desired destination data type from the Select New Data Type list. Click the Apply Changes button and the Data Flow Preview panel will update to reflect the changes.
Selecting the Desired Destination Data Type
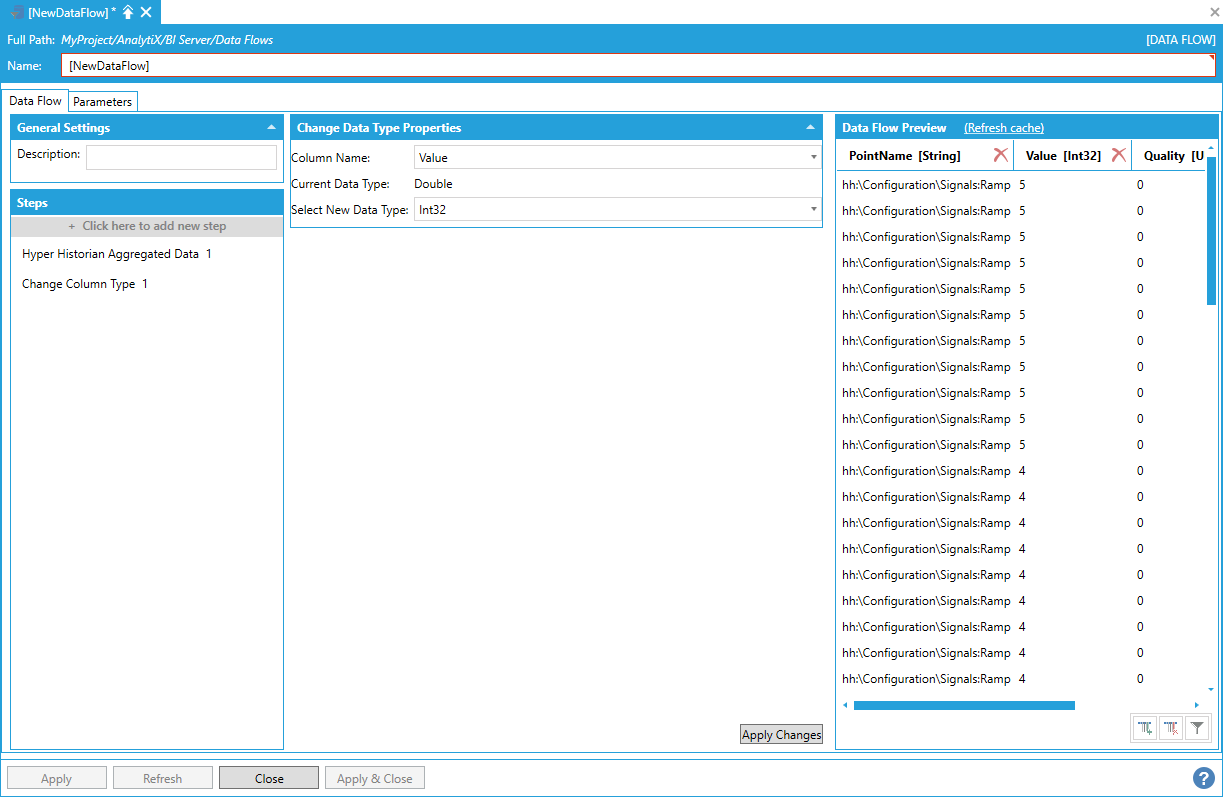
There is no limit to the number of Change Column Type steps that can be added to a Data Flow.
Return to List of Data Sources
This step is used to split a column (usually of type string) into multiple columns based on the configured criteria.
By itself, the Split Column step cannot produce any data, so it must be added after a data source step. In the example below, we added a Hyper Historian Aggregated Data step that calculates the interpolated value of some historical tags at 1-hour intervals.
Adding a Hyper Historian Aggregated Data Step

Assume that we want to extract the signal name from the PointName column.
To start, select + Click here to add new step, then select Split Column. You will be presented with the following configuration form.
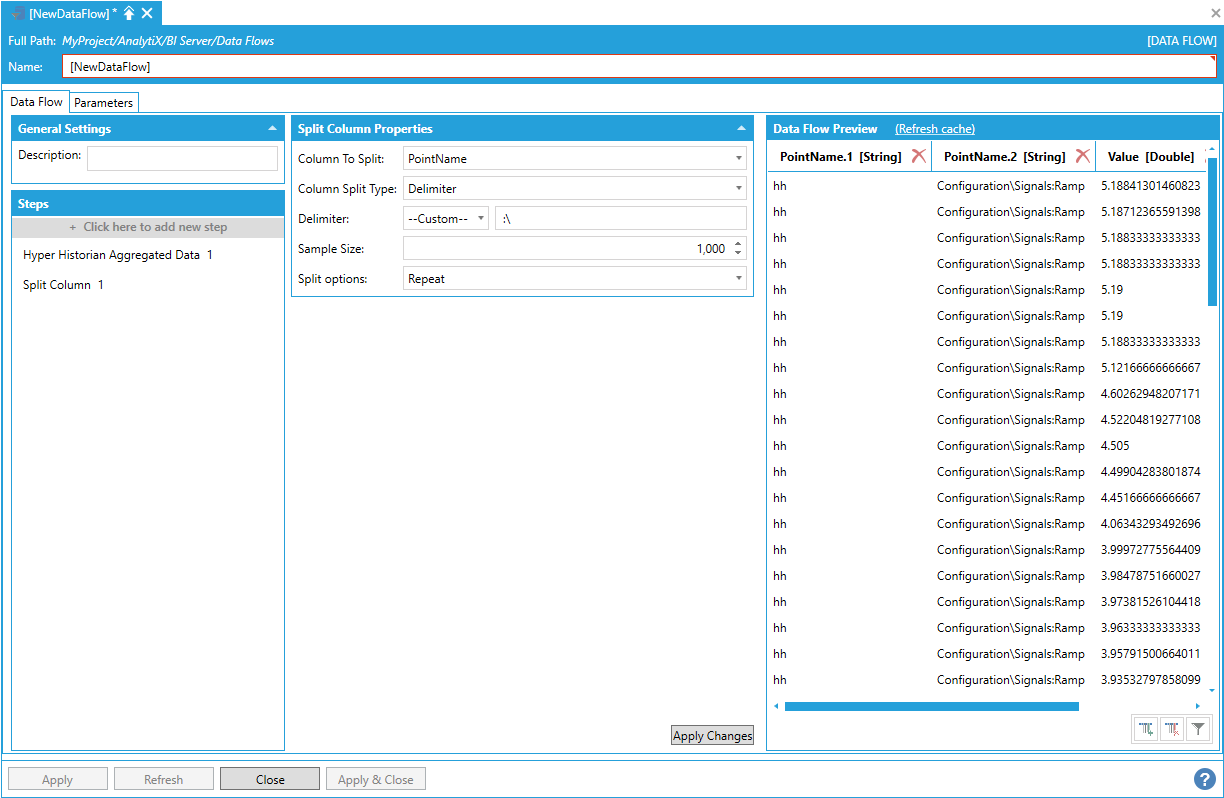
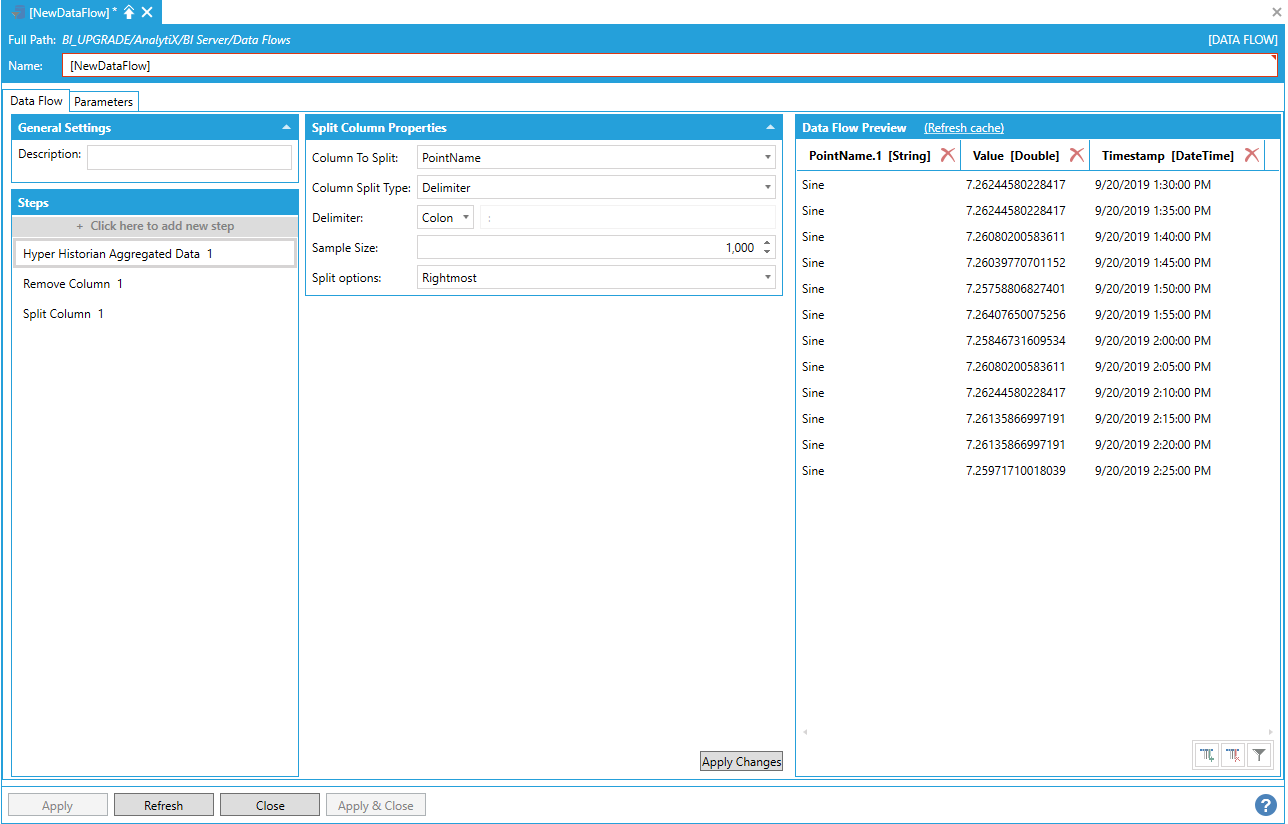
Data Flow Properties

To fully configure this step, it is necessary to select the column to split from the list of currently available columns in the output dataset. Once the column has been selected and the other settings configured, click on the Apply Changes button and the Data Flow Preview panel will update to reflect the changes.
PointName column has been split on the colon character

When Column Split Type is set to delimiter, it is possible to select the delimiter character from a list of predefined characters or provide a custom delimiter:
Split Column Delimiter Selection

When Custom is selected, the custom delimiter can be entered in the dedicated textbox. The delimiter is not limited to a single character, but can be a string of multiple characters. For example, we can split the PointName column on the delimiter “:\”
Splitting the PointName Column on a Custom Delimiter
Columns can be split on other criteria than just a delimiter string, and this is configured via the Column Split Type setting:
Selecting the Column Split Type
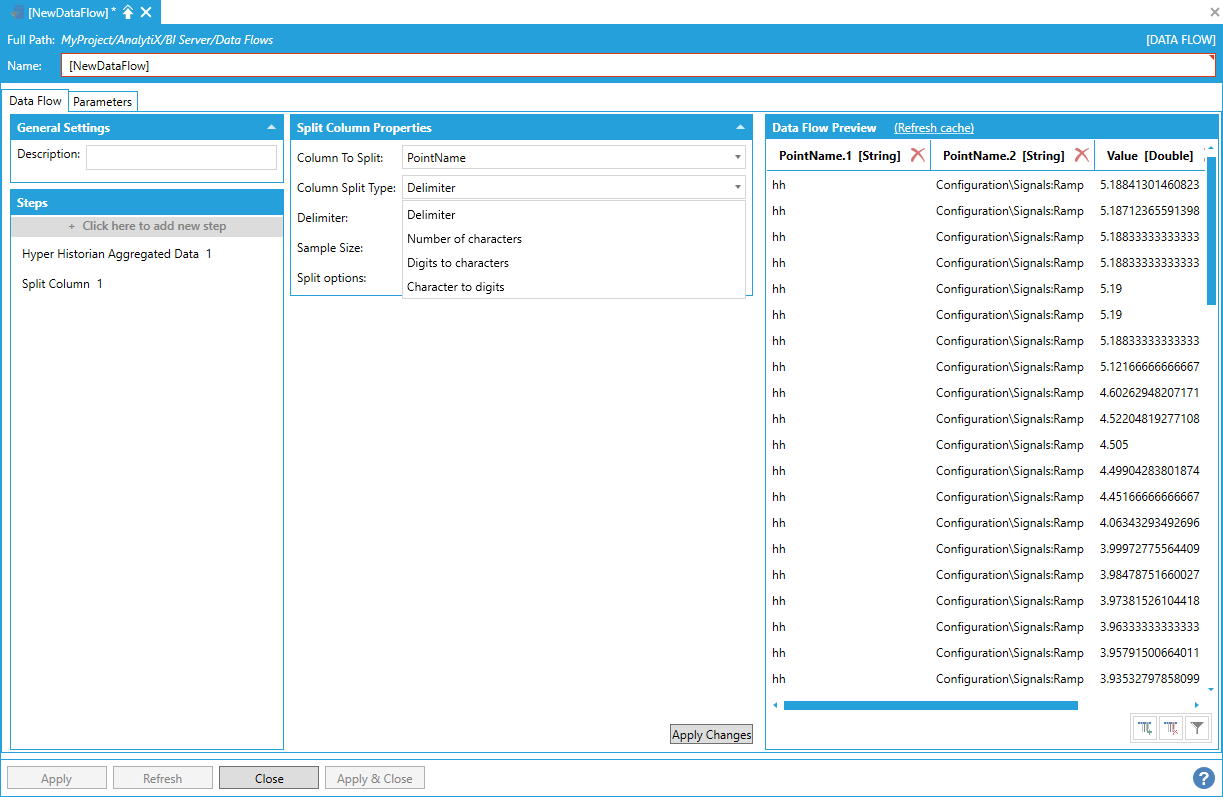
The following list explains the available values:
Delimiter. The column is split on all occurrences of the specified delimiter, either selected from the predefined list of delimiters or a custom delimiter.
Number of characters. The column is split in columns each containing the specified number of characters. The last column contains the remainder characters, if the total number of characters is not a multiple of the configured value.
Digit to characters. The column is split on each occurrence of a change from digit to a character. For example, if the string to split was “01Floor”, the result will be “01” and “Floor”. If the string to split was instead “Floor01” there would be no split.
Characters to digits. The column is split on each occurrence of a change from a character to a digit. For example, if the string to split was “Floor01”, the result will be “Floor” and “01”. If the string to split was instead “01Floor” there would be no split.
The Split Options setting allows to configure which parts of the split column to retain.
Configuring Which Parts of the Split Column to Retain
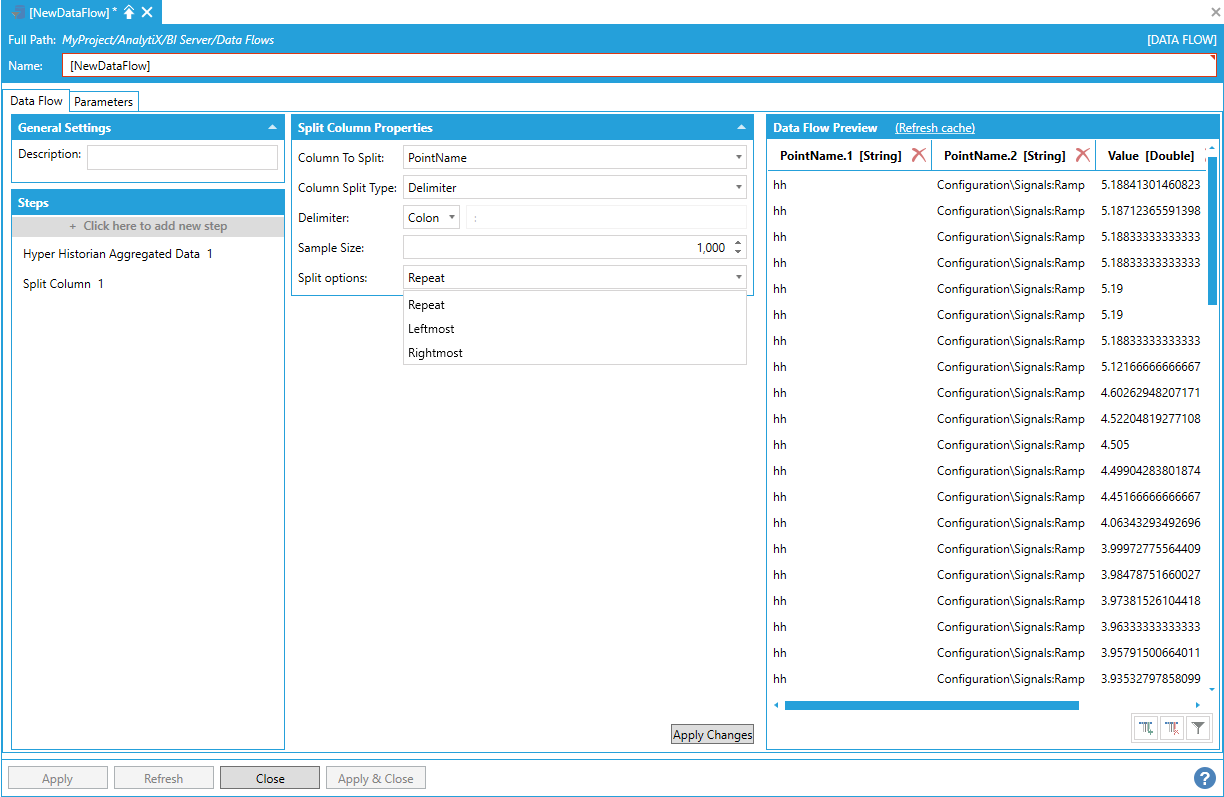
The following list explains the possible options:
Repeat. All the results of the split operation will be in the output schema.
Leftmost. Only the leftmost result of the split operation will be in the output schema.
Rightmost. Only the rightmost result of the split operation will be in the output schema.
In our example, where we wanted to extract the signal name from the point name, we can use the Rightmost split option to only retain the last fragment from the split operation.
Using the Rightmost Split Option

The Sample Size setting specifies how many rows to examine in order to determine into how many columns the source column has to be split into. For example, if the first 1,000 rows all split into 3 columns, but the 1,001st row splits in 4 columns then the 4th column will be ignored and will not appear in the output schema.
Return to List of Data Sources
This step is used in advanced scenarios where it is necessary to “pin” columns of a step and propagate them all the way to the output of the data flow.
By itself, the Pin Column step cannot produce any data, so it must be added after a data source step. In the example below, we added a Historical Tags step that reads a couple of tags configured in Hyper Historian.
Adding a Historical Tags Step
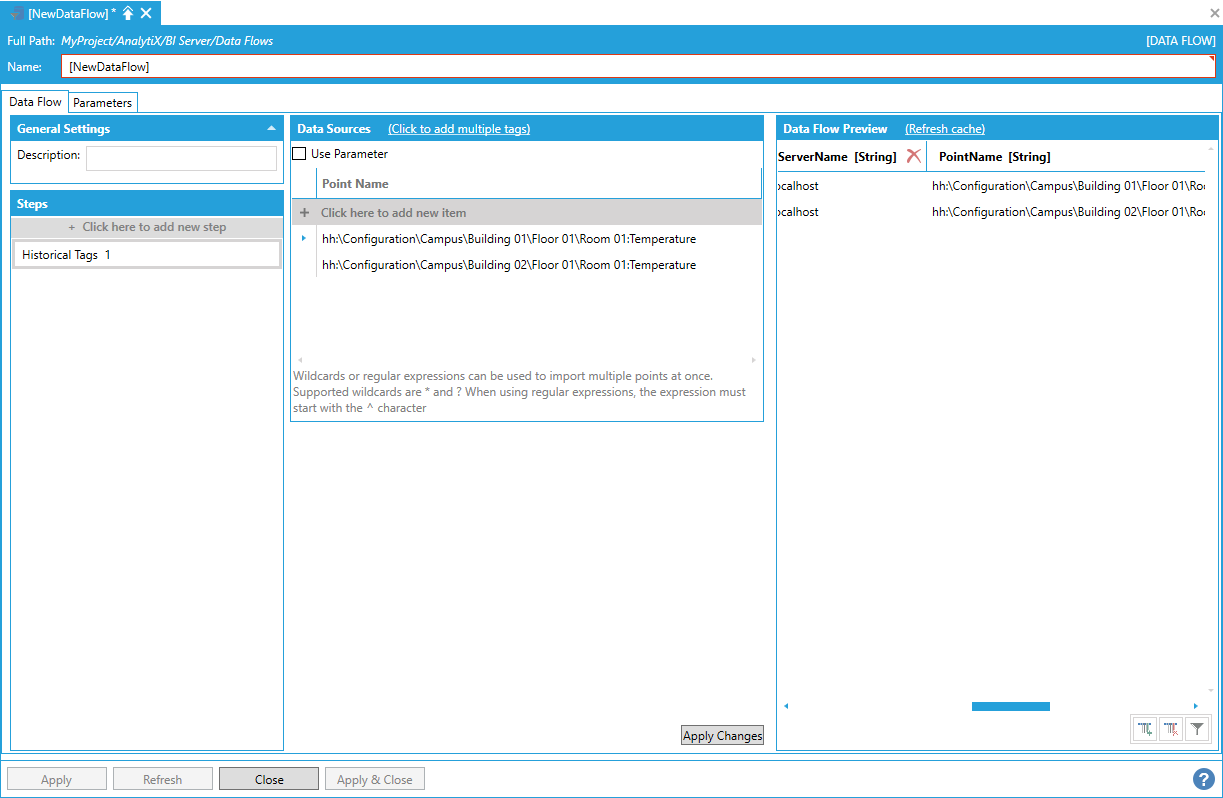
We can now use the contents of the PointName column to perform an aggregated historical read by piping that column to a Hyper Historian Aggregated Data step.
Using the PointName Column to Perform an Historical Read

All the columns that were present in the schema from the Historical Tags steps have been lost at this point though, and replaced by the output schema of the Hyper Historian Aggregated Data step. This can be verified, for example, by adding a Transform Column step.
Adding a Transform Column Step Shows that the Schema has Been Overridden

If we wanted to use other columns from the Historical Tags steps in later steps of the data flow it would not be possible. To solve this problem, we can use the Pin Column step in order to “pin” the desired columns to the data flow’s output so that they will not be overridden with the current step’s schema.
For example, say that we want to propagate the HighRange, LowRange and EngineeringUnits
columns from the Historical Tags step. We can add a Pin Column step and select the
columns that we want to pin:
Pinning the Desired Column to the Data Flow’s Output

The Data Flow Preview will look the same as the previous step however, if we now add a Hyper Historian Aggregated Data step to perform an historical read, the columns that we have pinned will be propagated to the data flow output.
Pinned Columns are Propagated to the Data Flow Output
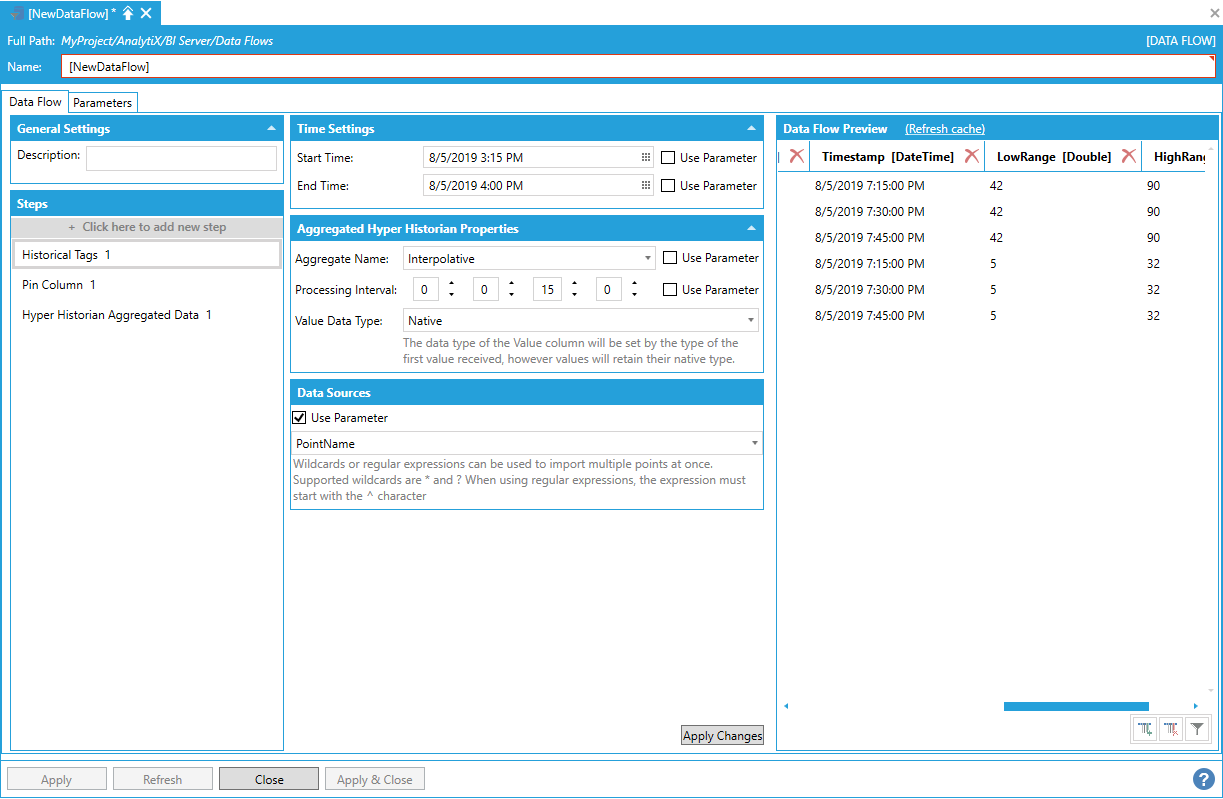
The LowRange, HighRange and Engineering columns are now part of the output together with the result of the historical read.
Note: Pinned columns can also be used in advanced transposing scenarios. Please refer to the Transpose step documentation for more information.
Return to List of Data Sources
This step is used to filter out rows from the output dataset.
By itself, the Filter step cannot produce any data, so it must be added after a data source step. In the example below, we added a Hyper Historian Aggregated Data step that calculates the interpolated value of some historical tags at 1-hour intervals.
Adding a Hyper Historian Aggregated Data Step

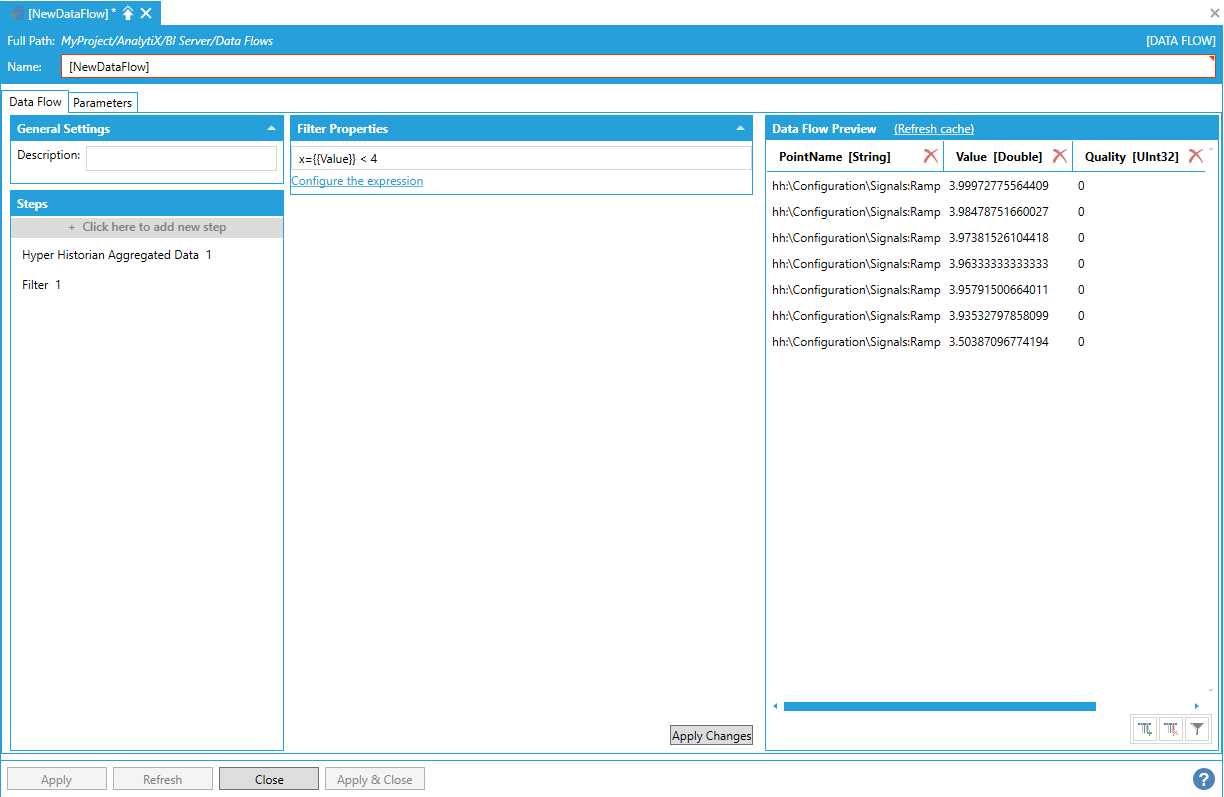
Assume we want to filter out any row that has a Value less than 4.
To start, select Click here to add new step, then select Filter. You will be presented with the following configuration form.
Data Flow Properties

To fully configure this step, it is necessary to define the expression that will be used to filter the rows from the output dataset. The expression can use all the columns in the dataset as variables but must return a Boolean result: if the expression evaluates to true, the row will be included in the output dataset; otherwise it will be discarded.
It is possible to enter the expression manually in the Expression box, or select Configure the expression to launch the expression editor.
Launching the Expression Editor

After selecting OK and clicking on the Apply Changes button, the data flow displays the filtered dataset, including only the rows that satisfy the filtering expression.
Data Flow Displaying the Filtered Dataset
There is no limit to the number of Filter steps that can be added to a data flow.
Return to List of Data Sources
This step is used to transpose the dataset by turning the unique values from one column into multiple columns in the output. Users of Excel or T-SQL may recognize this step as a "pivot" action.
By itself, the Transpose step cannot produce any data, so it must be added after a data source step. In the example below, we added a Hyper Historian Aggregated Data step that calculates the interpolated value of some historical tags at 1-hour intervals.
Adding a Hyper Historian Aggregated Data Step

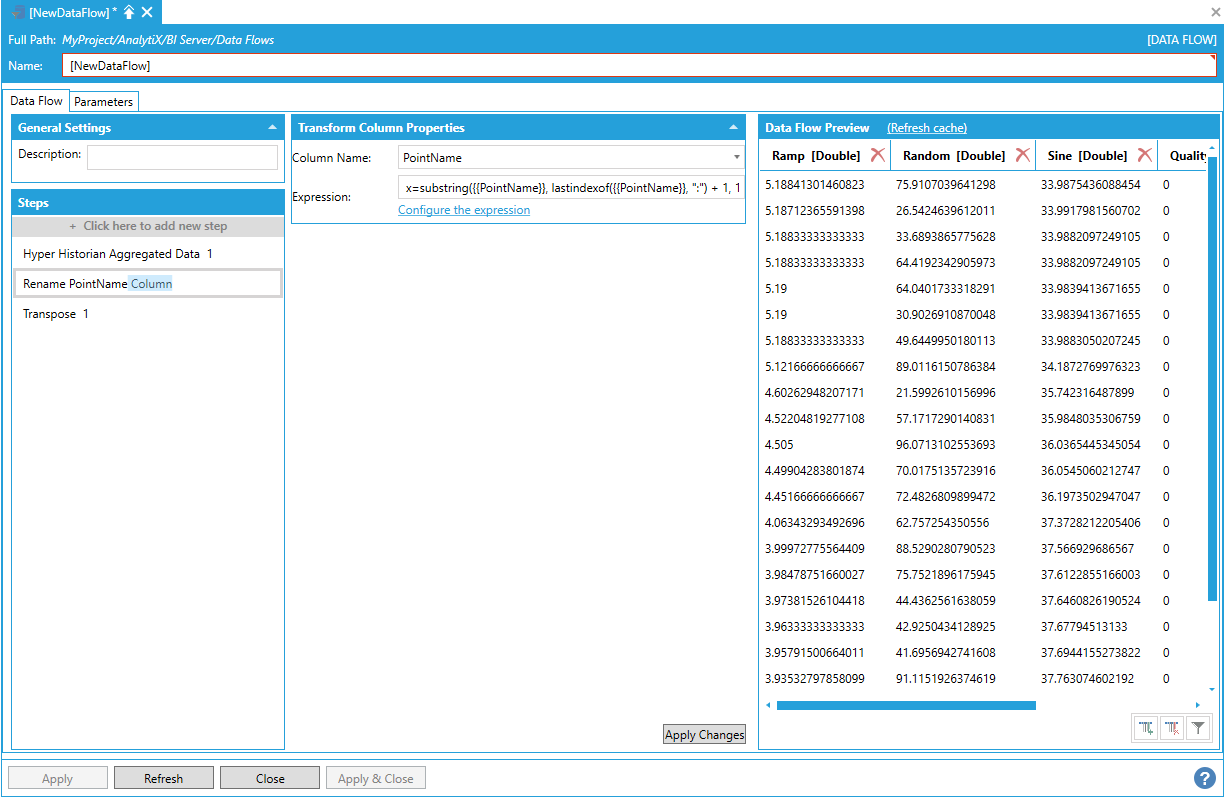
Assume we want to transform this dataset so that the point names are shown in columns, with their associated values lined up by timestamp. To generate nicer column names, we first apply a Transform Column step to strip the hh:\Configuration\Signals: prefix from the Point Name column using a simple string manipulation expression:
substring({{PointName}}, lastindexof({{PointName}}), ":") +1, 100)
Applying a Transform Column Step
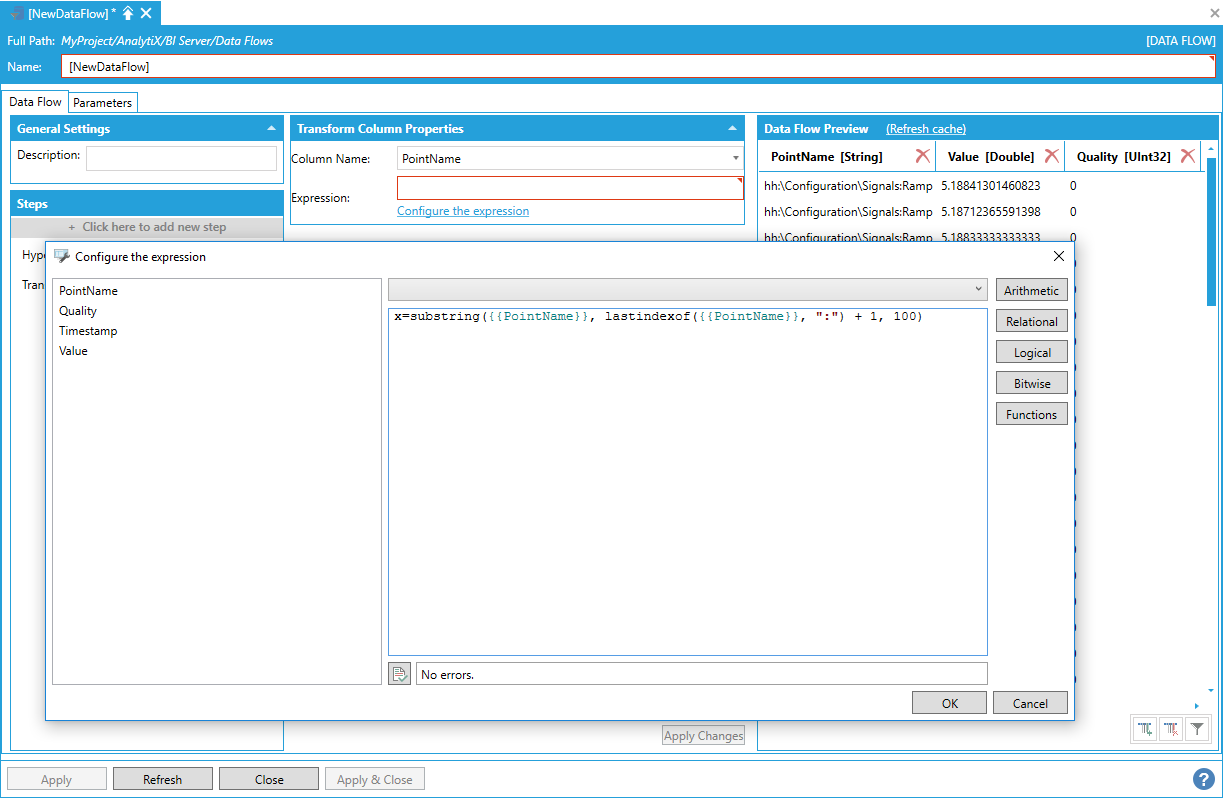
Note: We could also have used a Split Column step, splitting on the colon character and keeping only the rightmost column to obtain the same result.
To start with transposing, select Click here to add new step, then select Transpose. You will be presented with the following configuration form.
Data Flow Properties

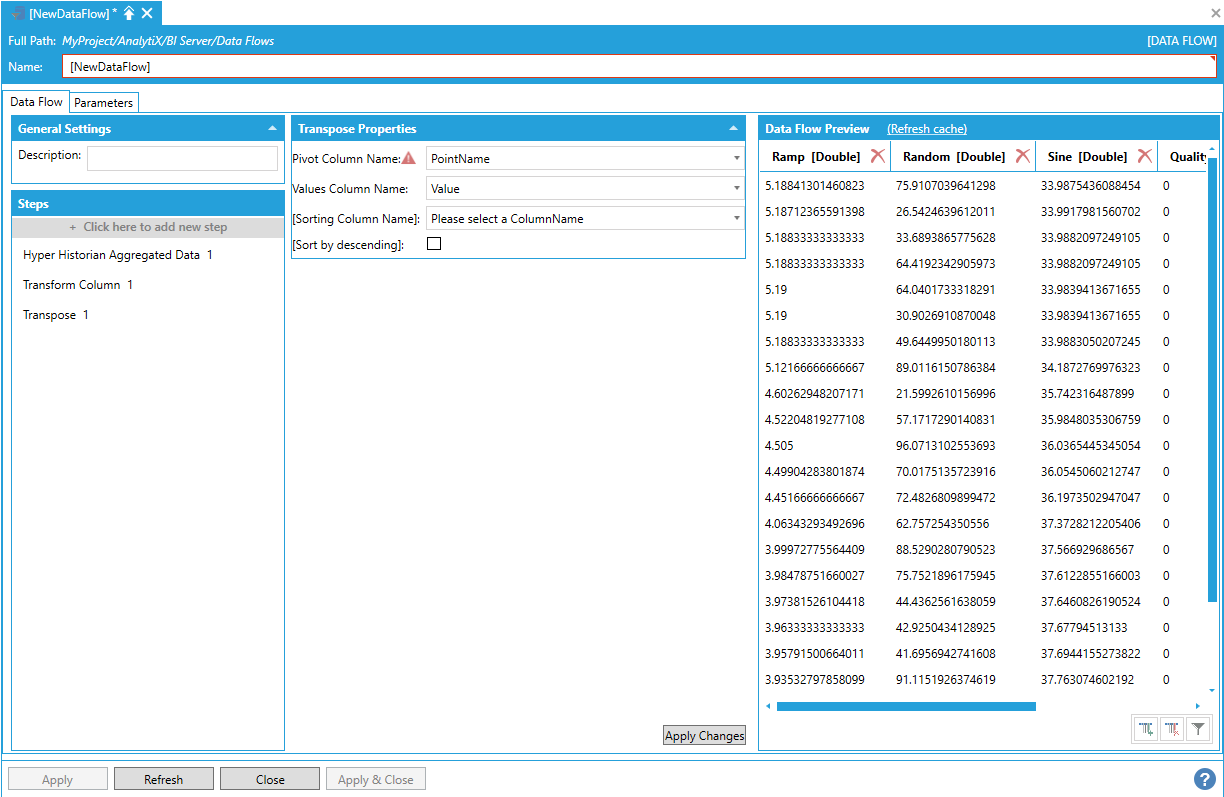
To fully configure this step, it is necessary to define at least the Pivot column and the Values column. The Pivot column is the column containing the unique values that will be turned into new columns in the transposed dataset, and the Value column is the column carrying the values that will be used to fill the newly transposed columns.
In our case, we want to generate new columns based on the unique values of the PointName column and fill them with values coming from the Value column.
Generating New Columns Based on the Unique Values of the PointName Column and Filling Them with Values Coming from the Value Column
Rows are processed and grouped in the same order as they appear in the source dataset. If the original order does not produce a satisfactory row ordering in the output dataset, it is possibly to specify one column to use to sort the data using the Sorting Column Name list. The default sorting order is ascending, but this can be changed to descending by checking the Sort by descending checkbox.
All the remaining columns in the dataset that are not Pivot or Value columns will be used for grouping and aligning the rows in the transposed dataset: this means that for each set of rows identified by a unique value of the Pivot column, the remaining columns must produce a unique Tuple for each row, otherwise an error will occur. For example, assuming that the Quality column above is all zeros, the Timestamp for all rows that have “Sine” as PointName must have all distinct values; the same applies to all Timestamps for “Ramp” and “Random” as well.
Note: Since the output schema of the Transpose step is fully dynamic and depends on the unique values found in the Pivot Column, the step has to fully consume the input before it can produce its output. If the input of the Transpose setp is a large dataset, it may cause high memory consumption while the data flow is executed.
The Transpose step can be used in conjunction with the Pin Column step to address some advanced configuration scenario, specifically when the list of transposed columns is known in advance, but there is no data yet in the pivot column to produce the desired result. Assume for example that we want to transpose some historical data, and we now that we are going to have data for three signals: Sine, Random and Ramp, However, when we start the configuration, only data for the Sine signal is available.
Retrieving Historical Data for the Sine Signal
To prepare the data for transposing, we remove the Quality column and we split the PointName column so that only the signal name is show.
Removing the Quality Column and Splitting the PointName Column
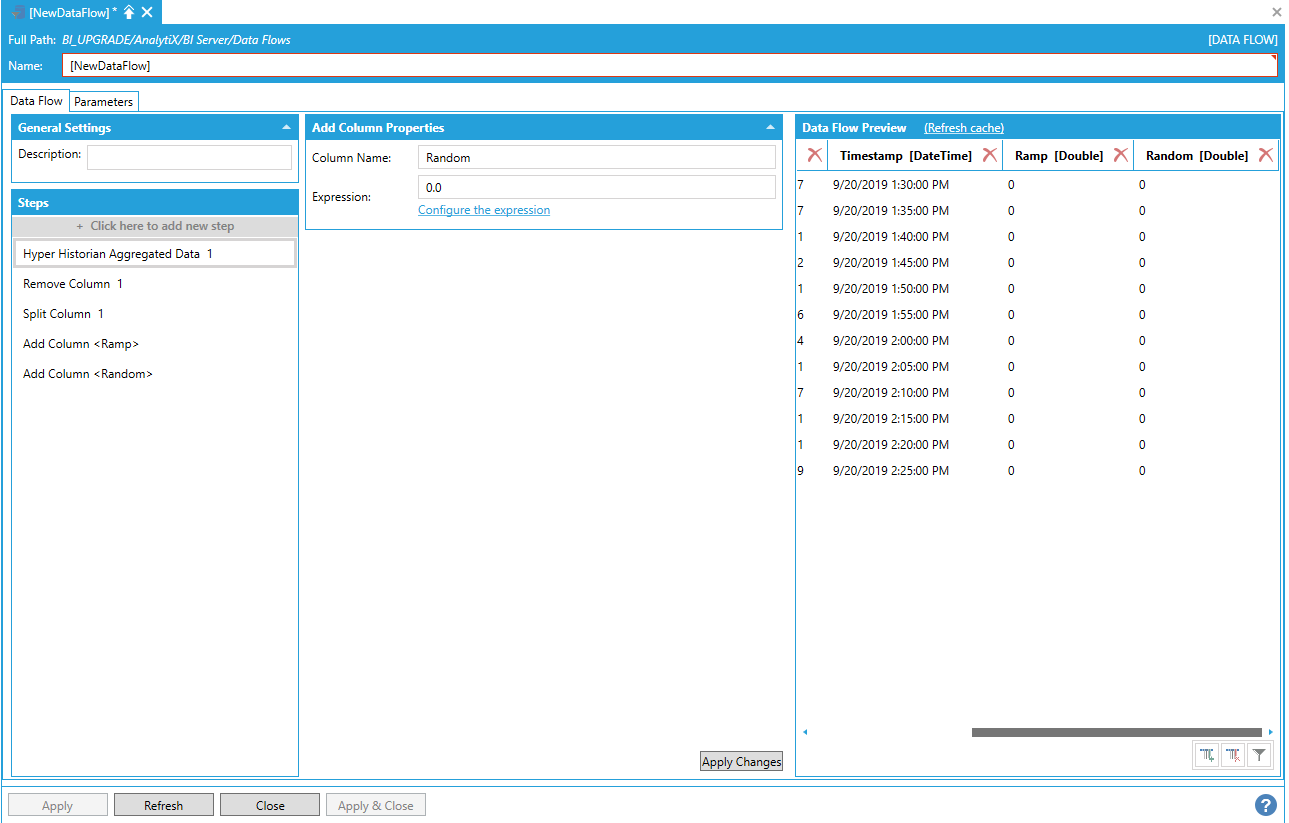
Since we know that eventually we will also have data for the Ramp and Random signal, we go ahead and add those columns to the dataflow using the Add Column step with a default value of 0.0.
Adding the Ramp and Random Columns to the Dataflow
If we were to transpose the dataset now and use the PointName.1 column as the pivot column, the two new columns that we added will be used for grouping and aligning the rows in the output – which is not what we want, because when the historical data will contain values for the Ramp and Random signals the newly transposed columns will clash with the existing columns in the dataset.
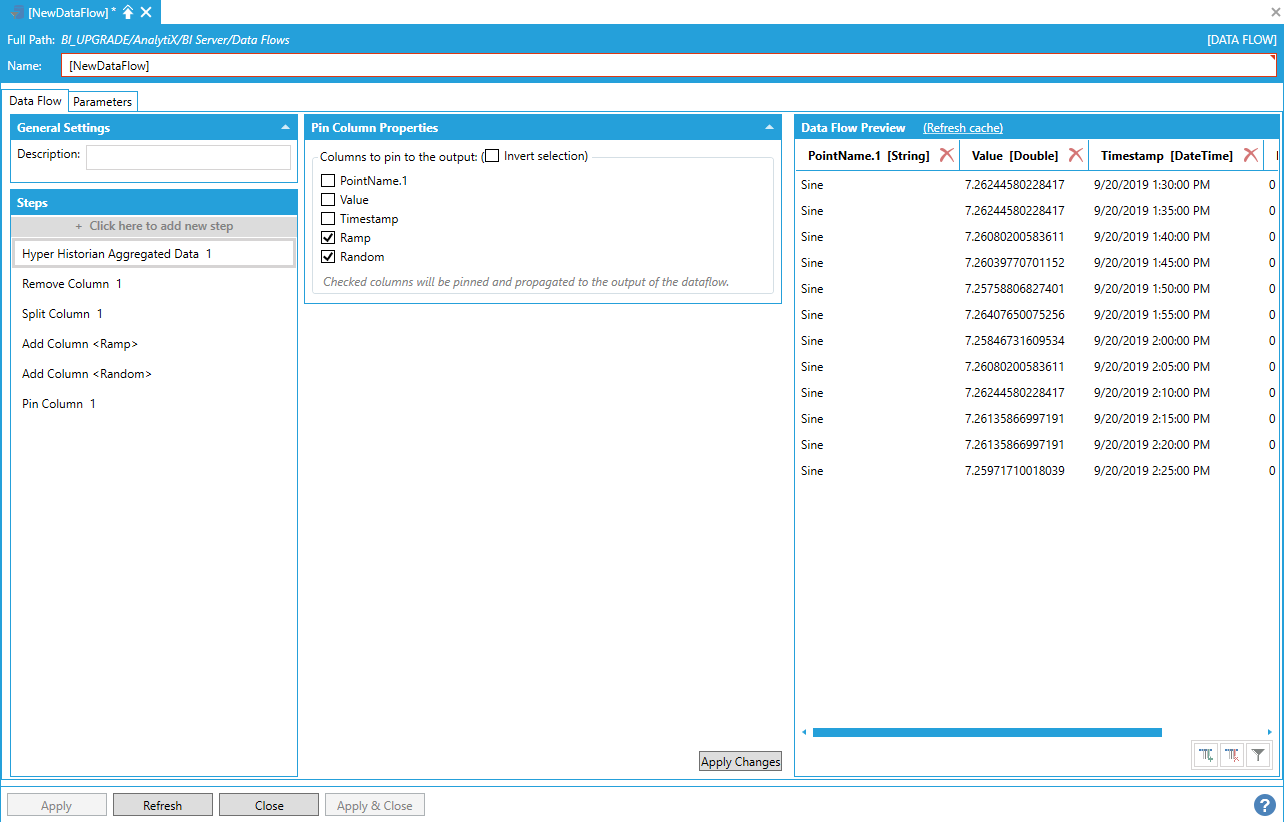
To solve this issue, we add a Pin Column step and we pin the Random and Ramp columns to the output.
Pinning the Ramp and Random Columns to the Output
At this point we can add the transpose step and pick the PointName.1 column as our pivot column.
Adding the Transpose Step
![]()
The Ramp and Random columns are now part of the output, but the dataflow recognizes them as transposed columns. When these names are present in the PointName.1 column, the dataflow will know to merge these values on the existing columns instead of trying to replace them.
If we go back to the Hyper Historian Aggregated Data step and add the two signals to the list of tags, we will now see their values properly transposed in the output dataset.
Adding the Ramp and Random Signals to the Dataset

Note: Pinned columns that are used as destination columns before a transpose step will not be set as pinned to the output after the transpose step.
Return to List of Data Sources
When configuring a data flow, steps can also be renamed or deleted. To rename a step, simply click on the step name under the Steps panel and a textbox will appear to modify the step name.
Renaming a Step
Note: Renaming a step has no effect on the Data Flow itself, and it is only used for UI purposes.
Data Flow steps can be deleted by hovering on a step and then selecting the Delete button that is shown.
Deleting a Step

When deleting a step, the data flow must also delete all the subsequent steps, since each step is dependent on the previous step. A confirmation dialog will appear to ensure that you are aware that the subsequent steps will be deleted.
Confirmation Dialog for Step Deletion

Note: It is currently not possible to reorder data flow steps.
Return to List of Data Sources
A few data flow steps can import data (either historical or real-time) for multiple tags at the same time and merge everything in one dataset. These steps are:
Hyper Historian Raw Data
Hyper Historian Aggregated Data
Real-time
Asset Property Values
It has been mentioned in the sections dedicated to the steps above that, when importing data for multiple tags, it is necessary to be aware of the data types of all the tags involved. AnalytiX BI data flows must report a specific data type for each column produced by the data flow so, if data flow is reading two or more tags of different types, it poses an issue for the runtime.
Let’s create a data flow with a real-time step that reads the following simulated sine tags:
svrsim:sine int32 -100 100
svrsim:sine double med -100 100
The value for the first tag is an integer, and the second is a double. The Data Flow Preview panel will show the preview of the data.
Data Flow Preview Showing Configured Data
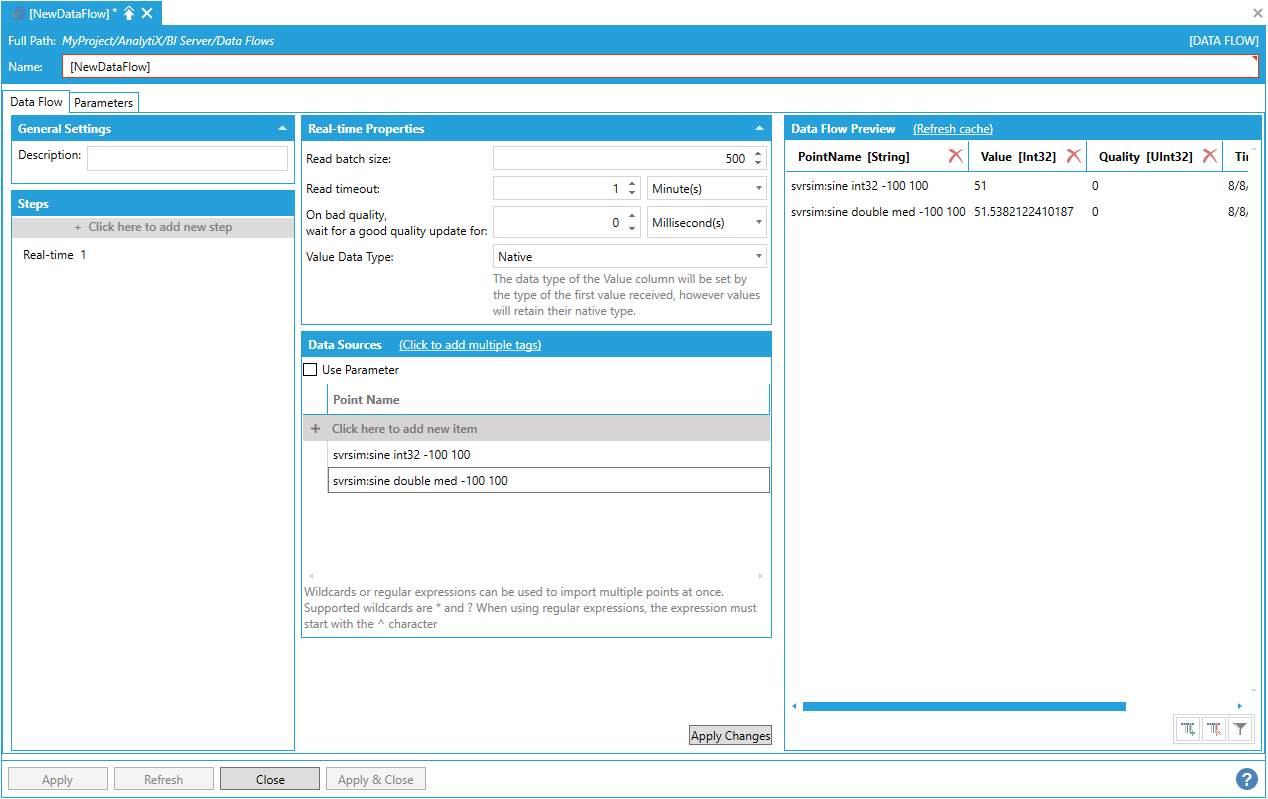
The Value column is reported of type Int32 because AnalytiX-BI data flow will set the data type of the column according to the type of the first value received.
You may notice that the second value is reported in the preview as a double, which seems to violate the column type. The values will actually be returned using their own native type, regardless of the type of the column. Returning a double as part of an Int32 column (or any other incompatible type) will not cause an error by itself, but other modules consuming that column may encounter errors when they find an unexpected type. Most notably, errors may be encountered when using the data flow as the data source for an AnalytiX-BI data model table.
The recommendation for this situation is to use the Value Data Type setting to normalize all the values to the same type before using the data flow in data models or other clients or steps that may be troubled by the mixed data types. When explicitly setting a value other than Native for Value Data Type, the step will try to convert all the values in the Value column to the desired type: if the conversion is not possible (or fails) the value will be set to null and the quality to Bad.
Alternatively, it is possible to add a Change Column Type step to force the conversion of all values to the target data type, however in this case if even one of the values fails to convert the whole data flow will terminate in error.
See Also:
AnalytiX-BI Server SQL Queries