The AnalytiX-BI Server runtime exposes both data flows and data models as datasets for consumption by clients.
Data flows are not cached by the AnalytiX-BI Server, and they are fully executed every time they are requested by a client. This means that any data source referenced by the data flow will be queried every time the data flow is executed.
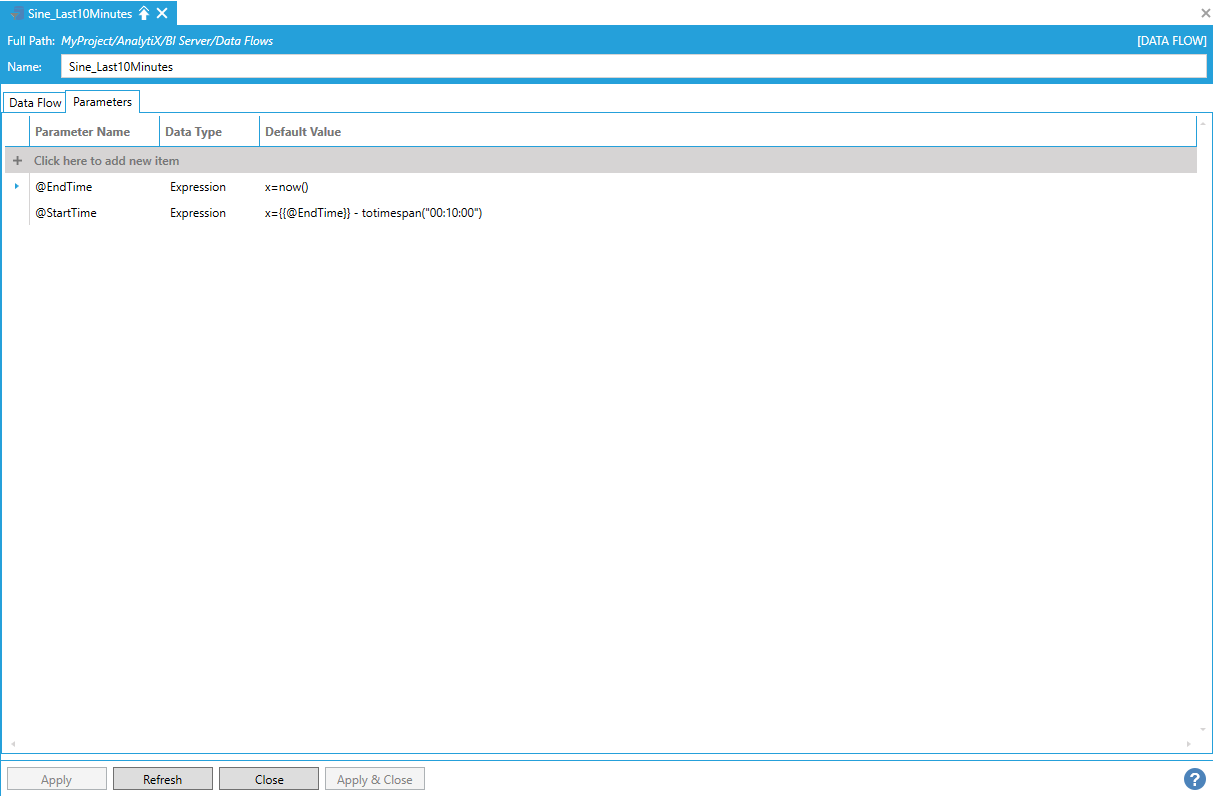
Consider, for example, the following data flow where we are reading raw historical data for the default Sine signal configured in Hyper Historian. The window of the historical read is dynamically configured to the last 10 minutes using data flow parameters.
Parameters Tab in Data Flow Properties
The Data Flow Preview panel shows a preview of the data:
Data Flow Preview

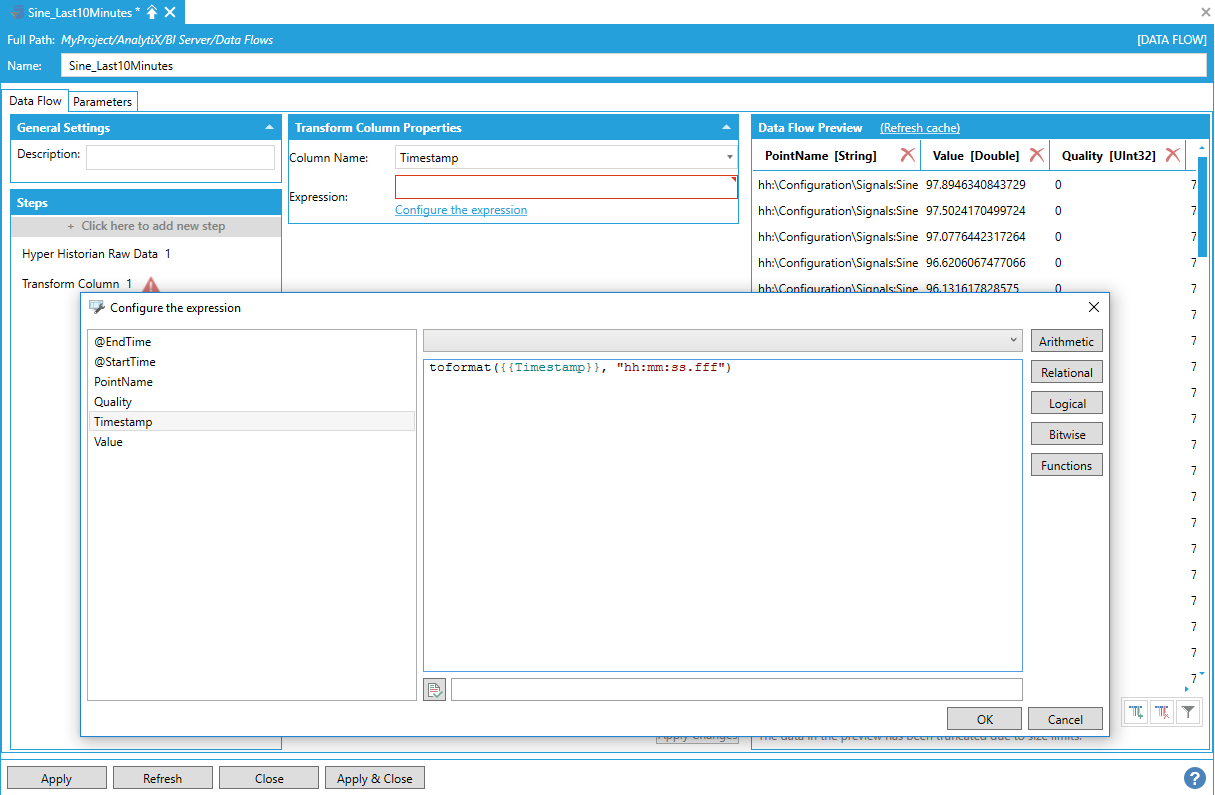
For this example, we are going to transform the Timestamp column to a string that shows just the time part of the timestamp, including seconds and milliseconds.
Transforming a Timestamp Column to a String
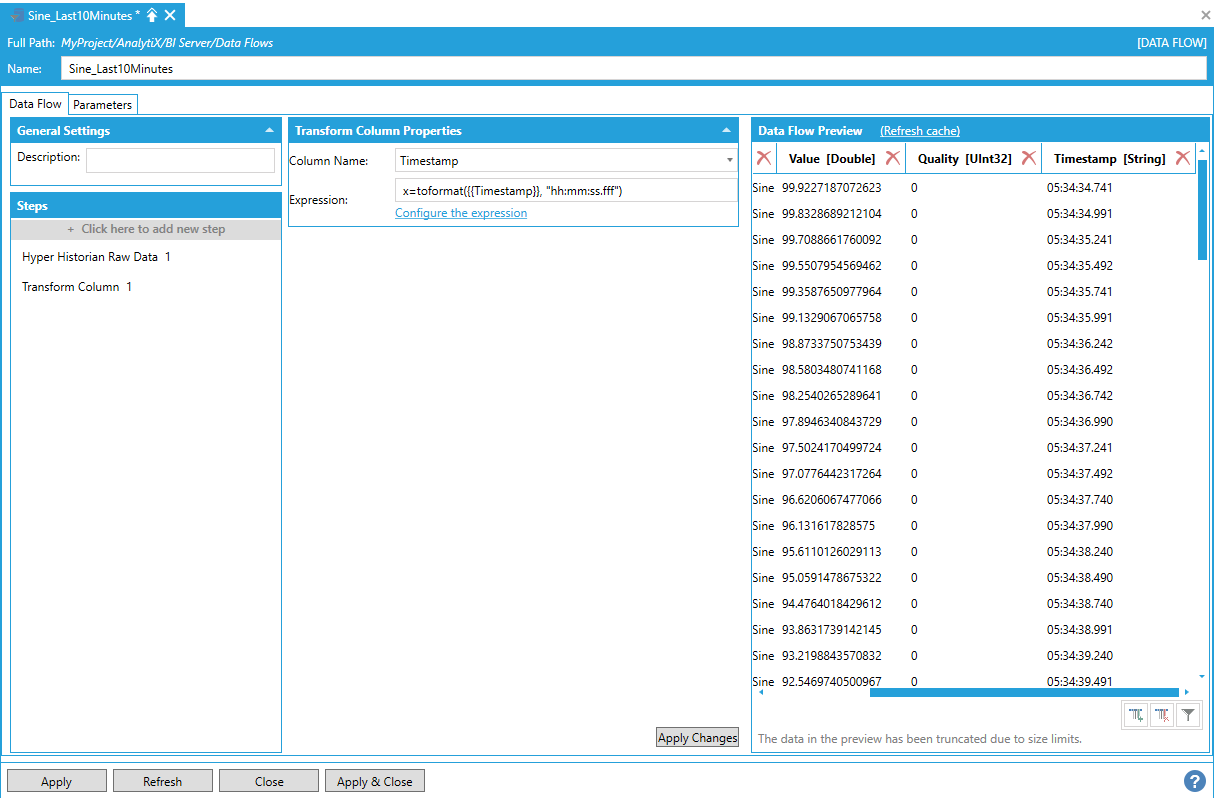
Which gives us the following result in the Data Flow Preview pane.
Result in the Data Flow Preview
In runtime, we can use the GridWorX Viewer to browse and subscribe to the data flow point above:
Using the GridWorX Viewer to Subscribe to the Data Flow

Note: As discussed in the Data Flow Parameters section, parameters of type Expression (in this case, StartTime and EndTime) are not added automatically to the data flow point name.
If we go in runtime the data flow will be requested and executed.
Data Flow Requested and Executed

If we wait a few seconds, exit and then re-enter runtime mode we can see that the timestamps have moved forward.
Updated Timestamps
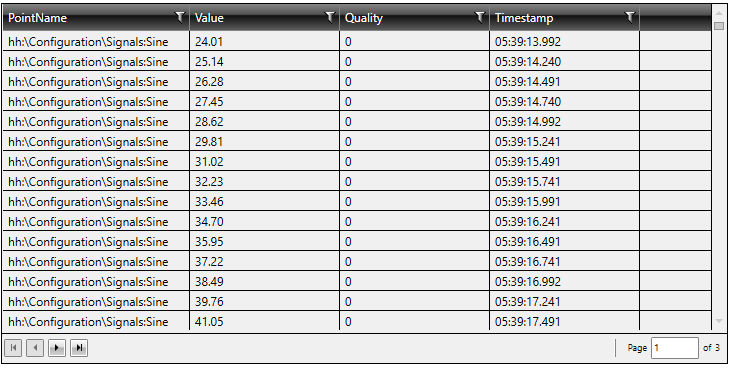
This happens because our time window is sliding forward and demonstrates that data flows are not cached but always executed every time they are requested.
As described in the Data Model and Data Table Configuration sections, AnalytiX-BI Server automatically ingests data for all tables in a data model once the model is configured to be online. The ingested data is compressed and kept as an in-memory database by the AnalytiX-BI Server for the lifetime of the service. All queries submitted to AnalytiX-BI Server are executed against the in-memory database and not against the original data sources where the data was ingested from. This means that if it is necessary to keep data in model tables up to date, refresh triggers for involved table have to be configured as described in the Data Table Configuration section.
If the AnalytiX-BI Server is stopped, all data for all models in the in-memory database will be dropped. When the service is started again, all the data will be re-ingested and compressed again during the startup process.
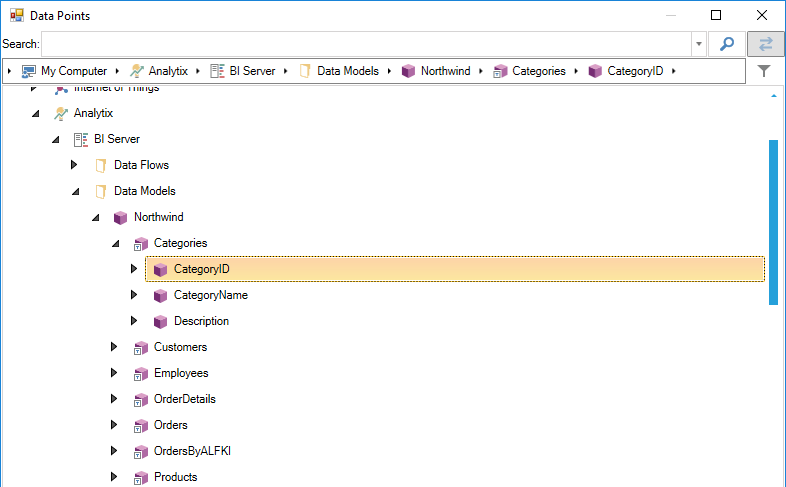
Data tables, data views and individual columns in tables and views are exposed as individual datasets by AnalytiX-BI and can be browsed and consumed by any client that supports datasets.
Exposing Data Tables, Data Views and Individual Columns as Individual Datasets
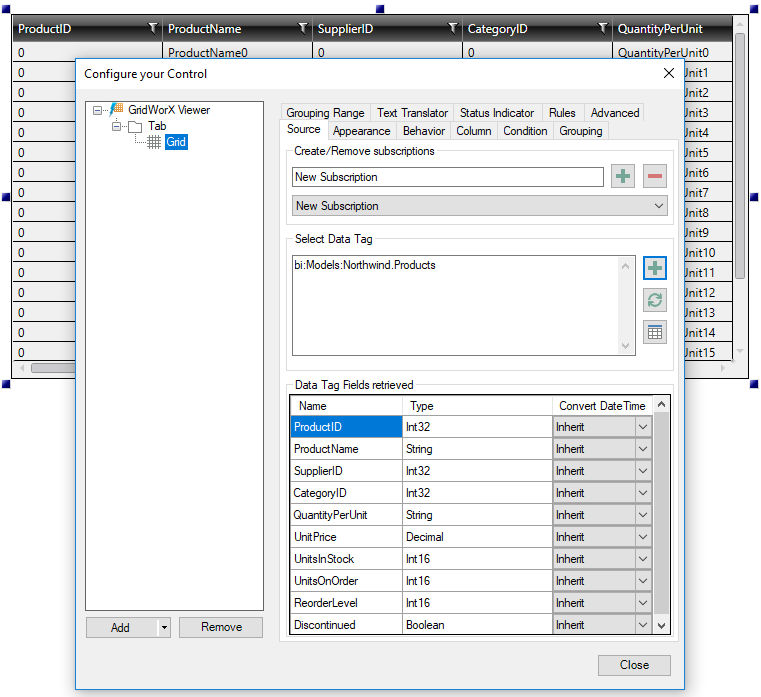
For example, we can subscribe to the Products table in the default Northwind Data Model from a GridWorX Viewer.
Subscribing to the Products Table in the Data Model
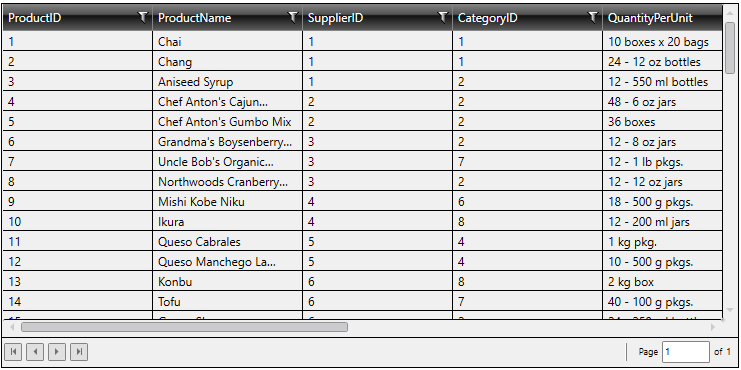
And visualize the data in the table when we go in runtime:
Visualizing the Table Data in GridWorX Viewer Runtime
AnalytiX-BI supports running ad-hoc queries, which can be submitted directly in the point name. Queries are expressed using a familiar SQL syntax, limited to the subset of functionality that is supported by AnalytiX-BI. For more information on how to write a query, see the AnalytiX-BI Server SQL Queries page.
The generic format to submit an ad-hoc query is:
bi:Models[/<ModelPath>]:<DataModel>(Query)
Note: The data browser does not automatically allow browsing of this syntax directly, you must manually add the (Query) component if you wish to use it.
For example, let’s assume that we want to retrieve the ProductName and the UnitPrice from the Products table in the Northwind data model (which is at the root); the resulting point name will be:
bi:Models:Northwind(SELECT Products.ProductName, Products.UnitPrice)
This query produces:

Note: You can also Subscribe to Columns as Arrays.
The AnalytiX-BI Server exposes query results as datasets by default. It is possible, however, to consume individual elements in the result of a query from process points (for example from GraphWorX). The AnalytiX-BI Server allows to append a column and a row indexer at the end of an ad-hoc query in order to bind that element to a single process point. For example, assume that we want to visualize the category name at row 1 for the query:
SELECT Categories.CategoryID, Categories.CategoryName
In GraphWorX we can add a process point and subscribe to:

As described in the ad-hoc queries section, queries are submitted to the AnalytiX-BI Server using the supported point syntax.
Note: Column indexers can be specified either as column names or column indexes.
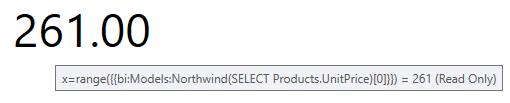
Individual columns in a dataset are exposed as arrays, and can be consumed so from clients like GraphWorX64. For example, assume we want to run the range function (which is not part of the AnalytiX-BI query language) on the UnitPrice column from the Products table. In GraphWorX64, we can create an expression that references the UnitPrice column as an array and applies the range function to it:
Expression Referencing UnitPrice Column as an Array and Applying Range Function

Note: In this case, we are referencing the UnitPrice column from the query by its numeric index rather than name.
The end result is:
Note: if AnalytiX-BI has been upgraded from a previous version, subscribing to dataset column as arrays is disabled by default for backward-compatibility reasons. To enable this feature, add a parameter called EnableArraySubscription of type Boolean and with the value True to the FwxServers.PointManagers.config file.
AnalytiX-BI Server runtime exposes several diagnostic points for Data Table objects:
Exposed Diagnostic Points for Data Table Objects

These points can be used in runtime to obtain information about a Data Table.
@@LastError. If there was an error loading data into the Data Table, this point will return the last error occurred as a string. Note: For security reasons, this point is disabled and not visible by default – to enable it, change the EnableErrorDetailsDiagnosticPoints Point Manager parameter to True and restart the BI Server service.
@@LastUpdated, @@LastUpdatedUTC. These points return the timestamp of when the Data Table was last updated (i.e.: data was loaded into it).
@@TableStatusCode, @@TableStatus. These points return the current status of the table respectively as an integer and as a human-readable string. The possible values are:
0 – Offline. The data model to which the Data Table belongs to is currently offline.
1 – Initialized. The table has been created in memory but is currently empty and waiting to be scheduled for loading.
2 – Loading. AnalytiX-BI Server is currently loading data into the Data Table.
3 – Online. The Data Table has finished loading.
4 – Error. There was an error while loading data into the Data Table. The table might be empty or only contain partial data.
@@Count. Returns the number of rows currently in the Data Table.
@@Refresh. This is a writeable point of type Boolean. Writing True to this point signals the AnalytiX-BI Server to drop all the data in the Data Table and reload the data from the source.
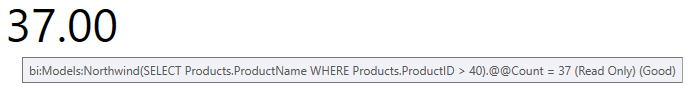
The special @@Count point is also available for ad hoc query points, and returns the number of rows returned by the query:
@@Count Point Ad Hoc Query Point Returning Number of Rows
This allows easy integration with GraphWorX64’s Clone Dynamic.
Note that unlike column/row indexers, the @@Count is also available for table or view points:
bi:Models:Northwind.Categories.@@Count
bi:Models:Northwind(SELECT Categories.CategoryID).@@Count
Also note that the semantics of @@Count are different from a SELECT COUNT(...) query:
@@Count returns the actual # of rows returned by the query itself. For example:
bi:Models:Northwind(SELECT Customers.Region).@@Count
returns 91.
The COUNT aggregate only counts non-null rows, so:
bi:Models:Northwind(SELECT COUNT(Customers.Region))
returns 31.
See Also: