|
|
The features on this page require an add-on to work with GENESIS64 Basic SCADA. |
|
|
The features on this page require an add-on to work with GENESIS64 Basic SCADA. |
ICONICS GridWorX was designed to be able to support generic purpose charts, so now allows integration with SPC Charts.
There are three ways to configure a chart:
Additional considerations for SPC Charts in GridWorX include:
When using the GridWorX64 Viewer control in GraphWorX64, you now have the option of adding an SPC Chart.
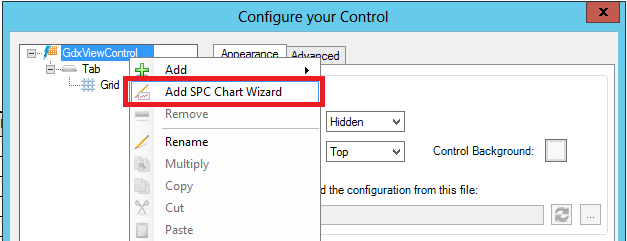
When you open the "Configure your Control" dialog, as shown before, you can right-click on either the root 'GdxViewControl' or the 'Tab' branch and can then click on "Add SPC Chart Wizard". If the wizard is run from the root, a new tab containing the SPC Chart will be created. If not, it is added to the selected tab.
Add SPC Chart Wizard Option
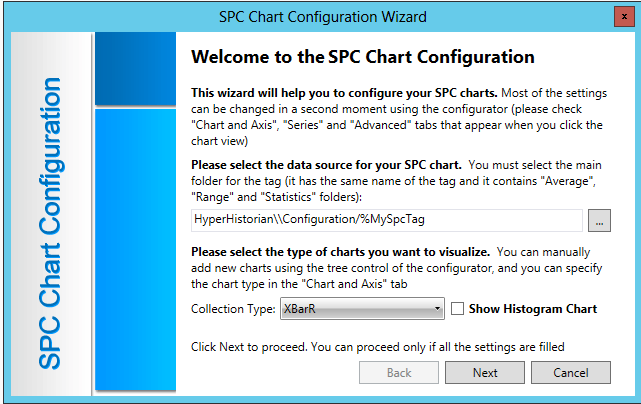
The SPC Chart Configuration Wizard welcome screen, shown below, then appears.
SPC Chart Configuration Wizard Welcome Screen
Note: Before proceeding, it is important to note that the SPC Chart Configuration Wizard will:
Automatically set titles for Average and Range Charts
Automatically set similar properties in all charts
Automatically connect the charts so that one History Overview is used to navigate through them
Also, any of the settings made within the Wizard can be changed using the configurator itself (using the "Chart and Axis", "Series" and "Advanced" tabs).
On this first screen of the SPC Chart Configuration Wizard, you can select the data source for the SPC chart. You can either type within the text entry field or click on the ellipsis button [...] to launch the Data Browser to navigate to your selected tag.
Next, you can select the type of chart you will visualize within the GridWorX viewer (XBarR, XBarS, MedianR, XMR). Note that you can still add charts manually within the tree control of the configurator and specify the chart type via the "Chart and Axis" tab.
You also have the option to show a Histogram Chart.
Once you are satisfied with the settings within this first window, click 'Next'.
The SPC Chart Configuration Wizard will proceed to its second window, as shown below.
SPC Chart Configuration Wizard - Window 2
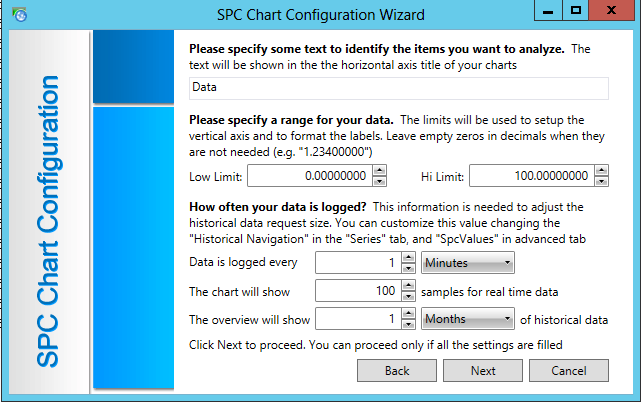
Within this window, you can add a Horizontal Axis Title to your charts in the top text entry field.
Next, you can specify the data range, as both a Low Limit and Hi Limit, which will be used to set up the vertical axis and format the labels.
Next, you can set the frequency of the logged data (how often the data gets logged, how many real time data samples the chart will show, what amount of historical data will be shown in the overview).
Once you are satisfied with the settings within this second window, click 'Next'.
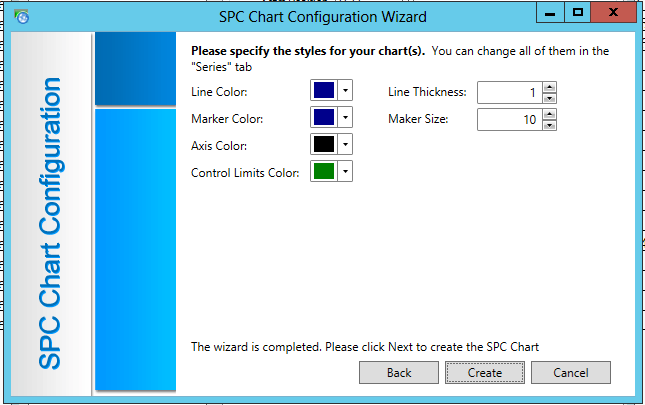
The SPC Chart Configuration Wizard will proceed to its third window, as shown below.
SPC Chart Configuration Wizard - Window 3
Note: If you opted to 'Show Histogram Chart' on the first screen of the wizard, you'll be presented with additional options on thi screen.
Within this window, you can specify the chart styles, including Line Color, Line Thickness, Marker Color, Marker Size, Axis Color and Control Limits Color. Note that these settings can also be changed alter on in the "Series" tab.
Once you are satisfied with the settings within this third window, this marks the completion of the Wizard. You may now click on the 'Create' button, as shown above.
The 'Configure your Control' dialog will now show your added Tab (if you created the SPC Chart at the root level, as shown below) or the added components to your existing tab.
Added Tab Containing SPC Chart Components

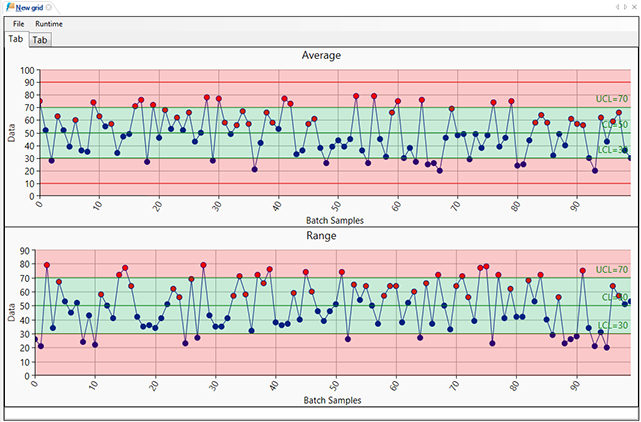
Click on 'Close' to close the dialog, and you'll see the newly created SPC Chart in the GridWorX Viewer, as shown below.
Newly Created SPC Chart in GridWorX Viewer
For those opting not to use the SPC Chart Configuration Wizard, SPC Charts can still be created directly within the GridWorX Viewer configurator (via the Configure your Control dialog).
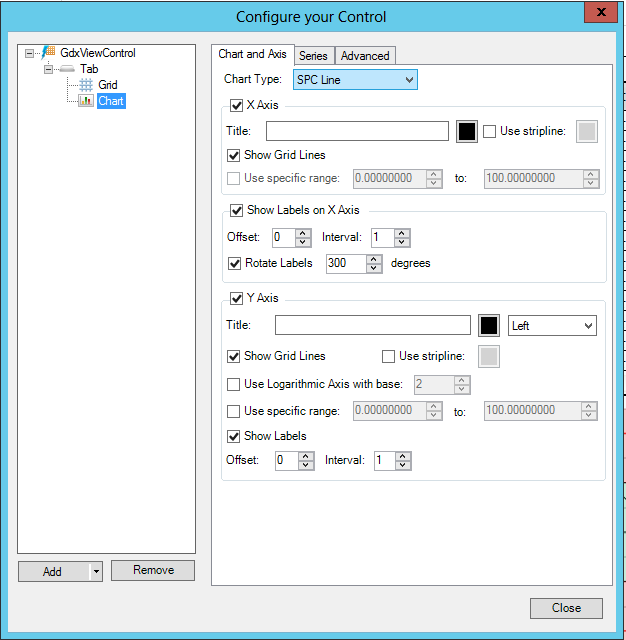
Chart and Axis Tab - Users can add a new Chart, then configure Axis properties (range, grid lines, tickmarks, labels and visibility), as shown below. It's possible to add a new chart and change the Chart Type to 'SPC Line'.
Chart and Axis Tab Properties
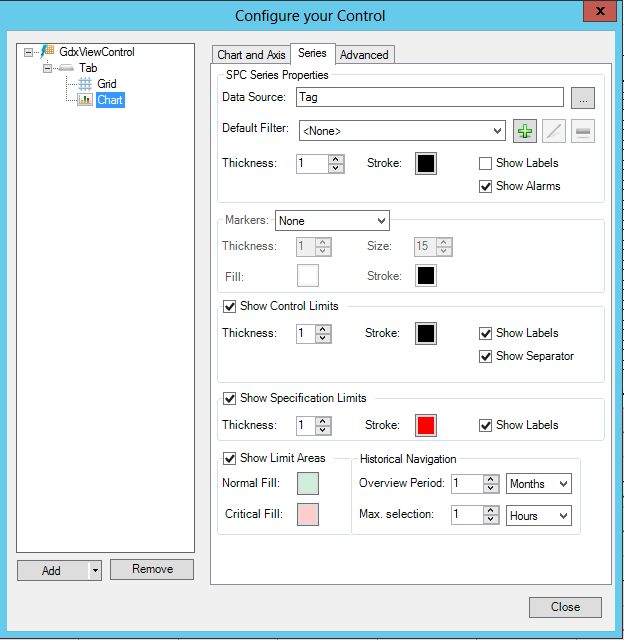
Series Tab - This tab allows you to set your data source, control limits, specification limits, timings, markers, areas and colors, as shown below.
Series Tab Properties
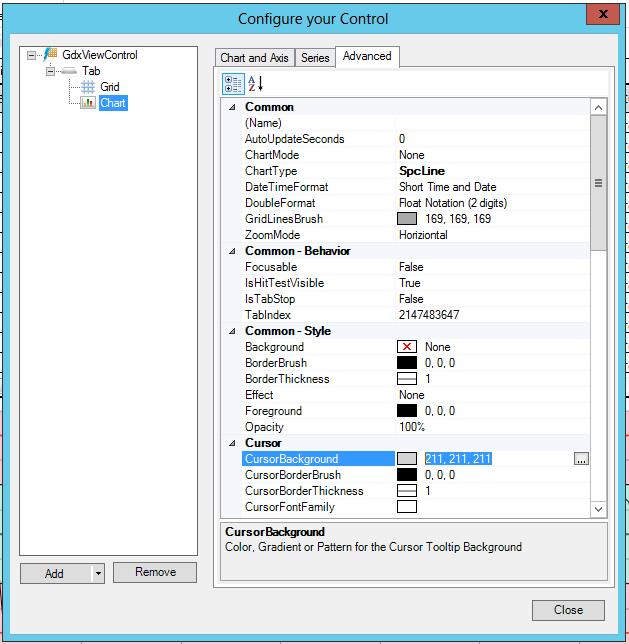
The Property Grid is the Advanced Tab of the GridWorX Viewer Configurator (using the Configure your Control dialog), shown below. It allows users to access more advanced properties (e.g. the Cursor Background). Every color and message can be customized by the user. It is also possible to use placeholders in the cursor to show dynamic data (e.g. timestamps or alarms).
Property Grid (Advanced Tab Properties)
All values come from the server.
Labels, areas and lines can be shown.
When the limits change, a vertical line is shown.
Alarms are visualized using the markers.
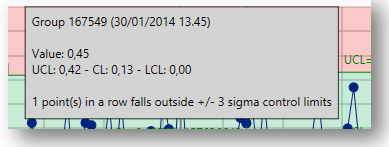
It's possible to see alarm descriptions and notes within the cursor tooltip, as shown below.
Grid Tooltip
GridWorX supports history navigation.
There can be a "Summary View" for each chart or one for all charts.
Example of History Navigation

The Overview is created using Hyper Historian interpolated values, resulting in fast data viewing.
Users can select a range of data in the “Summary View”. (Note: The SPC sample number will change.)
Users can select a specific point in time. (A pre-defined number of SPC samples will be shown.)
See Also:
GridWorX64 Configuration Ribbon