![]()
![]()
In the Workbench, Hyper Alarm Server Alarm Types are located under the Types folder in the root of the Hyper Alarm Server provider's configuration section. To configure alarm sources, at least one alarm type must be configured. To start Type creation, you can create a new type instance by either right-clicking on the Types folder or using the ribbon’s button. A new alarm type form appears, and the “General” page is selected.
To Add a Type
Start the Workbench, then expand your project. Next, expand the Alarms and Notifications node to show the Hyper Alarm Server node. Expand the Hyper Alarm Server node to show the Types node.
Right-click the Types node in the navigation tree and select Add Type, as shown in the figure below.
Add Type from the Project Explorer

-OR-
Select the Types node in the Project Explorer, then click on the Add Type button, shown below, in the Edit section of the Home ribbon in the Workbench.
Add Type Button

This opens the Type properties window, shown below, beneath the Project Details section in the Workbench. Enter a unique name in the Name text entry field.
Type Properties
Name - This name is used as a type identification in the source configuration form.
Note: The next sections follow logical steps, which should be adhered to when creating a new alarm type. Next, select the “Inputs” tab, as shown below.
Inputs Tab
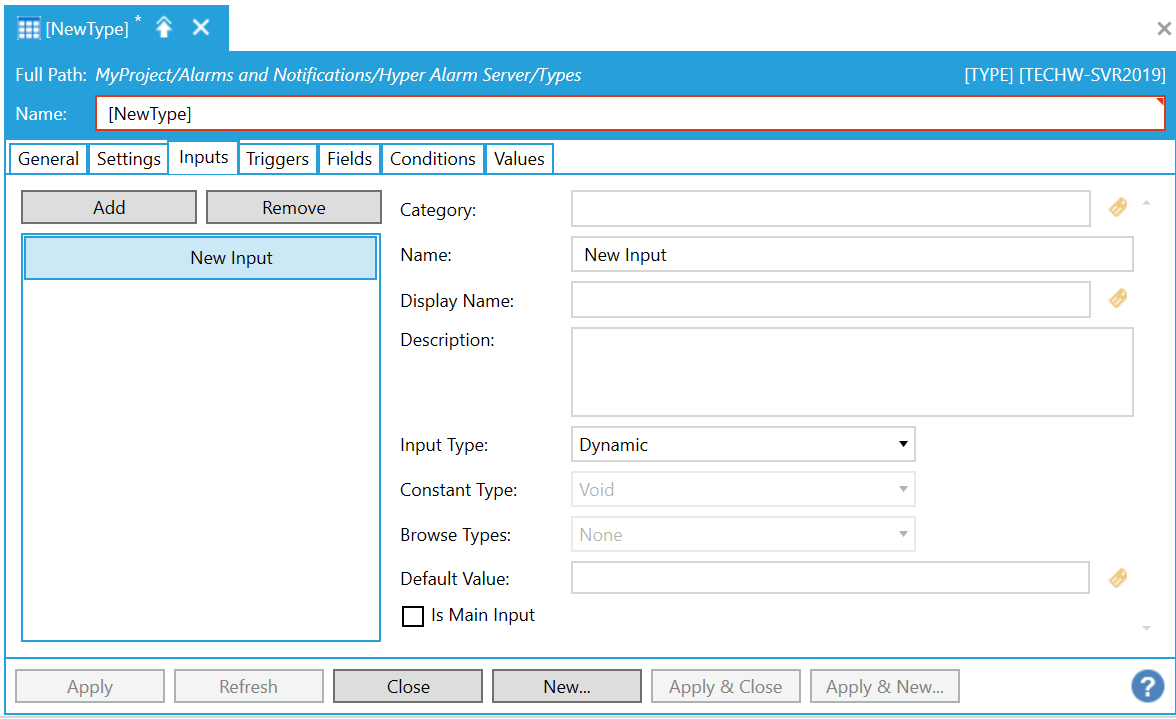
Each input value represents a single configuration value accessible in alarm source configuration form. In other words, alarm source configuration form is autogenerated based on input values properties.
At minimum, one input value should be configured to allow alarm type customization, maximum number of input values is not limited.
Input values should specify source data point(s), limits and other settings, which can be different for different instances of alarm sources related to the same alarm type.
Category - Category identifies the “control group” displayed in the source configuration form. The category name can be essentially any text. However, to allow names localization, some of the names are predefined in the configuration. All predefined names are available in the browser, which can be invoked by clicking on the  button next to the text entry field.
Name - Name is a unique input value identification used inside alarm type configuration. Enter a name in the text entry field.
Display Name - Display Name is a name visible in the source configuration form. Like Category, some of the display names are predefined and can be selected in a related browser. Enter a display name in the text entry field or click on the button to open the Data Browser to navigate to your selected display name.
Input Type - Input Type can be one of the following values:
Constant – Any constant value. This should be selected any time a user does not want to use a data point as an input. Such values have the fastest processing in the alarm runtime. This value is parsed by the expression engine, thus, e.g., value 100+2 can be used and is correctly translated to a number 102.
Dynamic – FrameWorX-based data point – i.e. everything that can be requested as a data point, including real-time expressions. Such points are always requested as data points and these are evaluated in FrameWorX client.
Historical – Data point name, which is not requested as a data point but can be used as a parameter for historical or method calls.
Constant Type – Allows for specification of a data type for constant values. Some of the data types are shown using specific control – e.g. a checkbox for Boolean data types.
Browse Types – Some constant types allow for use of a browser to select specific value (e.g. language alias browser, file browser).
Default Value – Any value that is treated as a default value for the given input. In the Tags configuration form, such values appear in blue color. When this value is overridden, then the color changes to black.
Is Main Input – Applies to AssetWorX integration - When an input is marked as the “Main Input”, then it doesn’t appear in an AssetWorX property configuration page (alarm part) and its value is connected to a related AssetWorX property input data point (real-time or historical).
Triggers Tab
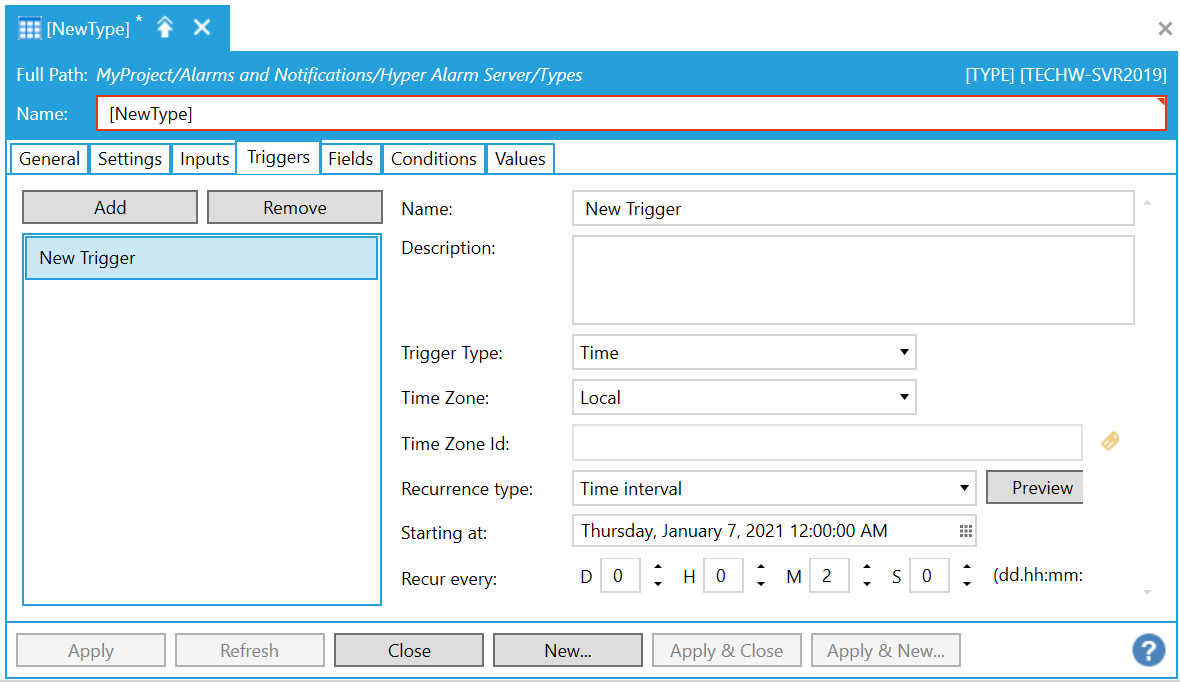
The alarm source evaluation does not happen automatically but is driven by triggers. Thus, at minimum, one trigger must be configured. There is no upper limit for the number of configured triggers. However, it should be kept on some reasonable level since each trigger consumes host computer resources and the set of triggers is usually created for each configured alarm source.
Name - Name of the trigger. Enter a name in the text entry field.
Description - Description of the type input. Enter a description of the trigger in the text entry field.
Trigger Type - The Trigger Type specification. For each type there are specific options. Hyper Alarm Server supports two basic types of triggers: Time and Data Change.
Time - The Time trigger is using a generic GENESIS64 time-based trigger component, including its GUI part. It allows for triggering of evaluations either based on a configured period or at specific times and dates.
When Time Trigger Type is Selected:
Time Zone -Allows you to choose the proper Time Zone Type. For "Specific", you may need to set the string that specifies the timezone. Use the pulldown menu to select from either Local, Utc, or Specific.
Time one Id -Define a Time Zone Id. Available only for a specific Time Zone type. When "Specific" is selected for Time Zone, enter the timezone ID in the text entry field or click on the button to open the Data Browser to navigate to your selected timezone ID.
Recurrence type -Use the pulldown menu to select from One time only, Time interval, or Specific dates and times. Click the Preview button nearby to open the Recurrence preview window to see your set recurrences.
When "One time only" is Selected:
Trigger at - Enter a date and time in the text entry field or click on the Date/Time Picker button ( ), which opens a calendar/time window to set your desired trigger date/time.
When "Time interval" is Selected:
Starting at - Enter a start date and time in the text entry field or click on the Date/Time Picker button (), which opens a calendar/time window to set your desired trigger start date/time.
Recur every - Enter a recurrence by number of Days, Hours, Minutes, and Seconds in each respective text entry field (or use the up/down arrow buttons).
When "Specific dates and time" is Selected:
Starting at - Enter a start date and time in the text entry field or click on the Date/Time Picker button (), which opens a calendar/time window to set your desired trigger start date/time.
Recur every - Enter a recurrence by a number in the first text entry field, then select a unit of time [Sedond[s[, Minute(s), Hour(s), Day(s), Week(s), Month(s), or Year(s)] in the pulldown menu. Depending on the unit of time selected, you can make specific further edits, including the ability to "Pick specific times" and then set those times via text entry or the Multiselection button ( ), which opens the "Multi selection" window.
Data Change - Based on input value, which must be configured as “dynamic”, a Data Change Trigger triggers evaluation every time a new data update is received. Optional value status filters are available. However, these filters don’t guarantee that evaluation won’t be triggered, even when the related data point has Bad or Uncertain quality. The alarm server may send internal trigger events to resynchronize the state after a configuration change or in redundancy during switchover. In general, status code filters may reduce the number of trigger events and reduce resource consumption, but condition expressions must handle such status codes correctly.
When Data Change Trigger Type is Selected:
Input -If data driven trigger is selected, you are allowed to input from the list of inputs.
Ignore Bad Quality - True to ignore bad quality data change trigger input.
Ignore Uncertain Quality - True to ignore data change trigger input.
Fields Tab
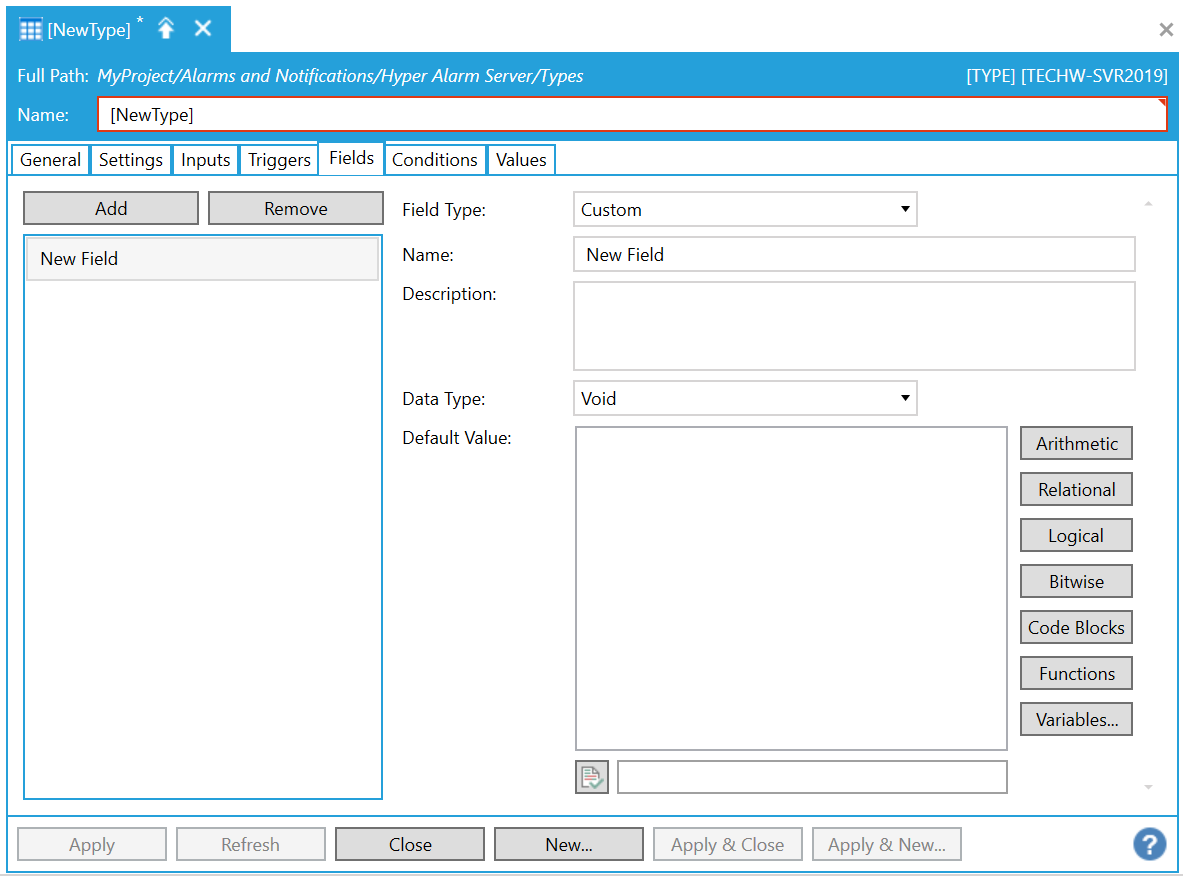
This represents all the values sent to an alarm client with every alarm state change. There are two basic types of field values: Custom and Predefined. Custom fields are identified by name. The only limitation is that it must be unique within the same alarm type. Predefined types have this name fixed and thus cannot be changed.
Field Type – Either custom or one of the predefined types. Selects Field type, default value = custom type. For other types, the name field will be disabled and replaced by empty string when saved to the database. Use the pulldown menu to select your preferred field type.
Name – Valid for custom field types, any text, which must be unique within the same alarm type. Name of the field. Enter a name in the text entry field.
Description – Optional, any text. Description of the type field. Enter a description in the text entry field.
Data Type - Valid for custom field types, specifies data type of field value. Changes Data type of the field. Use the pulldown menu to select your preferred data type.
Default Value – An expression text, either a constant or a combination of Input values. Fallback value for all associated condition field items. This section of the tab functions similarly to ICONICS' Expression Editor.
Conditions Tab
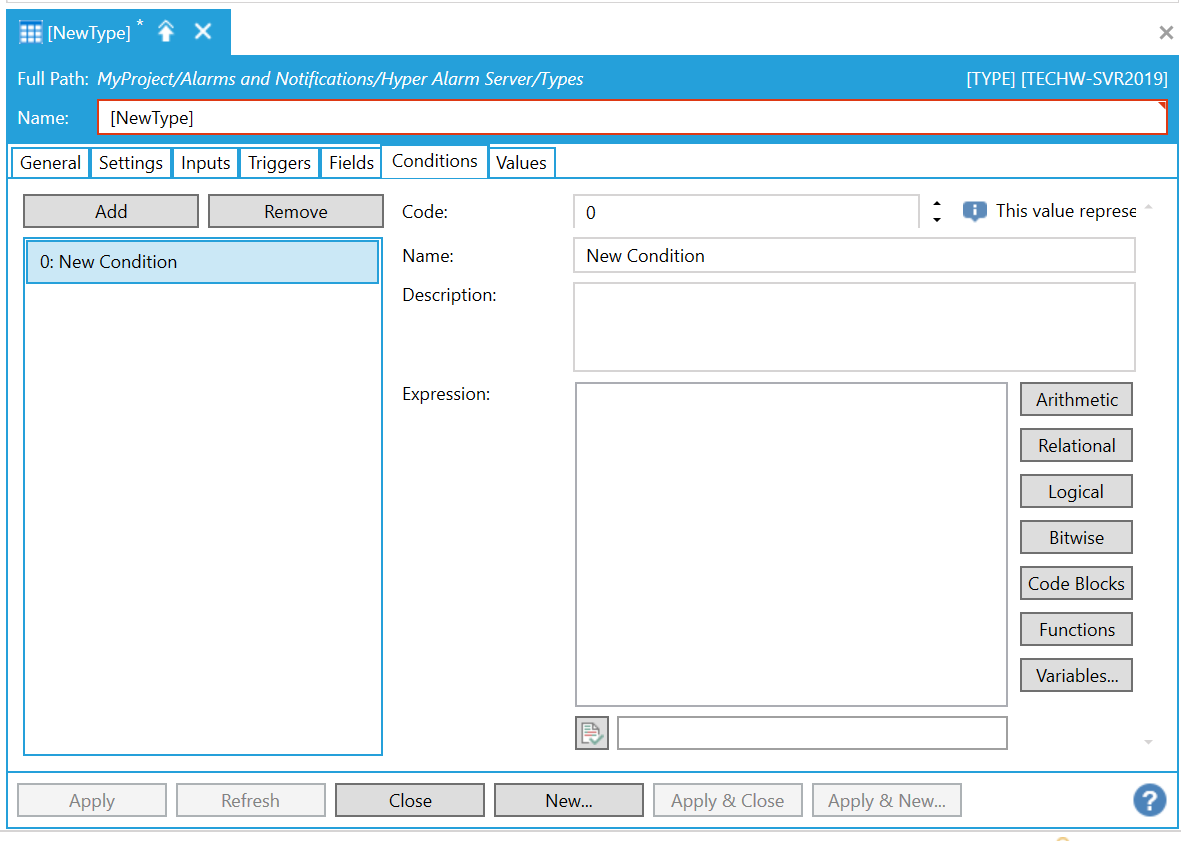
Each condition is identified by an integer number with value between -1000 and 1000. The value of 0 represents “normal condition” while all other values represent alarm conditions. At minimum, two conditions must be configured: one “normal condition” and one “alarm condition”.
Code – Uniquely identifies each condition (within alarm type), when the alarm source should switch to this condition then the condition evaluation expression must return it from evaluation. Representation of the condition. 0 should be dedicated to return to normal. Enter a number in the text entry field or use the up/down arrow buttons.
Name - Name of the condition. Enter a name in the text entry field.
Description – Optional, can be any text to describe condition meaning. Enter a description in the text entry field.
Expression – Optional, when configured then this expression is used as a condition evaluation expression to switch to other conditions. In all other cases, a condition evaluation expression from the General page is used. Expression of the Condition. If left empty, then the required expression of the whole type is used. Enter an expression in the text entry field. This section of the tab functions similarly to ICONICS' Expression Editor.
Values Tab
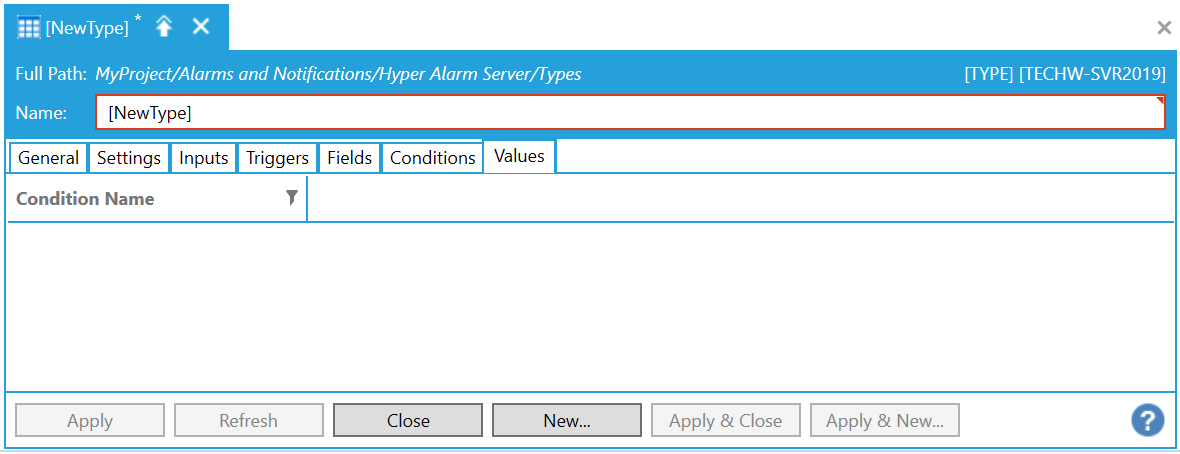
This tab shows the relationships between conditions and fields in a tabular form. Conditions are represented by lines. Fields are columns in this tabular view. Except for condition names, all other columns are editable. Default values, which were defined for each field are shown in blue color. Modified values are black. Every editable value in this table is an expression, which can use inputs to create actual value for the combination of active condition and field. An Expression Editor is also available, via a button that appears when a value is being edited.
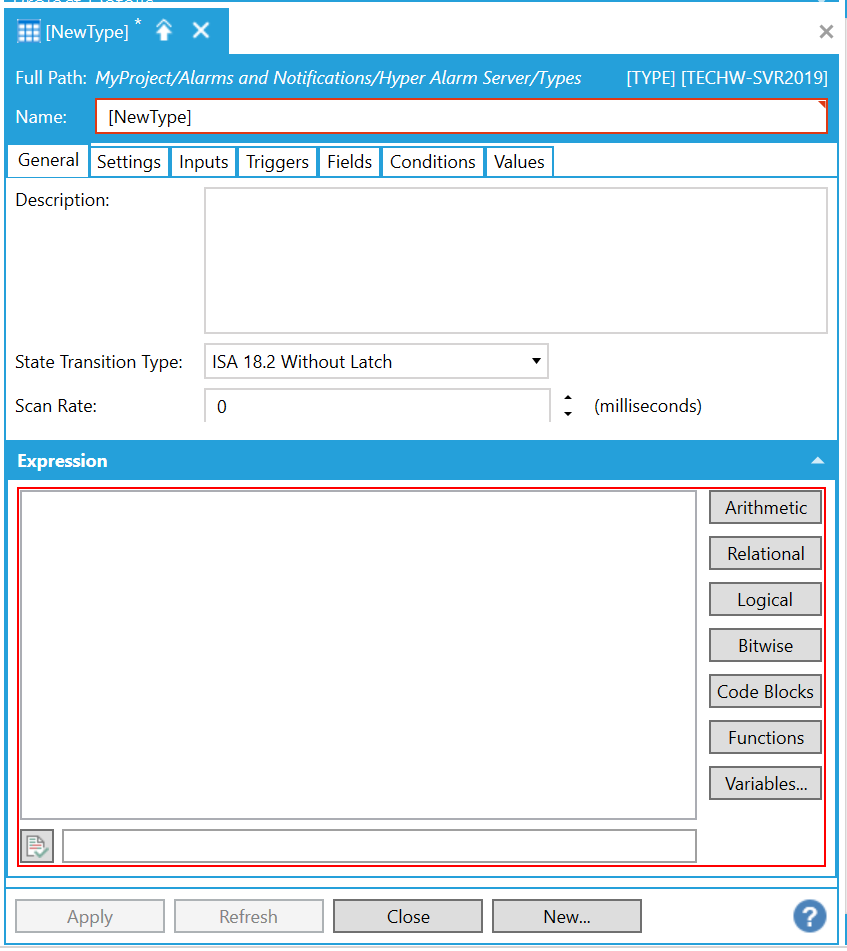
General Tab
Even though this tab is shown on the very first position, it should be configured as the last step in the alarm type configuration procedure. This tab allows users to configure alarm source logic – i.e. based on input values to generate condition value code. It also allows users to select one of the predefined alarm transition type entities.
Description – Optional, any text to describe this alarm type. Description of the type. Enter a description in the text entry field.
State Transition Type - State machine transition implementation defines possible transitions between internal alarm states (Normal, Active, Acknowledged, Shelved, etc.). Some of the internal alarm state can be reduced by state transition implementation. Use the pulldown menu to select from ISA 18.2 Without Latch or ISA 18.2 With Latch.
Hyper Alarm Server supports ISA 18.2 state machine in two modifications: Full, as shown on the next picture, and Without “Latch” State.
Full Modification
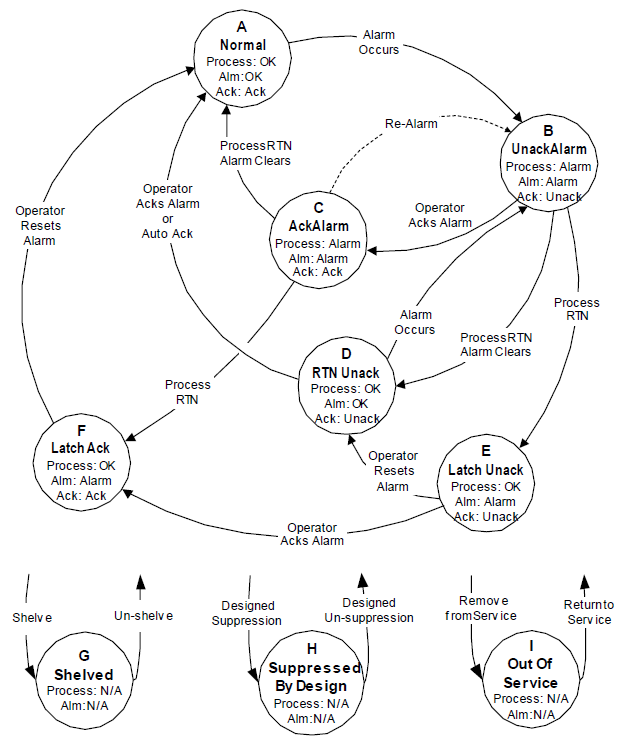
Alarm Message Fields Updates (ISA 18.2 State Machine)
The following table shows all state transitions in the ISA 18.2 state machine where each column specifies if alarm message fields are read updated from theirs related inputs (YES) or stays unmodified (NO) – i.e. evaluated in from previous state. N/A marks not supported transitions.
|
Target Source |
A |
B |
C |
D |
E |
F |
G |
H |
I |
|
A – Normal |
N/A |
YES |
N/A |
N/A |
N/A |
N/A |
YES |
YES |
YES |
|
B – UnackAlarm |
N/A |
YES |
NO |
NO |
NO |
N/A |
NO |
NO |
NO |
|
C – AckAlarm |
NO |
YES |
N/A |
N/A |
N/A |
NO |
NO |
NO |
NO |
|
D – RTN Unack |
NO |
YES |
N/A |
N/A |
N/A |
N/A |
NO |
NO |
NO |
|
E – Latch Unack |
N/A |
N/A |
N/A |
NO |
N/A |
NO |
NO |
NO |
NO |
|
F – Latch Ack |
NO |
N/A |
N/A |
N/A |
N/A |
N/A |
NO |
NO |
NO |
|
G – Shelved |
YES |
NO |
NO |
NO |
NO |
NO |
N/A |
N/A |
N/A |
|
H – Suppressed By Design |
YES |
NO |
NO |
NO |
NO |
NO |
N/A |
N/A |
N/A |
|
I – Out Of Service |
YES |
NO |
NO |
NO |
NO |
NO |
N/A |
N/A |
N/A |
Scan Rate – Data point scan rate - applies to all “dynamic” inputs. Scan rate of the configuration group (in milliseconds).
Expression – This expression must return a numeric value, which corresponds to one of the configured condition codes. In general, it combines input data into a condition code. Enter an expression in the text entry field. This section of the tab functions similarly to ICONICS' Expression Editor.
Settings Tab
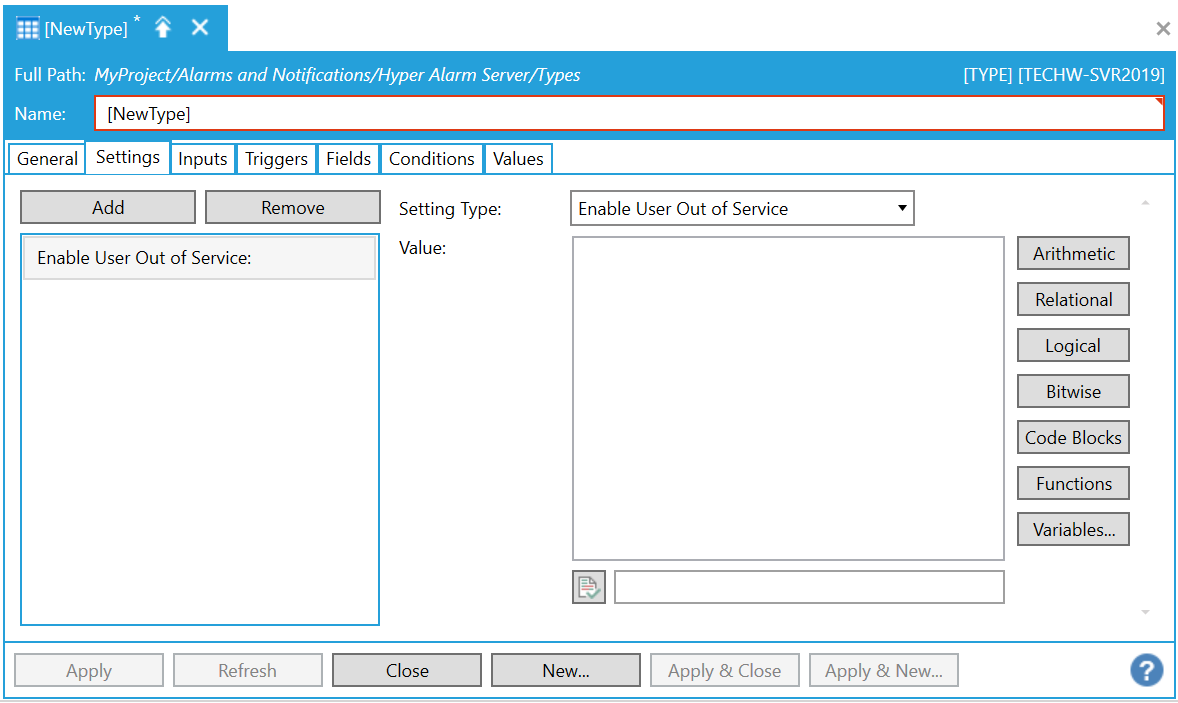
This section allows users to configure all remaining settings that are independent on fields or conditions. Currently, management of all “suppressed” states and alarm delay times is supported.
All settings are optional. All not configured values use default values as shown in the following table.
Setting Type – One of the predefined setting type. Use the pulldown menu to select from Enable User Out of Service, Enable User Suppressed by Design, Suppressed by Design, Enable User Shelved, Alarm On-Delay, or Alarm Off-Delay
|
Setting Type |
Description |
Default Value |
|
Enable User Out of Service |
Enables User to manually set “Out of Service” state |
False |
|
Out of Service |
Directly controls the state of “Out of Service” via input value(s) or constants. “Enable User Out of Service” must be disabled to make this work |
Disabled |
|
Enable User Suppressed by Design |
Enables User to manually set “Suppressed by Design” state |
False |
|
Suppressed by Design |
Directly controls the state of “Suppressed by Design” via input value(s) or constants. “Enable User Suppressed by Design” must be disabled to make this work |
Disabled |
|
Enable User Shelved |
Enables User to manually set “Shelved” state |
False |
|
Shelved |
Directly controls the state of “Shelved” via input value(s) or constants. “Enable User Shelved” must be disabled to make this work |
Disabled |
|
Alarm On-Delay |
For how long alarm source waits before it switches to “alarm” state. Delay is in seconds. |
0 – no delay |
|
Alarm Off-Delay |
For how long alarm source waits before it switches to “normal” state. Delay is in seconds. |
0 – no delay |
|
Re-Alarm Time |
For how long an alarm can stay in alarm-acknowledged state. Delay is in seconds. |
0 – re-alarm disabled |
|
Maximum Time in Shelved State |
Maximum time an alarm can stay in Shelved suppress state. Delay is in seconds. |
0 – no limit
|
Value – Expression (either constant or based on input values). Enter an expression in the text entry field. This section of the tab functions similarly to ICONICS' Expression Editor.
All expressions used within alarm types (condition evaluations, fields, settings) can use historical and generic method call functions. Thus, it is possible to define alarms based on certain data point(s) history, e.g., to monitor a value trend. These calls are not limited to GENESIS64 products only, such as Hyper Historian, but may call third-party servers via OPC UA or OPC HDA interfaces.
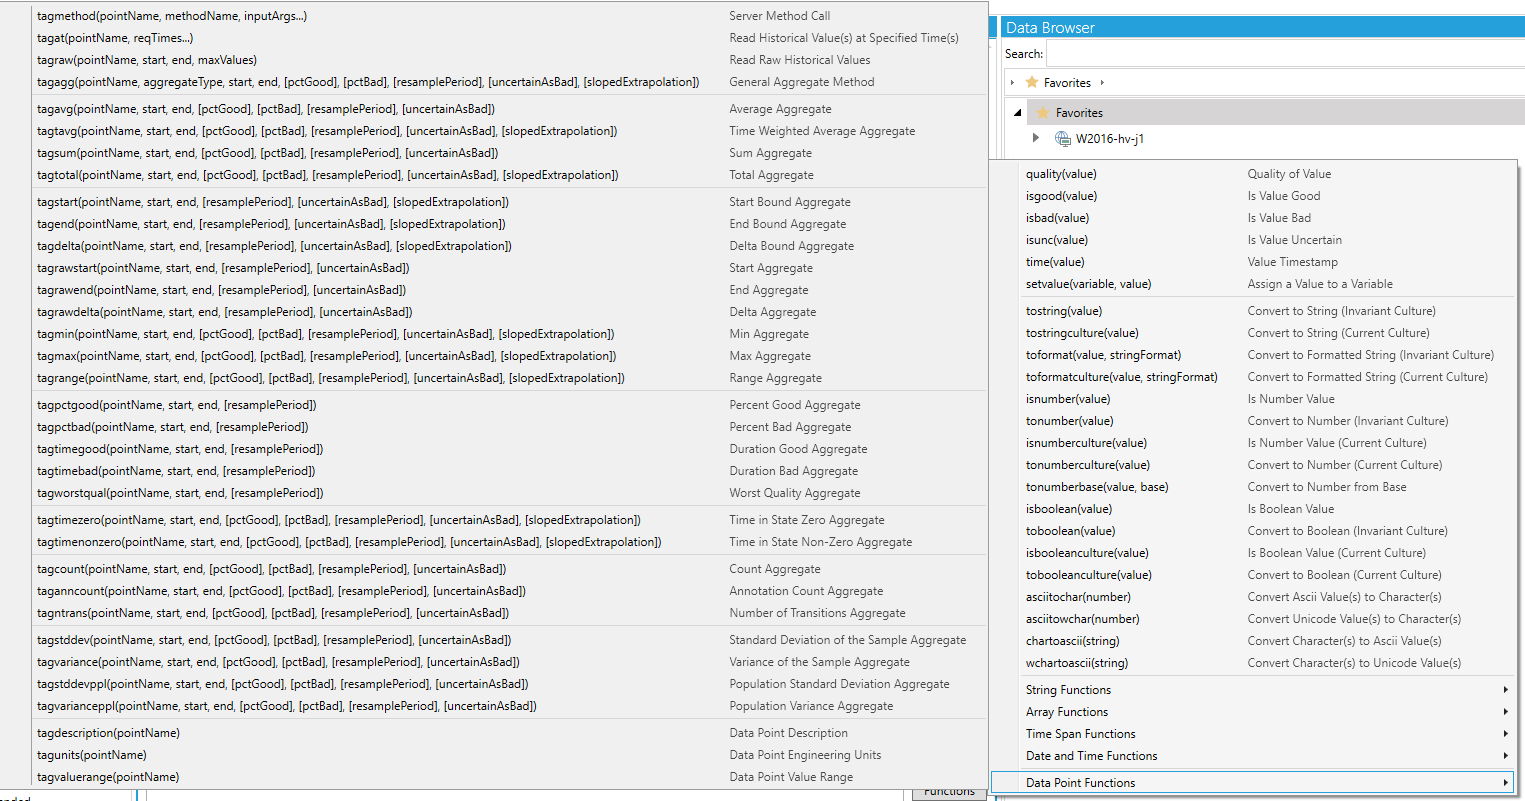
These methods can be found under the “Data Point Functions” menu item in the root of the “Functions” menu, as shown below.
Data Point Functions
The following table shows a list of “Data Point” expression functions. Parameters in the square brackets are optional.
|
Function Name |
Description |
|
tagmethod( pointName, methodName, inputArgs...) |
Invokes a server method with a set of input arguments and returns an array of values representing output method arguments.
Parameters: pointName: A text representing data point name. methodName: A text representing server's method name. inputArgs: Zero or more values passed as input arguments to server method call.
Returns: Returns an array of output method arguments. |
|
tagat( pointName, reqTimes...) |
Reads historical values at specified times.
Parameters: pointName: A text representing data point name. reqTimes: One or more DateTime values to define the specific timestamps for which values are to be read.
Returns: Returns one or more values with specified timestamps. |
|
tagraw( pointName, start, end, maxValues) |
Reads historical values in specified time domain up to specified maximum number of values.
Parameters: pointName: A text representing data point name. start: DateTime value indicating begin of the time interval to process data for. end: DateTime, TimeSpan or Numeric milliseconds value offset against start time, indicating end of the time interval to process data for. maxValues: Maximum number of values to return in single function call. Value must be between 1 and 1000.
Returns: Returns zero or more raw values organized in array of values. |
|
tagagg( pointName, aggregateType, start, end, [pctGood], [pctBad], [resamplePeriod], [uncertainAsBad], [slopedExtrapolation]) |
Calculates one or more resampled values for specified aggregate type name.
Parameters: pointName: A text representing data point name. aggregateType: Aggregate type name. start: DateTime value indicating begin of the time interval to process data for. end: DateTime, TimeSpan or Numeric milliseconds value offset against start time, indicating end of the time interval to process data for. pctGood: Numeric value in range 0-100 indicating percentage of good samples in given time interval to return good status code for processed value. pctBad: Numeric value in range 0-100 indicating percentage of bad samples in given time interval to return bad status code for processed value. When NaN value is used then percentBad is calculated as 100.0 - percentGood. resamplePeriod: TimeSpan value representing aggregate resample period. When zero then it calculates aggregate for the whole-time interval specified by start and end times. uncertainAsBad: Indicates how the server treats data returned with a StatusCode severity Uncertain with respect to Aggregate calculations. slopedExtrapolation: Indicates how the server interpolates data when no boundary value exists (i.e. extrapolating into the future from the last known value).
Returns: Returns one or more resampled values. Single resampled value can be accessed directly while multiple values are returned as an array of values. |
|
tagavg( pointName, start, end, [pctGood], [pctBad], [resamplePeriod], [uncertainAsBad]) |
Returns average value for all raw values in resample interval.
Parameters: pointName: A text representing data point name. start: DateTime value indicating begin of the time interval to process data for. end: DateTime, TimeSpan or Numeric milliseconds value offset against start time, indicating end of the time interval to process data for. pctGood: Numeric value in range 0-100 indicating percentage of good samples in given time interval to return good status code for processed value. pctBad: Numeric value in range 0-100 indicating percentage of bad samples in given time interval to return bad status code for processed value. When NaN value is used then percentBad is calculated as 100.0 - percentGood. resamplePeriod: TimeSpan value representing aggregate resample period. When zero then it calculates aggregate for the whole-time interval specified by start and end times. uncertainAsBad: Indicates how the server treats data returned with a StatusCode severity Uncertain with respect to Aggregate calculations.
Returns: Returns one or more resampled values. Single resampled value can be accessed directly while multiple values are returned as an array of values. |
|
tagtavg( pointName, start, end, [pctGood], [pctBad], [resamplePeriod], [uncertainAsBad], [slopedExtrapolation]) |
Returns time weighted average value for resample interval.
Parameters: pointName: A text representing data point name. start: DateTime value indicating begin of the time interval to process data for. end: DateTime, TimeSpan or Numeric milliseconds value offset against start time, indicating end of the time interval to process data for. pctGood: Numeric value in range 0-100 indicating percentage of good samples in given time interval to return good status code for processed value. pctBad: Numeric value in range 0-100 indicating percentage of bad samples in given time interval to return bad status code for processed value. When NaN value is used then percentBad is calculated as 100.0 - percentGood. resamplePeriod: TimeSpan value representing aggregate resample period. When zero then it calculates aggregate for the whole-time interval specified by start and end times. uncertainAsBad: Indicates how the server treats data returned with a StatusCode severity Uncertain with respect to Aggregate calculations. slopedExtrapolation: Indicates how the server interpolates data when no boundary value exists (i.e. extrapolating into the future from the last known value).
Returns: Returns one or more resampled values. Single resampled value can be accessed directly while multiple values are returned as an array of values. |
|
tagsum( pointName, start, end, [pctGood], [pctBad], [resamplePeriod], [uncertainAsBad]) |
Returns sum value for all raw values in resample interval.
Parameters: pointName: A text representing data point name. start: DateTime value indicating begin of the time interval to process data for. end: DateTime, TimeSpan or Numeric milliseconds value offset against start time, indicating end of the time interval to process data for. pctGood: Numeric value in range 0-100 indicating percentage of good samples in given time interval to return good status code for processed value. pctBad: Numeric value in range 0-100 indicating percentage of bad samples in given time interval to return bad status code for processed value. When NaN value is used then percentBad is calculated as 100.0 - percentGood. resamplePeriod: TimeSpan value representing aggregate resample period. When zero then it calculates aggregate for the whole-time interval specified by start and end times. uncertainAsBad: Indicates how the server treats data returned with a StatusCode severity Uncertain with respect to Aggregate calculations.
Returns: Returns one or more resampled values. Single resampled value can be accessed directly while multiple values are returned as an array of values. |
|
tagtotal( pointName, start, end, [pctGood], [pctBad], [resamplePeriod], [uncertainAsBad], [slopedExtrapolation]) |
Returns total value for resample interval (normalized to milliseconds).
Parameters: pointName: A text representing data point name. start: DateTime value indicating begin of the time interval to process data for. end: DateTime, TimeSpan or Numeric milliseconds value offset against start time, indicating end of the time interval to process data for. pctGood: Numeric value in range 0-100 indicating percentage of good samples in given time interval to return good status code for processed value. pctBad: Numeric value in range 0-100 indicating percentage of bad samples in given time interval to return bad status code for processed value. When NaN value is used then percentBad is calculated as 100.0 - percentGood. resamplePeriod: TimeSpan value representing aggregate resample period. When zero then it calculates aggregate for the whole-time interval specified by start and end times. uncertainAsBad: Indicates how the server treats data returned with a StatusCode severity Uncertain with respect to Aggregate calculations. slopedExtrapolation: Indicates how the server interpolates data when no boundary value exists (i.e. extrapolating into the future from the last known value).
Returns: Returns one or more resampled values. Single resampled value can be accessed directly while multiple values are returned as an array of values. |
|
tagstart( pointName, start, end, [resamplePeriod], [uncertainAsBad], [slopedExtrapolation]) |
Returns the value at the start time for the interval by calculating the Simple Bounding Values for the interval.
See tagtotal for parameter description. |
|
tagend( pointName, start, end, [resamplePeriod], [uncertainAsBad], [slopedExtrapolation]) |
Returns the value at the end time for the interval by calculating the Simple Bounding Values for the interval.
See tagtotal for parameter description. |
|
tagdelta( pointName, start, end, [resamplePeriod], [uncertainAsBad], [slopedExtrapolation]) |
Returns the difference between the Start Bound and the End Bound Aggregates with the exception that both the start and end must be good values.
See tagtotal for parameter description. |
|
tagrawstart( pointName, start, end, [resamplePeriod], [uncertainAsBad]) |
Returns the earliest raw value within the interval and returns that value with the timestamp at which that value occurs.
Parameters: pointName: A text representing data point name. start: DateTime value indicating begin of the time interval to process data for. end: DateTime, TimeSpan or Numeric milliseconds value offset against start time, indicating end of the time interval to process data for. resamplePeriod: TimeSpan value representing aggregate resample period. When zero then it calculates aggregate for the whole-time interval specified by start and end times. uncertainAsBad: Indicates how the server treats data returned with a StatusCode severity Uncertain with respect to Aggregate calculations.
Returns: Returns one or more resampled values. Single resampled value can be accessed directly while multiple values are returned as an array of values. |
|
tagrawend( pointName, start, end, [resamplePeriod], [uncertainAsBad]) |
Returns the latest raw value within the interval and returns that value with the timestamp at which that value occurs.
See tagrawstart for parameter description. |
|
tagrawdelta( pointName, start, end, [resamplePeriod], [uncertainAsBad]) |
Returns the difference between the earliest and latest good raw values in the interval.
See tagrawstart for parameter description. |
|
tagmin( pointName, start, end, [pctGood], [pctBad], [resamplePeriod], [uncertainAsBad], [slopedExtrapolation]) |
Returns the minimum good value for each interval, Simple Bounding Values are included.
Parameters: pointName: A text representing data point name. start: DateTime value indicating begin of the time interval to process data for. end: DateTime, TimeSpan or Numeric milliseconds value offset against start time, indicating end of the time interval to process data for. pctGood: Numeric value in range 0-100 indicating percentage of good samples in given time interval to return good status code for processed value. pctBad: Numeric value in range 0-100 indicating percentage of bad samples in given time interval to return bad status code for processed value. When NaN value is used then percentBad is calculated as 100.0 - percentGood. resamplePeriod: TimeSpan value representing aggregate resample period. When zero then it calculates aggregate for the whole-time interval specified by start and end times. uncertainAsBad: Indicates how the server treats data returned with a StatusCode severity Uncertain with respect to Aggregate calculations. slopedExtrapolation: Indicates how the server interpolates data when no boundary value exists (i.e. extrapolating into the future from the last known value).
Returns: Returns one or more resampled values. Single resampled value can be accessed directly while multiple values are returned as an array of values. |
|
tagmax( pointName, start, end, [pctGood], [pctBad], [resamplePeriod], [uncertainAsBad], [slopedExtrapolation]) |
Returns the maximum good value for each interval, Simple Bounding Values are included.
See tagmin for parameter description. |
|
tagrange( pointName, start, end, [pctGood], [pctBad], [resamplePeriod], [uncertainAsBad], [slopedExtrapolation]) |
Returns the difference between the maximum and minimum values in the interval, Simple Bounding Values are included.
See tagmin for parameter description. |
|
tagpctgood( pointName, start, end, [resamplePeriod]) |
Returns percent of good values for each interval (time weighted).
Parameters: pointName: A text representing data point name. start: DateTime value indicating begin of the time interval to process data for. end: DateTime, TimeSpan or Numeric milliseconds value offset against start time, indicating end of the time interval to process data for. resamplePeriod: TimeSpan value representing aggregate resample period. When zero then it calculates aggregate for the whole-time interval specified by start and end times.
Returns: Returns one or more resampled values. Single resampled value can be accessed directly while multiple values are returned as an array of values. |
|
tagpctbad( pointName, start, end, [resamplePeriod]) |
Returns percent of bad values for each interval (time weighted).
See tagpctgood for parameter description. |
|
tagtimegood( pointName, start, end, [resamplePeriod]) |
Returns the sum of the duration of all good regions (each good region starts with good value sample).
See tagpctgood for parameter description. |
|
tagtimebad( pointName, start, end, [resamplePeriod]) |
Returns the sum of the duration of all bad value regions (each good region starts with bad value sample).
See tagpctgood for parameter description. |
|
tagworstqual( pointName, start, end, [resamplePeriod]) |
Returns the worst status of the raw values in the interval where a Bad status is worse than Uncertain, which is worse than Good.
See tagpctgood for parameter description. |
|
tagtimezero( pointName, start, end, [pctGood], [pctBad], [resamplePeriod], [uncertainAsBad], [slopedExtrapolation]) |
Returns the time Duration during the interval that the Variable was in the zero state.
Parameters: pointName: A text representing data point name. start: DateTime value indicating begin of the time interval to process data for. end: DateTime, TimeSpan or Numeric milliseconds value offset against start time, indicating end of the time interval to process data for. pctGood: Numeric value in range 0-100 indicating percentage of good samples in given time interval to return good status code for processed value. pctBad: Numeric value in range 0-100 indicating percentage of bad samples in given time interval to return bad status code for processed value. When NaN value is used then percentBad is calculated as 100.0 - percentGood. resamplePeriod: TimeSpan value representing aggregate resample period. When zero then it calculates aggregate for the whole-time interval specified by start and end times. uncertainAsBad: Indicates how the server treats data returned with a StatusCode severity Uncertain with respect to Aggregate calculations. slopedExtrapolation: Indicates how the server interpolates data when no boundary value exists (i.e. extrapolating into the future from the last known value).
Returns: Returns one or more resampled values. Single resampled value can be accessed directly while multiple values are returned as an array of values. |
|
tagtimenonzero( pointName, start, end, [pctGood], [pctBad], [resamplePeriod], [uncertainAsBad], [slopedExtrapolation]) |
Returns the time Duration during the interval that the Variable was in the non-zero state.
See tagtimezero for parameter description. |
|
tagcount( pointName, start, end, [pctGood], [pctBad], [resamplePeriod], [uncertainAsBad]) |
Returns a count of all the raw values within an interval.
Parameters: pointName: A text representing data point name. start: DateTime value indicating begin of the time interval to process data for. end: DateTime, TimeSpan or Numeric milliseconds value offset against start time, indicating end of the time interval to process data for. pctGood: Numeric value in range 0-100 indicating percentage of good samples in given time interval to return good status code for processed value. pctBad: Numeric value in range 0-100 indicating percentage of bad samples in given time interval to return bad status code for processed value. When NaN value is used then percentBad is calculated as 100.0 - percentGood. resamplePeriod: TimeSpan value representing aggregate resample period. When zero then it calculates aggregate for the whole-time interval specified by start and end times. uncertainAsBad: Indicates how the server treats data returned with a StatusCode severity Uncertain with respect to Aggregate calculations.
Returns: Returns one or more resampled values. Single resampled value can be accessed directly while multiple values are returned as an array of values. |
|
taganncount( pointName, start, end, [pctGood], [pctBad], [resamplePeriod], [uncertainAsBad]) |
Returns a count of all Annotations in the interval.
See tagcount for parameter description.
|
|
tagntrans( pointName, start, end, [pctGood], [pctBad], [resamplePeriod], [uncertainAsBad]) |
Returns a count of the number of transition the Variable had during the interval.
See tagcount for parameter description. |
|
tagstddev( pointName, start, end, [pctGood], [pctBad], [resamplePeriod], [uncertainAsBad]) |
Returns standard deviation of the sample in the interval (N - 1).
See tagcount for parameter description. |
|
tagvariance( pointName, start, end, [pctGood], [pctBad], [resamplePeriod], [uncertainAsBad]) |
Returns variance of the sample in the interval (N - 1).
See tagcount for parameter description. |
|
tagstddevppl( pointName, start, end, [pctGood], [pctBad], [resamplePeriod], [uncertainAsBad]) |
Returns population standard deviation in the interval (N).
See tagcount for parameter description. |
|
tagvarianceppl( pointName, start, end, [pctGood], [pctBad], [resamplePeriod], [uncertainAsBad]) |
Returns population variance in the interval (N).
See tagcount for parameter description. |
|
tagdescription(pointName) |
Returns configured description text for specified data point name.
Parameters: pointName: A text representing data point name.
Returns: Returns a text value representing data point's description. |
|
tagunits(pointName) |
Returns configured engineering units for specified data point name.
Parameters: pointName: A text representing data point name.
Returns: Returns a text value representing data point's engineering units. |
|
tagvaluerange(pointName) |
Returns configured value range for specified data point name.
Parameters: pointName: A text representing data point name.
Returns: Returns an array of two values, where first value represents low range and second value high range. |
Once you have completed setting your properties, click Apply to save them and Close to return to the Workbench.
See Also: