|
|
The features on this page require a GENESIS64 Advanced license and are not available with GENESIS64 Basic SCADA . |

![]()
|
|
The features on this page require a GENESIS64 Advanced license and are not available with GENESIS64 Basic SCADA . |
![]()
For more information on Meter Data Spikes, see Meter Data Spikes Overview.
To Configure the Meter Data Spikes Tool:
Open your project in the Workbench, then expand your project in the Project Explorer, then expand the AnalytiX node and then the Energy AnalytiX node.
Double-click on the Meter Data Spikes Tool node (or right-click and select Edit from the pulldown menu or select the node then click on the Edit button in the Edit section of the Home ribbon).
This opens the Meter Data Spikes Tool properties, shown below.
Meter Data Spikes Tool Properties
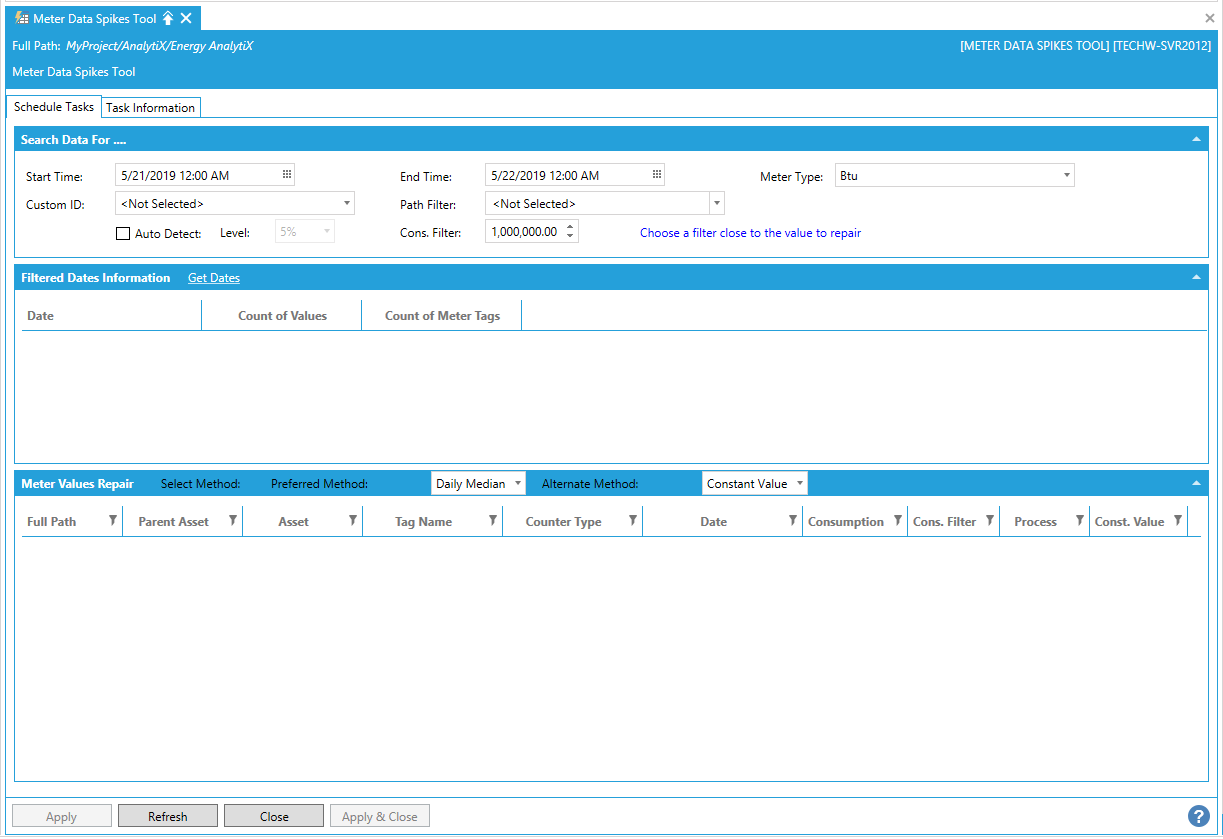
Search Data For....
Start Time -Enter a start time in the text entry field or click on the  button to open the Date and Time picker window to select your start time.
End Time -Enter an end time in the text entry field or click on the button to open the Date and Time picker window to select your end time.
Meter Type -Use the pulldown menu to select a Meter Type from Btu, Electric, Gas, Lights and Fan, Receptacles, Shared Systems, Steam, Total Electric, or Water.
Custom ID -Use the pulldown menu to select a Custom ID.
Path Filter -Use the pulldown menu to select a Path Filter.
Auto Detect -If selected, a statistical method based on mean and standard deviation will be utilized to identify potential candidate values for meter data spikes.
Level -If enabled, use the pulldown menu to select from 10%, 5%, 2.5%, 1%, 0.5%, 0.1%, or 0.01%.
Cons. Filter -If enabled, enter a cons. filter number in the text entry field (or use the up/down arrow buttons). Choose a filter close to the value to repair.
Filtered Dates Information
Get Dates -Refreshes with eligible time intervals where candidate meter spikes were detected.
Date -Displays the base summary-based date of the detected meter spike.
Count of Values -Displays the count of detected meter data spikes for a given date.
Count of Meter Tags -Displays the distinct count of meter consumption tags for which meter data spikes were detected.
Meter Values Repair
Select Method - Preferred Method - Use the pulldown menu to select from Interpolate, Daily Average, Constant Value, Previous value, Daily Median.
Select Method - Alternate Method - Use the pulldown menu to select from Interpolate, Daily Average, Constant Value, Previous value, Daily Median.
Full Path -Displays full energy meter full path.
Parent Asset -Displays parent path of energy meter.
Asset -Displays the energy meter name.
Tag Name - Displays the energy meter consumption tag name.
Counter Type - Displays the meter consumption tag name.
Date - Displays the date of the detected meter data spike.
Consumption - Displays the based summary consumption value.
Cons. Filter - Displays the consumption value filter utilized in detecting meter data spike.
Process - If selected, the related meter data spike record will be scheduled for processing by the Energy AnalytiX service.
Const. Value - Displays the constant value to be utilized when repairing a meter data spike, if the Constant Value option is selected.
Meter Data Spikes Tool - Task Information Tab
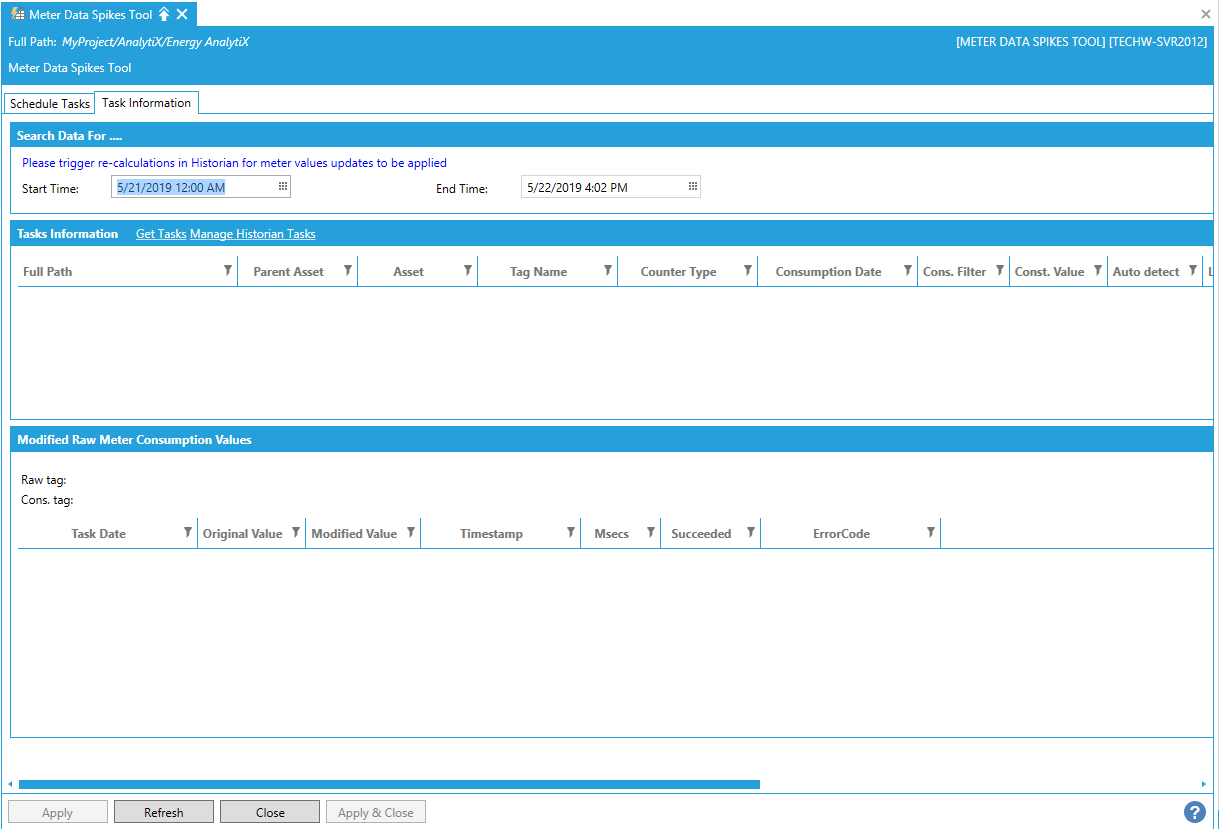
Search Data For ....
Start Time -Enter a start time in the text entry field or click on the button to open the Date and Time picker window to select your start time.
End Time -Enter an end time in the text entry field or click on the button to open the Date and Time picker window to select your end time.
Tasks Information
Get Tasks - Click this link to get scheduled tasks.
Manage Historian Tasks -Click this link to open the Calculations Task Management properties in ICONICS Hyper Historian.
Full Path -Displays full energy meter full path.
Parent Asset - Displays parent path of energy meter.
Asset - Displays the energy meter name.
Tag Name - Displays the energy meter consumption tag name.
Counter Type - Displays the meter consumption tag name.
Consumption Date - Displays the base summary data where the meter data spike was detected.
Cons. Filter - Displays the consumption value filter utilized in detecting meter data spike.
Const. Value -Displays the constant value to be utilized when repairing a meter data spike, if the Constant Value option is selected.
Auto detect - Indicates if the autodetect approach was utilized.
Level - Displays the auto detect level value.
Orig. Consumption - Displays original consumption prior to any action taken to repair meter data spike.
Estimated Cons. - Displays the estimated consumption after action has been taken to repair meter data spike.
Processed - Indicates if the scheduled request to process meter data spike was processed.
Method used - Displays the actual method utilized to repair the meter data value.
Value used - Displays the estimated value to repair the meter data spike, based on the applied repair method.
Status - Displays the status of the scheduled meter data spike repair.
Info - Displays informational or error message related to the meter data repair action taken.
Modified Raw Meter Consumption Values
Raw tag - Actual Hyper Historian energy meter consumption tag.
Cons. tag - Actual Hyper Historian energy meter consumption calculation tag.
Task Date - Date when meter data repair task was scheduled.
Original Value - Original value of the raw energy meter consumption tag.
Modified Value - Modified value by Energy AnalytiX service of the raw meter consumption tag as a result of the meter data repair action.
Timestamp - Timestamp of the raw energy meter consumption tag.
Msecs - Milliseconds of the raw energy meter consumption tag.
Succeeded - Indication if Energy AnalytX was successful in modifying the underlying energy meter consumption tag value in Hyper Historian.
ErrorCode - Error code if the raw value modification failed.
When you have completed setting the Meter Data Spikes Tool, click on Apply and then Close to return to the Workbench.
See Also: