|
|
The features on this page require a GENESIS64 Advanced license and are not available with GENESIS64 Basic SCADA . |

![]()
|
|
The features on this page require a GENESIS64 Advanced license and are not available with GENESIS64 Basic SCADA . |
![]()
This document describes IoTWorX™ and how to configure it.
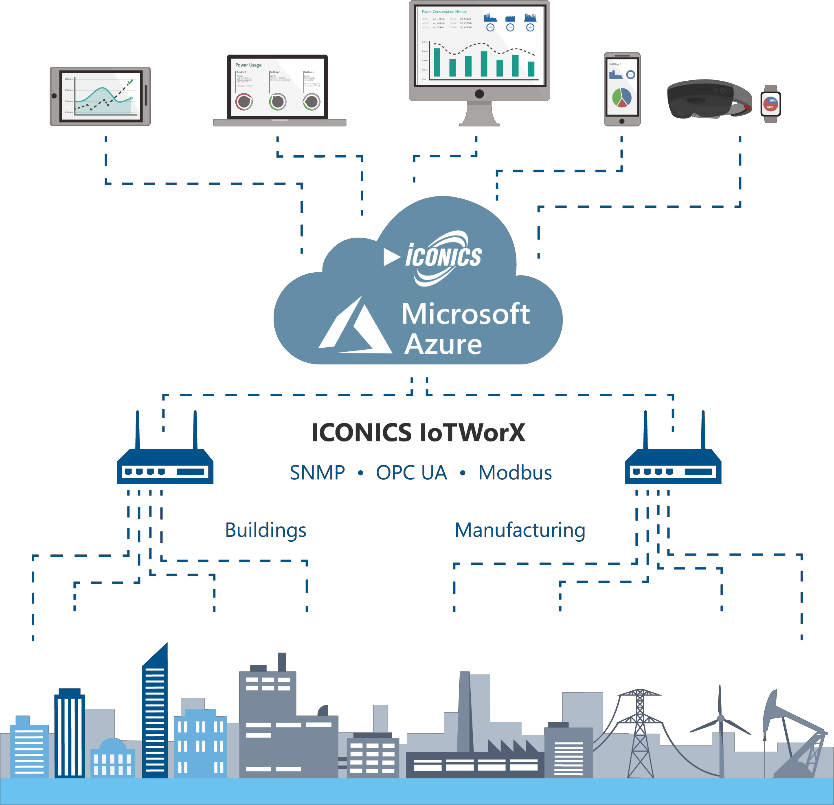
IoTWorX bridges the gap between an on-premises communications networks and an Azure cloud-based deployment platform. The IoTWorX device, which can be considered an “edge device”, provides data connectivity between on-premises end devices and the cloud. Targeting process, factory, and building automation as well as other industries, IoTWorX has built-in support for on premise communications including SNMP, Modbus, and OPC UA. The cloud communication path is highly secure and is based on Advanced Message Queuing Protocol (AMQP) and a publish/subscribe (“pub/sub”) mechanism.
IoTWorX provides manufacturers and facility managers with a flexible platform to create Internet of Things applications. ICONICS offers several key IoT technologies, including rich connectivity to things (OPC, OPC UA, SNMP, Modbus), secure cloud communications, and built-in real-time visualization and analytics. With simple setup and configuration, users can easily create remote monitoring and analytics solutions that meet their innovative business requirements for collaboration and shared insight across widely dispersed assets. The ICONICS IoT solution leverages the Azure cloud to provide global visibility, scalability, and reliability. Connect to standard ICONICS applications in the cloud such as GENESIS64™, Hyper Historian™, AnalytiX®, and more. Optionally integrate Microsoft Azure services such as Power BI and Machine Learning to provide greater depth of analyses
In the Azure portal, select your Azure storage account and then Access Keys. Copy the Connection string – primary key and keep it handy. This will be used in a later step.
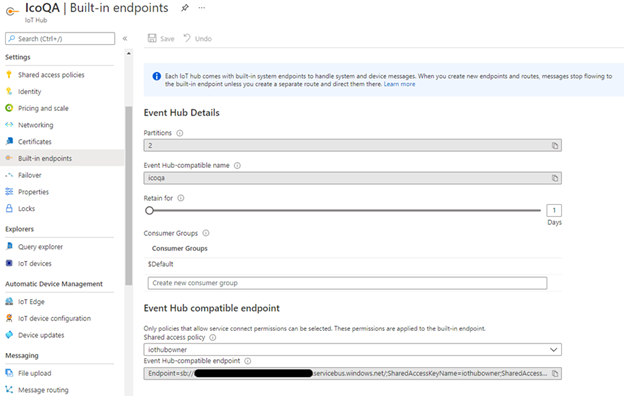
In the Azure portal, select your IoT Hub, select Built-in endpoints. Copy the Event Hub-compatible endpoint and keep it handy.
Copy Event Hub-compatible endpoint
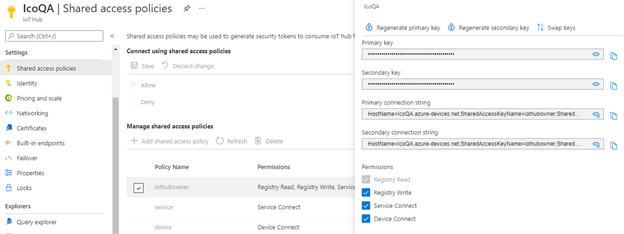
Go to Shared access policies. Select the iothubowner policy. Copy the Connection string – primary key and keep it handy.
Shared access policies
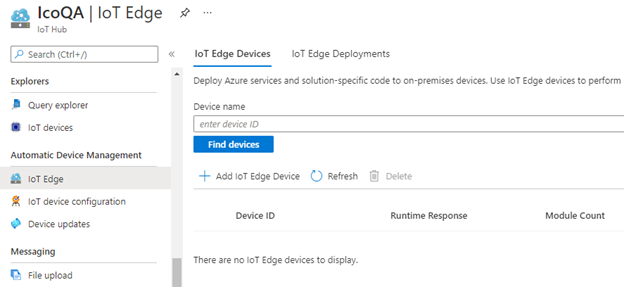
Now we are ready to create a device. Still on the IoT Hub page, select IoT Edge and then Add IoT Edge device.
Select IoT Edge
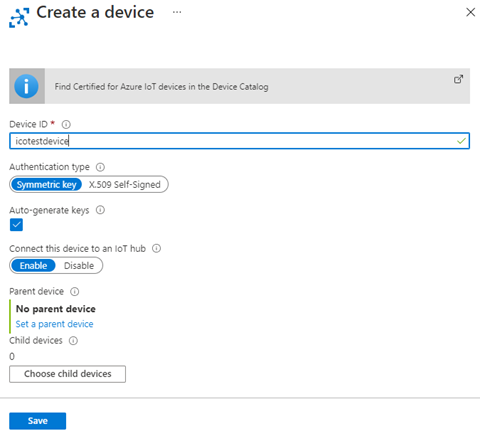
Name your device and then click Save.
Name Your Device
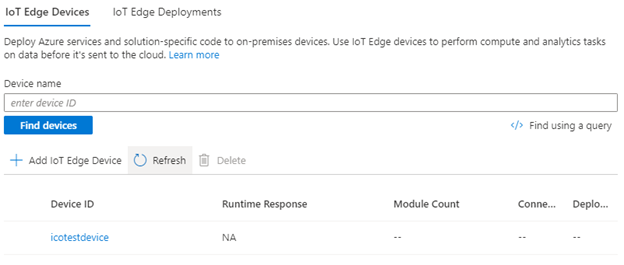
The device will now be listed under IoT Edge Devices.
Listing Under IoT Edge Devices
Click the device to be brought to the overview page.
Click the Device to Go to Overview
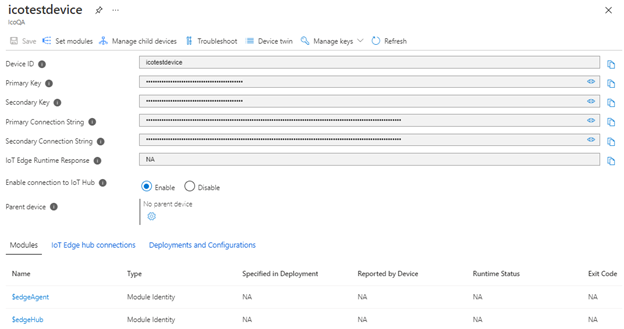
Copy the Connection String and keep it handy.
IoTWorX doesn’t require an installation since the container will be deployed automatically by IoT Edge. However, the gateway must be still configured to host IoTWorX containers. It’s possible to configure the gateway manually or automatically using the scripts available in the IoTWorX Tools ZIP package.
Download the IoTWorX Tools ZIP
The IoTWorX Tools ZIP can be obtained in several ways.
ICONICS customers with a current support plan can download the zip file from the Customer Connection Portal.
Go to https://partners.iconics.com.
Log in.
Select Support > Product Downloads.
Download the IoTWorX Tools file.
Mitsubishi Electric customers can download the zip file from the ICONICS Community Portal.
Log in.
Select Resources > Product Downloads.
Download the IoTWorX Tools file.
New users looking to try IoTWorX can request an IoTWorX trial at https://iconics.com/Products/IoTWorX. You will be sent a link to download the IoTWorX Tools file.
Install IoTWorX on Ubuntu 64-bit Edge Device
Option 1: If you are using Ubuntu 18.04 (server or desktop version) use the following steps in Terminal to install IoTWorX on your device:
Unzip the IoTWorX Tools ZIP file.
Cd into the unzipped folder containing the IoTWorX_inst_amd64.sh script.
Run this command: sudo chmod +x ./IoTWorX_inst_amd64.sh
Run this command: sudo ./IoTWorX_inst_amd64.sh
If you run sudo iotedge list on the device, you will see that the edgeAgent module is running.
For production environments, update the Docker log file settings to limit the size (see: https://docs.microsoft.com/en-us/azure/iot-edge/production-checklist).
Option 2: On your IoT device, install Azure IoT Edge runtime. Directions for doing so can be found here: https://docs.microsoft.com/en-us/azure/iot-edge/how-to-install-iot-edge-linux
Install IoTWorX on Other Edge Devices
Option 1: For Linux operating systems based on ARM32, such as Raspberry Pi OS, use the following steps to prepare the device:
Unzip the IoTWorX Tools ZIP file.
Cd into the unzipped folder containing the IoTWorX_inst_amd64.sh script.
Run this command: sudo chmod +x ./IoTWorX_inst_arm32.sh
Run this command: sudo ./IoTWorX_inst_arm32.sh
If you run sudo iotedge list on the device, you will see that the edgeAgent module is running.
For production environments, update the Docker log file settings to limit the size (see: https://docs.microsoft.com/en-us/azure/iot-edge/production-checklist).
Option 2: On your IoT device, install Azure IoT Edge runtime. Directions for doing so can be found here:
https://docs.microsoft.com/en-us/azure/iot-edge/how-to-install-iot-edge-linux
Install IoTWorX on Windows
Option 1: For Windows client operating systems, ICONICS provides a PowerShell script to facilitate the setup and installation of EFLOW. It requires Windows 10 Version 1809 or later; build 17763 or later,and must be Professional, or Enterprise editions. Use the following steps to prepare the device:
Unzip the IoTWorX Tools ZIP file.
Run Windows PowerShell as Administrator (note: PowerShell ISE is not supported for certain commands).
Enable running signed scripts by runningthis command: Set-ExecutionPolicy -ExecutionPolicy AllSigned -Force
Cd into the unzipped folder containing the IoTWorX_inst_win.ps1 script.
Run this command: & '.\IoTWorX_inst_win.ps1'
Option 2: On your Windows device, install EFLOW manually. Directions for doing so can be found at the link below. Make sure to use the PowerShell option.
https://docs.microsoft.com/en-us/azure/iot-edge/how-to-install-iot-edge-on-windows
Note: Use the Edge Device connection string obtained in step 8 of the previous section when editing the /etc/iotedge/config.yaml file. For production systems, you should also install certificates for IoT Edge. More information can be found here: https://docs.microsoft.com/en-us/azure/iot-edge/how-to-create-transparent-gateway
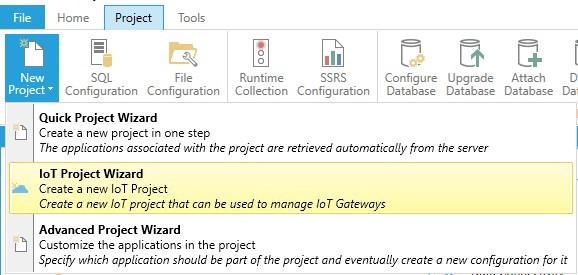
On the server where ICONICS Suite is installed, open Workbench and launch the IoT Project Wizard.
Launch IoT Project Wizard
Give your project some name. In the Storage Connection field, enter the connection string obtained in the first step of this document. In the Storage Folder field, enter the folder within the storage where you would like your IoT device configurations stored.
Click the "+" button next to the Subscriber Connection field.
Enter a name for your subscription, and then enter the Event Hub connection string and IoT Hub owner connection string obtained in step 2 and step 3 of the first section of this document. Click OK.
Click Next.
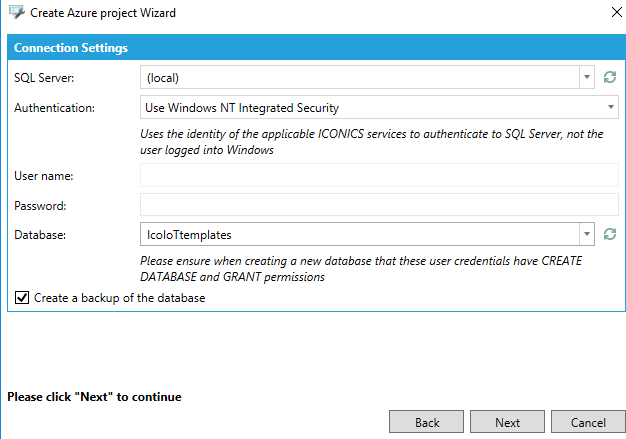
Select your SQL Server, then enter the name of a NEW database where we will store the template configuration for our devices.
Enter New Database Name
Click Next, then Next again.
Check the Install/Overwrite checkbox for each module that you will plan to use on your IoT device.
Check Install/Overwrite Checkboxes
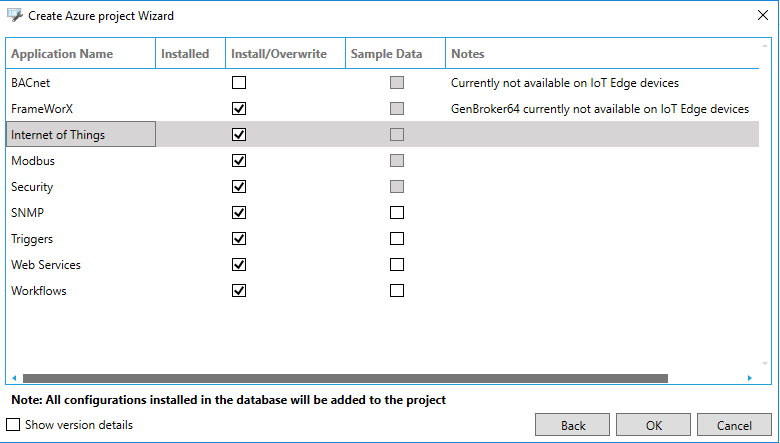
Note: The sample data for several modules could be optionally generated in the new database. Check the Sample Data checkbox for each module that you want to generate them.
Click OK to create the project.
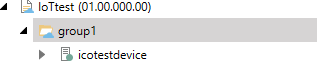
Expand the new IoT project in Workbench to see the device listed:
Listed Device
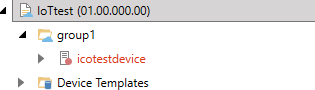
The device appears red here to indicate we cannot deploy new ICONICS configurations to the device yet. We first need ICONICS modules running on the device before we can update its configuration. To do this, right-click on it and select Configure Modules.
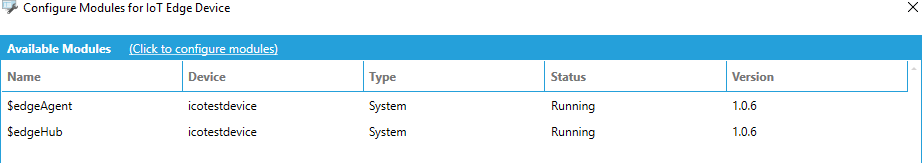
On the next screen, you will see the status of the Edge modules running on the device. Click the Click to configure modules link in the Available Modules header.
Available Modules
Under the Deployment Options section, select an option from the Version and Architecture dropdowns that are applicable to your deployment.
Check the Deploy checkbox for each ICONICS module you would like to add to your IoT device.
Note: The minimum required modules are FrameWorX Server, IoT Publisher and Ico Edge Agent. As we are using the IoT Visualizer for local visualizations later in this document, we recommend also deploying the IoT Visualizer module to the IoT device already in this step.
Click Deploy. You should see a “Deploy successfully completed” message, indicating that a new deployment has been queued for the device. Click Close.
At this point, ICONICS modules will begin downloading to the IoT device. Depending on the speed of your internet, this may take some time (ICONICS modules total about 1.6 GB).
After modules have finished downloading and have started on the device, if you refresh your device group in Workbench, you will see that the device is no longer red. It now has a green status icon indicating that it is online and running.
Green Status Icon
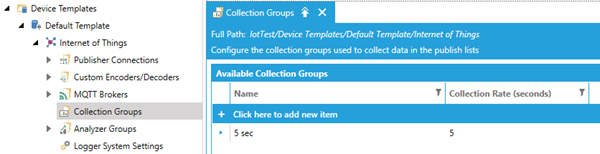
Now that ICONICS modules are running on the device, we can deploy configurations to it. First, we will define a collection group. Expand your Default Template and Internet of Things provider. Right-click Collection Groups and select Edit.
Add a new Collection Group to the list. This defines how often tags will be collected on the device. Apply your changes and close the form.
Add New Collection Group
Next, we will define a publish list. Right click Publish Lists and select Add Publish List. Give your list a name and change the Default Collection Group to the group created in the previous step. Change the Publish Rate and Refresh Rate to values appropriate for your deployment.
Define Publish List
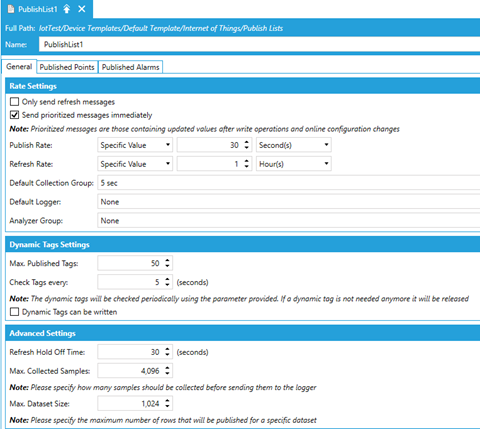
Note: There is an upper limit of 50 tags in dynamic subscriptions. Users are strongly encouraged to use static publish lists for this reason. Dynamic subscriptions are intended for small ad hoc requests for data, not large sets of tags.
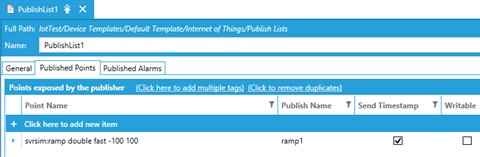
On the Published Points tab, add the points you would like to be published. As an example, you can enter svrsim:ramp double fast -100 100 as a point name with a Publish Name of ramp1. Apply your changes and close the form.
Add Points to Published Points Tab
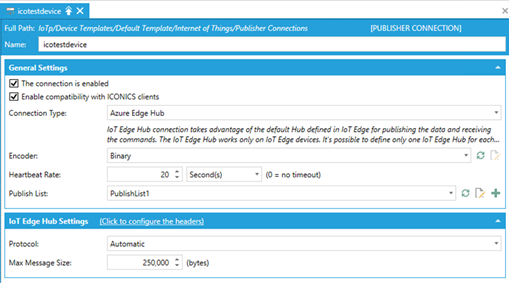
Open the Publisher Connection form for your device. Specify the publish list you created in the previous step as the Publish List. Apply your changes and close the form.
Specify Publish List
Now we will deploy this configuration to the device. Right-click your device and select Deploy Device(s) Configuration. Workbench will create a new task to accomplish this. What is happening under the hood is:
The configuration that has been created in Workbench and stored in SQL Server is exported and a SQLite file is created.
The SQLite file (and other configuration pieces such as custom KPI dashboards) are packaged and sent to the Azure Storage account.
The Edge device’s module twin is updated with the location of the new configuration.
The device receives a notification that its twin was updated and will download and apply the new configuration.
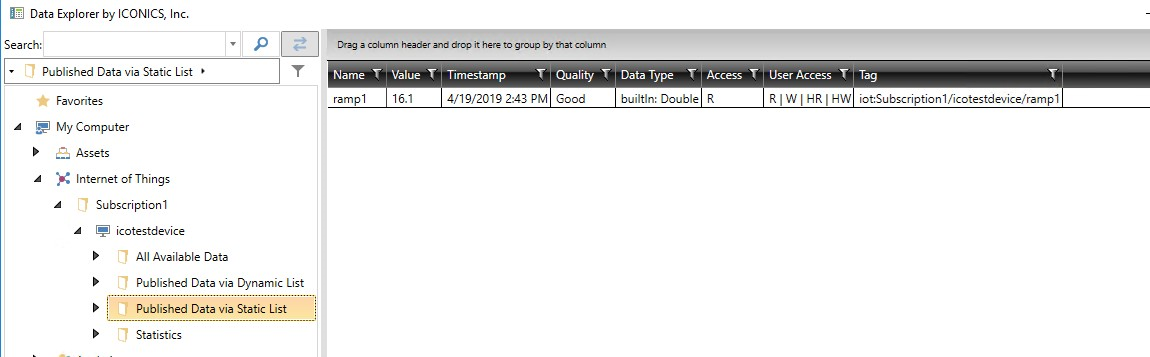
To confirm the new configuration has been applied, open Data Explorer. Browse to your device and look at the Published Data via Static List. You should see the point(s) you had defined earlier.
Confirm New Configuration
It's highly recommended to change the default password for the Diagnostics and Configuration pages.
Go to the IoTWorX Landing Page by browsing to http://DeviceIPaddress.
Select Diagnostics and Configuration.
Log in as admin with the default password of iconics.
Follow the prompts to set a new admin password.
The IoTWorX Hyper Collector allows users to buffer data locally on their IoTWorX devices and optionally send that data to a server running in the cloud, either via an IoT Hub or direct connection.
Configuring the Logger and Publish List
In the Workbench, expand your IoT project > Device Templates > Default Template > Internet of Things.
In the Loggers folder, add a new logger.
Give the logger a name.
Configure the settings for the buffered data. The default values indicate a weeks worth of data will be kept as long as the max total size of 10240 MB is not exceeded. Once the storage limits have been met, the oldest storage would be removed until the limit is reached.
Apply the changes.
Edit your publish list.
On the General tab, choose the logger you created as the Default Logger.
Go to the Published Points tab.
Add a new point to your publish list.
Give the new point a Publish Name. (For example, ramp2.)
For the new point, enable Local Buffering and HDA and Cloud Buffering and HDA.
Note: Local Buffering and HDA makes the historical data available locally on the edge device. Cloud Buffering and HDA makes the historical data available to external servers connected via the cloud. Local buffering must be enabled to allow cloud buffering.
Apply the changes.
There are two ways to send historical data from the edge device to the ICONICS server, using the Azure IoT Hub or FrameWorX communication.
The next sections will describe how to configure each of these connections and give you some factors to consider when choosing one for your project. For demonstration purposes you can follow the examples in one or both sections, but a real project will likely use just one connection type for historical data.
A Platform Services connection uses direct FrameWorX communication and bypasses the Azure IoT Hub. This communication method may be less expensive, since it doesn't use any IoT Hub messages, but requires the FrameWorX communication port (usually 8778) to be opened on the subscriber side.
In Workbench, expand your IoT project > Device Templates > Default Template > Internet of Things.
In the Publisher Connections folder, create a new publisher connection.
Give it a name (for example, HistoricalPlatformServices).
Set the Connection Type to Platform Services.
For Publish List, choose the publish list we were working with in the "Configuring the Logger and Publish List" section.
In the Platform Services Setting section, set Publish Machine Name to the DNS name or IP address of the Hyper Historian where the collected data will be sent.
Apply the changes.
Expand Internet of Things > Nodes.
Open the Publish Nodes form.
Add a new entry and associate this new connection with your device. (Make sure not to change the existing entry for your device. We will use the Edge Hub connection in the next section if we are configuring an Edge Hub connection as well.)
Apply the changes.
Expand your local (non-IoT) project > Historical Data > Hyper Historian > Data Collections.
Create a folder with the same name as the Platform Services connection in the IoT project (for example, HistoricalPlatformServices).
Add a new point to this folder.
Set this point's Name to be the Publish Name of one of your published points (for example, ramp2).
Note: You can use "." or "/" characters in the publish name of points in your in Publish List of IoT project to match folders in your Hyper Historian Data Collections tree. For instance, a tag with a publish name of "building1.room2.temp3" or "building1/room2/temp3" using the "mypub" publisher connection would match with a Hyper Historian tag named "temp3" in the Data Collections > mypub > building1 > room2 folder.
Uncheck the Is Collected checkbox
Apply your changes.
Start the Hyper Historian service if it’s not already running.
Go to your IoT project.
Right-click your device and select Deploy Device(s) Configuration.
Open a web browser.
Browse to the landing page for the device (http://IPaddressOfDevice).
Click the link to launch the Visualizer.
In the Tag Browser, browse to Home > IoT Publisher > Buffered Data > your publish list. There you will see your buffered tag listed.
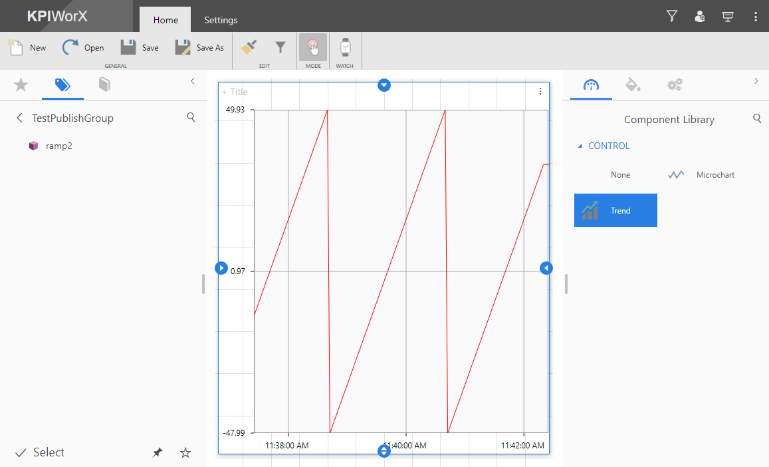
Drag your tag into the main dashboard. You will see a Trend Viewer widget is automatically created and the buffered data is shown.
Trend Viewer Widget
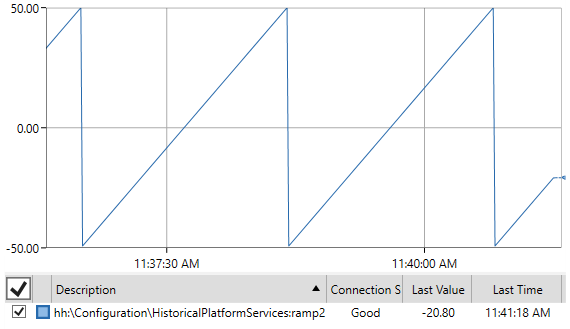
You can use a TrendWorX64 Viewer in GraphWorX64 on your Hyper Historian machine to confirm that the data is being logged there as well.
TrendWorX64 Viewer in GraphWorX64
An Azure Edge Hub connection uses the IoT Hub. This method will send messages to the IoT Hub and could increase the cost of your hub; however, it doesn't require any additional ports to be opened on the subscriber side. Also, there isn't a need to manually define each tag in the Hyper Historian configuration as there is with the Platform Services connection.
In Workbench, expand your IoT project > Device Templates > Default Template > Internet of Things > Publisher Connections.
Edit your existing publisher connection, which should have a Connection Type of Azure Edge Hub.
For Publish List, choose the publish list we were working with in the "Configuring the Logger and Publish List" section.
Apply the changes.
Right-click your device and select Deploy Device(s) Configuration.
Expand your local (non-IoT) project > Internet of Things.
In the Loggers folder, create a new logger.
Give the logger a name.
Enable The logger is used by all subscriber connection to retrieve the collected data.
Apply the changes.
Expand Internet of Things > Subscriber Connections.
Edit your existing subscriber connection.
Enable Collect the logged data retrieved with this subscription.
Apply the changes.
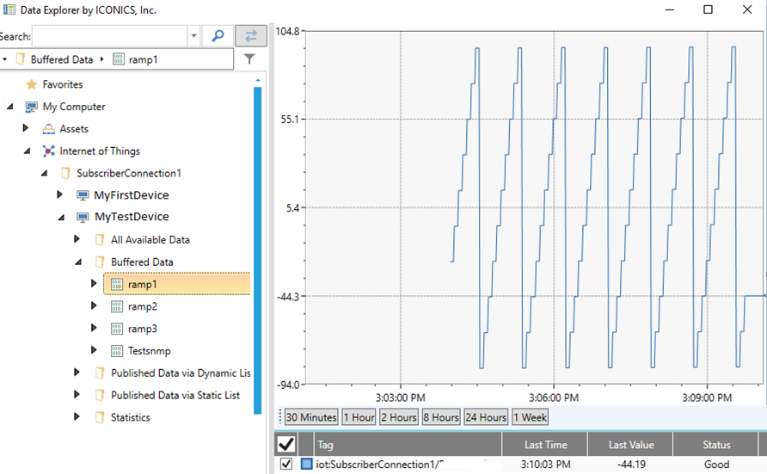
The IoT subscriber can now process the buffered data. To see this in action, open Data Explorer.
Browse to Internet of Things > your subscription name > your device name > Buffered Data.
Select one of the points. You’ll see a Trend Viewer populated that contains the buffered data for that point.
Populated Trend Viewer
We can also store this logged data into Hyper Historian. To do so, expand your local (non-IoT) project > Historical Data > Hyper Historian > your logger.
Under your logger, in your logging group, create a new Merge Group.
Configure the Synchronization Trigger section. This trigger will determine how often you want the data to be merged from the IoT Subscriber into the Hyper Historian.
Expand Historical Data > Hyper Historian.
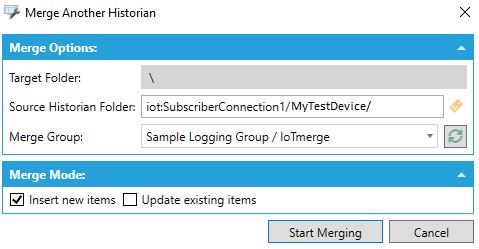
Right-click on Data Collections and choose Merge Another Historian.
Note: The "Merge Another Historian" action will automatically generate tags in the Hyper Historian configuration.
Click the browse button next to the Source Historian Folder field.
In the data browser, browse to My Computer > Internet of Things > Subscriber Connections > your subscriber connection > the device you want to merge, then click OK.
For Merge Group, select the merge group created earlier.
Select Start Merging.
Start Merging
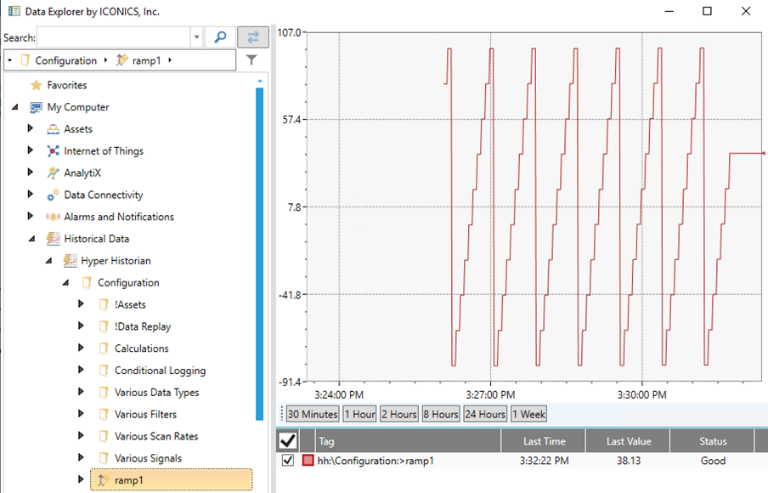
A task to add the tags will be automatically added. Once it is complete, you will see that the tags have automatically been added to the Hyper Historian configuration. To see the historical data, you can again use Data Explorer. Browse to the tags My Computer > Historical Data > Hyper Historian > Configuration and see a trend viewer populate with the buffered data.
Trend Viewer Populating with Buffered Data
IoTWorX includes a security server that provides the same basic functionality as the security server running on a full ICONICS Suite system. This security allows for the creation of users and restrictions of privileges, such as access to certain points and actions. The IoTWorX security server provides only the subset of security features that apply to edge devices.
Additionally, edge devices with IoTWorX installed can report GenEvents that are readable in an AlarmWorX64 Viewer in the IoT Visualizer, providing information on who has logged in, what points were changed, and other important events.
In Workbench, expand your IoT project > Device Templates > Default Template > Internet of Things > Security.
Add a user to the Users folder.
Give the user a name
Apply the changes.
When prompted, give the user a password.
Right-click your device and select Deploy Device(s) Configuration.
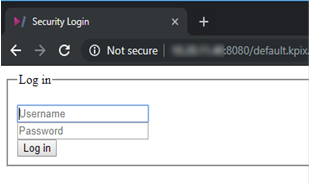
Once the deployment is complete, open the IoT Visualizer on the device by going to http://DeviceIPaddress:8080.
You will be presented with a login prompt. Log in with the credentials you created previously.
Login Prompt
IMPORTANT: If you haven't already done so, log into the Diagnostics and Configuration page for your edge device and change the default admin password. Keeping the default admin password could provide a security vulnerability, allowing a malicious user to create an ICONICS security user. See the "Adding Security Users via Local Interface" section for more details.
Displaying GenEvents
If you haven't already, follow the steps in the previous section, "Configuring Security".
Go to the Settings tab.
Select Symbols.
Enable the IoTSymbols library.
Select OK.
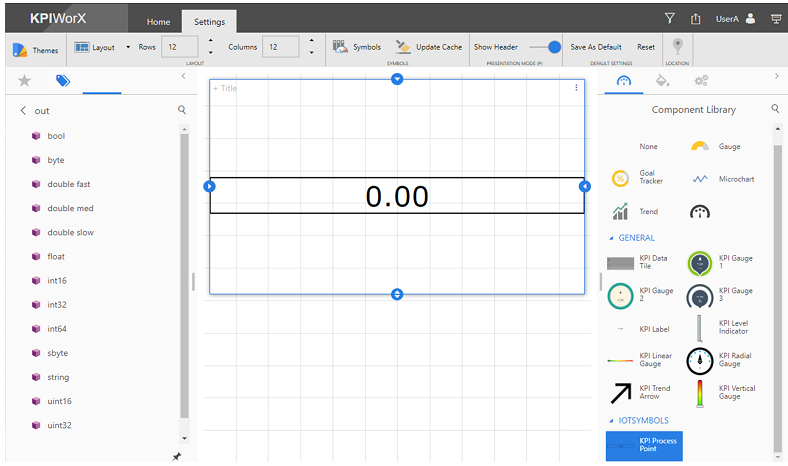
Go to the Component Library panel.
From the IoT Symbols section, drag a KPI Process Point onto the dashboard.
Resize the process point widget, so it takes up half of the dashboard.
Go to the Data Browser panel.
Browse to Platform Services > Server Internal Simulator > Out.
Drag Int16 onto the process point widget.
Process Point Widget
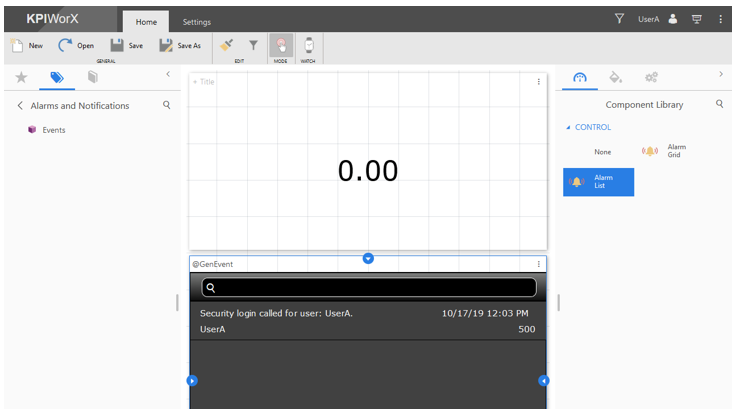
In the Data Browser, select the back button until you have returned to the top level.
Browse to Alarm and Notifications.
Drag Events into the unoccupied part of the dashboard. You will see an alarm list widget automatically created subscribed to GenEvents.
Alarm List Widget
Go into presentation mode.
Write a value to the process point.
After a few moments, right click the alarm viewer and select Refresh History. You will see that a new event is shown in the viewer showing that a value was written and by which user.
Note: You can also change the Alarm List to an Alarm Grid and see similar information. Additionally, you can toggle the Historical property in the setting for the widget to switch between a real time subscription to the GenEvents and a historical subscription.
It is possible to add users directly on the gateway from the local interface on the edge device. This should only be done as a temporary measure, as the security configuration will be overwritten the next time a configuration is deployed from Workbench.
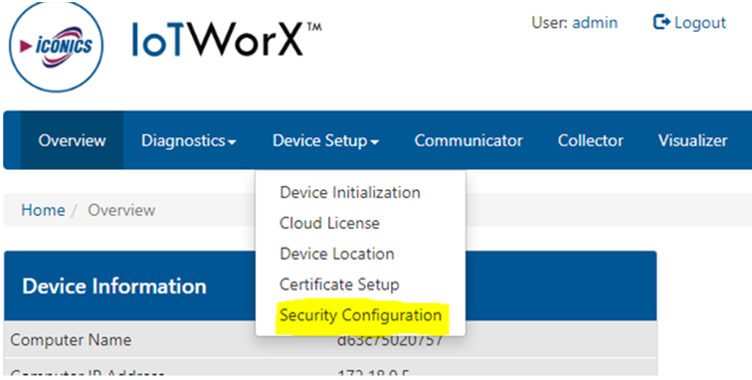
Go to the IoTWorX Landing Page by browsing to http://DeviceIPaddress.
Select Diagnostics and Configuration.
Log in as admin.
Note: The admin user is a built-in account used only for the IoTWorX Diagnostics and Configuration pages. Its default password is iconics. You will be asked to change this password the first time you log in. The user accounts used to log into the Diagnostics and Configuration pages are unrelated to ICONICS security user accounts.
Select Device Setup > Security Configuration.
Device Setup - Security Configuration
Fill in the required fields and select Add Security User. The user will be added to the specified group.
Note: You must have at least one security group defined in your configuration in order to add a user.
See Also:
Auto Provisioning Process (DPS)
IoTWorX Configuration in Workbench