![]()
![]()
Hyper Historian Data Collections can contain multiple Logging Groups , which can contain multiple collector groups and Hyper Historian tags. This topic tells you how to add collector groups, folders for organizing tags, and Hyper Historian tags. It also describes the swinging door and deadband filters that are available on the logging-server for filtering out data before logging data.
Note you can import configuration information from an Excel spreadsheet, an XML file, or a CSV file. For more information, refer to the Importing and Exporting Hyper Historian Configurations topic. Once imported, you can edit imported information as needed.
To Add a New Hyper Historian Collector Group:
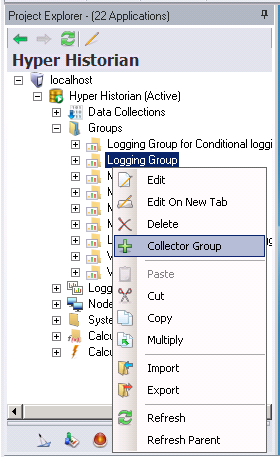
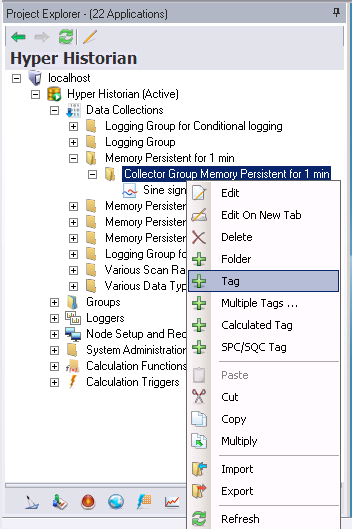
Right-click the Logging Group branch within the Groups node in the navigation tree and select the Collector Group command. The Collector Group configuration form (shown below) opens.
Hyper Historian Collector Group Configuration Form
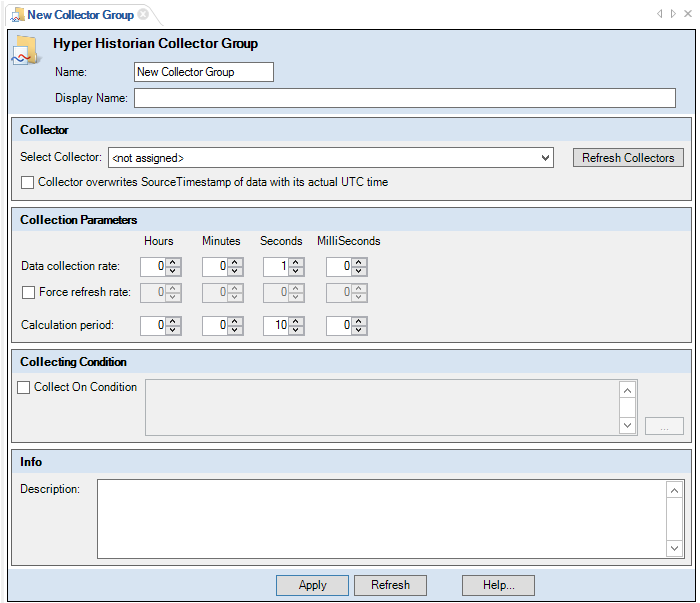
Enter the Name of the Collector Group in the Name text box. The name should be short; it is used as a part of the browse name, and for that reason, you want to keep it short. The Display Name field, not the Name field, is where you want to provide lengthy detail so that the Name field is not long; tags are logged with the browse name that you provided in the Name field, so you want to keep the name short.
Optionally, you can enter a Display Name which appears for the collector group in the Project Explorer. Use the display name to supplement the shortened tag name that you entered in the Name field. If a Display Name is not provided, the Name appears in the Project Explorer instead.
Tip: The Description field at the bottom of this form can contain a detailed description of several lines for the collector group. Use the description for a complete definition of the collector group.
Select the collector from the Select Collector drop-down list. Click the Refresh Collectors button to refresh the collectors listed in the pulldown menu. Click on the Collector overwrites SourceTimestamp of data with its actual UTC time checkbox for the collector to stamp data with its own actual UTC time. As a result, data will be logged in the order it arrives to the collector.
|
|
Note: Hyper Historian will not run with Standalone/Remote Collectors if used with a Standard License. Only users with an Enterprise License can use this type of collector. |
Specify the Data Collection Rate in the Data collection rate combo boxes. The data collection rate is the rate at which the Collector collects the raw data samples from the data source (e.g., OPC DA Server). Specify how frequently a sample will be collected from OPC tags that will be added to this collector group. You can enter the rate in hours, minutes, seconds, or milliseconds. The fastest data collection rate is ten milliseconds. While this option determines the collection rate, how you set each tag’s filters in its configuration determines which collected values are sent to the logger.
To force the collector to refresh on a periodic basis, select the Force Refresh Rate check box and specify the interval at which it is to refresh.
Specify the calculation period in the Collection period combo boxes. The calculation period is the frequency of which the Collector is to perform its Advanced Filtering calculations for the tags within this group. The Calculation Period is used by some calculation filters, called Log to Disk filters that you can configure for Hyper Historian tags. These filters can choose a value from data received over the length of time established by the calculation period. The value used for calculation is extracted from the collector cache before the data is forwarded to the logger (if you’re using a Disk logger configuration) or before memory is cleared (if you’re using a Memory Persistent logger configuration).
The length of the calculation period must take into account the data collection rate and the length that data resides in the memory buffer. Specifically, the calculation period must be longer than the data collection rate, but shorter than the rate at which memory buffer will be cleared. A shorter calculation period provides more data granularity and logs more data, while a longer period provides less granularity but takes up less space. Regardless, if you choose to use a calculation period, you’ll want to synchronize its duration with the expected duration of the cache such that data is not cleared in the middle of a calculation period.
When setting a length for this period, keep in mind the type of OPC tags from which the collection group will be capturing data. For example, how often does the collector take a sample data? How many samples do you want to collect? What granularity of information do you need? What sort of filtering will be used for the Hyper Historian tags added to the collector group?
To set a collection condition, enable the Collect On Condition check box (optional).
Click the ellipsis button [...] in the bottom right of the Collecting Condition section. The Unified Data Manager will appear, allowing you to specify the trigger that will be used to enable logging. Select your trigger then click the OK button. The trigger will then appear in the text entry field of the Collection Condition section.
Enter a description in the Description text box of the Info section. The Description field can contain a detailed description of several lines for the collector group. Use the description for a complete definition of the collector group, so that you can leave the Name and Display Name fields free of excessive information. The Info section helps to specify the use for the collector group. Make the description clear enough so that anyone who maintains the group understands its purpose.
Click the Apply button to apply the changes.
You can now add Hyper Historian Tags to the Collector Group or create Hyper Historian Folders to which you can then add Hyper Historian tags (within the Data Collections node). Steps for creating tags and folders are provided below in this topic.
You can also now add calculated tags to the Collector Group (within the Data Collections node). For more information, refer to the Calculated Tags topic.
The Refresh Collectors button refreshes the screen with the current configuration settings for the Logging Group by reading it from configuration database.
To edit a collector group right-click the group in the Project Explorer tree and select Edit from the pop-up menu.
A Hyper Historian folder can be useful for organizing Hyper Historian Tags.
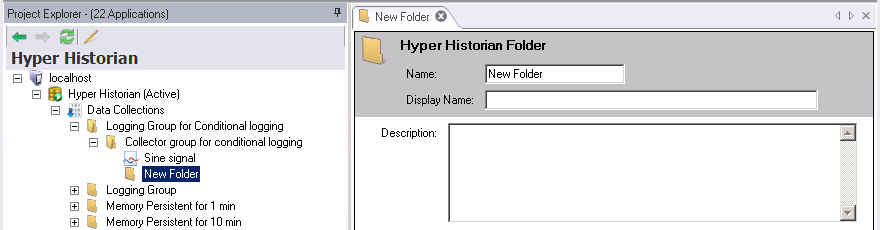
The Folders form appears.
Enter a Name for the folder. The name should be short; it is used as a part of the browse name, and for that reason, you want to keep it short. The Display Name field, not the Name field, is where you want to provide more detail so that the Name field is not long; tags are logged with the browse name that you provided in the Name field, so you want to keep the name short.
Optionally, you can enter a Display Name which appears for the folder in the Project Explorer. Use the display name to supplement the shortened folder name that you entered in the Name field. If a Display Name is not provided, the Name appears in the Project Explorer instead.
The Description field can contain a detailed description of several lines. Use the description for a complete definition of the folder, providing details that make the folder's use apparent to others who may be using it.
Click Apply or Refresh to proceed.
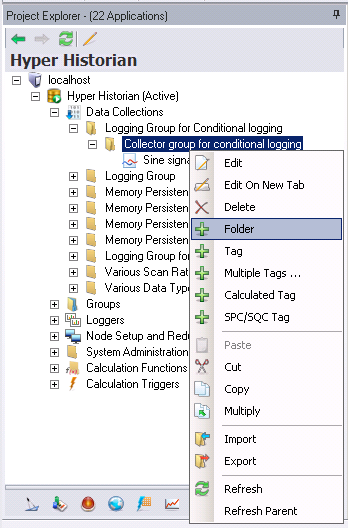
You can now create a Hyper Historian Tag on the same level of the Collector Group or within a newly created Hyper Historian Folder. Right-click on either a collector group or hyper historian folder and select Tag to proceed.
There are two types of Hyper Historian tag:
Tags that are collected to a data collector via an OPC tag, which the collector forwards to the logger
Tags that are written directly to the logger by an external process
A Hyper Historian tag that is collected is a configuration that identifies an OPC tag from which data is to be collected. The configuration can use up to one or two filters to separate out the values to be forwarded to the logger. The Hyper Historian tag doesn't have to use filters though; all sample values that are collected can be forwarded to the logger.
Each Hyper Historian tag collects data from an OPC tag. As you work with Hyper Historian tags, keep in mind that it is the collector group that determines (1) the collection rate at which values are collected for the tags, and (2) the calculation rate, at which calculations are performed on the collected samples, and then forwarded to the logger.
You may find that you need to filter data from an OPC tag in more than one way. In that case, you can simply configure multiple Hyper Historian tags for the same OPC tag in the collector group; each Hyper Historian tag can filter the data in a different way, sending a different subset of data to the logger. (An alternative would be to use one Hyper Historian tag to send an encompassing set of data to the logger, then using post-logging tools, such as Excel, to filter data into usable subsets.)
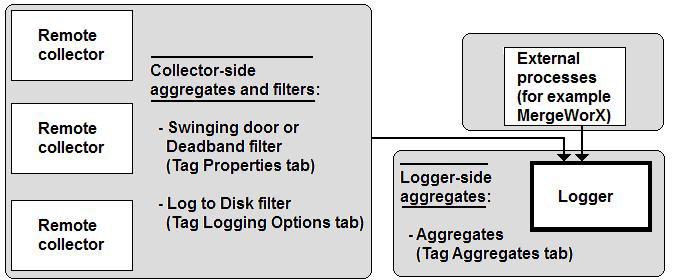
In addition to collecting data, you may be writing data directly to the logger using some other, non-Hyper Historian vehicle, such as a MergeWorX or a TrendWorX64 Viewer. You can still create Hyper Historian tags for this data and logger-side configure aggregates for it. Although you lose collector-side aggregation and filtering, this gives you a filtering mechanism for the data that is written directly to the logger.
The figure below illustrates the options that are available on the collector-side as well as those that are available to you on the logger side of the process. Filters give you the ability to avoid having to log all incoming data. By filtering your data, you can maintain data integrity while considering database limitations. Furthermore, collector-side filters let you reduce network traffic.
Aggregate and Filter Option for Hyper Historian Tags
All of these filters are available to you on the form where you define your Hyper Historian tags. Let's take a look at the Hyper Historian Tag configuration form along with the filters you can use.
To define a Hyper Historian tag and its filtering and aggregation options, follow these steps:
In the Project Explorer, make sure the Hyper Historian provider is selected. Expand the active database configuration > Data Collections > logging group > collector group > tag folder (optional).
Right-click the Collector Group or the Tag Folder and select the Tag command. For an example, click here.
Note that, alternatively, you can select Multiple Tags to create more than one tag. When you select Multiple Tags, the Data Browser opens so you can browse to and select multiple signals. However, if the tag's data is not collected using a signal but is collected and written directly to the logger using some other means, you cannot use the Multiple Tags option to create it. Note that the tag is created using only default values; you may still want to configure each tag individually, following the steps below.
The Hyper Historian Tag configuration form (shown below) opens.
Hyper Historian Tag Configuration Form
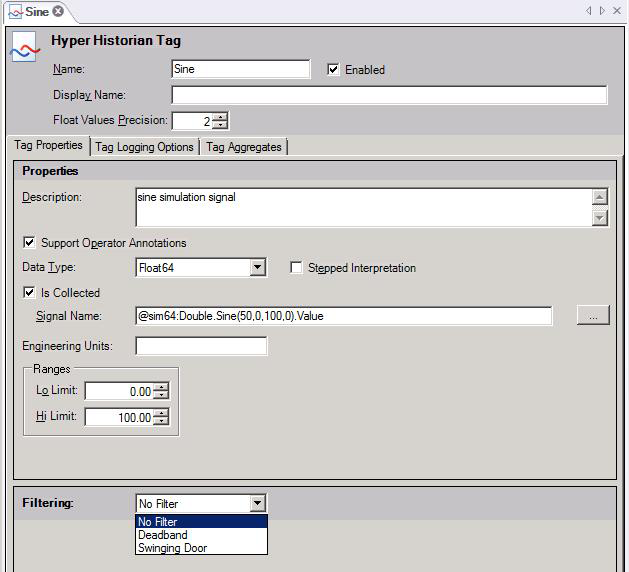
Enter the Name of the Hyper Historian tag in the Name text box. The name should be short; it is used as a part of the browse name, and for that reason, you want to keep it short. The Display Name field, not the Name field, is where you want to provide lengthy detail so that the Name field is not long; tags are logged with the browse name that you provided in the Name field, so you want to keep the name short.
Optionally, you can enter a Display Name which appears for the Hyper Historian tag in the Project Explorer. Use the display name to supplement the shortened tag name that you entered in the Name field. If a Display Name is not provided, the Name appears in the Project Explorer instead.
You can adjust the number of decimal places being shown on the configuration screen by using the Float Values Precision field. The number of decimal places shown can be adjusted from 0 and 8 decimal places.
The Description field can contain a detailed description of several lines for the Hyper Historian tag. Use the description to provide a complete definition of the tag.
The Is Collected check box is selected by default. This means that the Hyper Historian tag's data is collected by the collector from a signal. However, if the tag's data is not collected using a signal, but is collected and written directly to the logger using some other means such as a TrendWorX64 Viewer or a .CSV file via MergeWorX, de-select the Is Collected check box. As a result, the tag's Signal Name field becomes disabled, as does the Filtering field and (on the Tag Logging Options tab, described later in these steps) the Log to Disk options.
For the Signal Name field, select the signal (that is, the tag or point) to be collected by clicking the Signal Name ellipsis button ![]() and browsing for the OPC tag whose data is to be collected. If you leave this field empty, an exclamation icon will remind you that you have to enter one. (Note that this field is not used if the Is Collected check box is empty.)
and browsing for the OPC tag whose data is to be collected. If you leave this field empty, an exclamation icon will remind you that you have to enter one. (Note that this field is not used if the Is Collected check box is empty.)
Select a source type for the data signal associated with the tag using the provided pulldown menu. The signal can come from a GenClient (recommended for processing OPC DA and UDM data), a FwxClient (recommended for processing OPC UA and GridWorX data), or a Dataset (recommended for processing BACNet data).
If you select GenClient or FwxClient in step 10, skip to step 13. Otherwise, continue to step 12.
If you select Dataset in step 10, leave the Dataset field blank if the data set contains only one value or a default set of column names, or enter the user-defined name that appears at the end of each column name in the data set (for example, if your data set includes columns named Value_test and StatusCode_test, enter "test" in the Dataset field).
For the In Group field, select the group in which the tag should appear within the configuration database.
Select the data type from the Data Type drop-down list. Options include: Native, Boolean, Int8, UInt8, Int16, UInt16, Int32, UInt32, Int64, UInt64, Float32, Float64, String, DateTime, and Duration.
You can optionally click a check mark in the Support Operator Comments check box to allow operators to comment on the signal in displays. Later, as the tag’s data values play or replay in the Trend Viewer, you may want to be able annotate the tag’s data values as you see them trending before you. For example, maybe you want to note an operator action that altered the data slightly, or highlight a piece of data for analysis later. Putting a check mark in the Support Operator Annotations check box lets you do that. Such annotations are saved with the tag’s data in its logger file, which makes the annotations available in a replay, accessible to the Hyper Historian SQL Server Interface, and archived with the tag’s data.
Put a check mark next to Stepped Interpretation to enable this feature if it is desired. Stepped Interpretation is used primarily during playback, for interpreting the tag’s data values. This feature is applied only if you request a value for a certain point of time (in the Log to Disk option on the Tag Logging Options tab). The returned value will be the nearest older value available. In general, if the data comes from a discrete signal such as an on/off switch (or a Boolean data type), put a check mark in the Stepped Interpretation check box; but if data comes from a sine wave or analog signal, leave the box empty.
Enter the engineering units.
Enter the Ranges for the High Limit and Low Limits in the provided text entry fields. The High and Low Limits are used by the filter algorithms (deadband filter and swinging door filter).
Optionally, select the type of filtering to be used and enter the filter setting. By default, no filtering is used. For a description of the two types of filtering, refer to the Deadband Filter and Swinging Door Filter sections later in the topic.
If you are using Deadband filtering, set the threshold as either an Absolute or Percent and enter the value in the text entry field.
If you are using Swinging Door filtering, set the threshold as either an Absolute or Percent and enter the value in the text entry field. Then, set both the Maximum Period and Minimum Period in the nearby text entry fields (in milliseconds).
|
|
Note: Filtering options are not available if the Is Collected check box is empty. A tag's Filtering option is applied to data in the collector. If the tag's data is written directly to the logger, no filtering can be applied because the data never passes through the collector. |
Click the Apply button to enforce your selections.
Go the Tag Logging Options tab, and select the Log to Disk option if you don't want to log all collected raw samples be logged (which is the default). Refer to the Log to Disk Options topic for information. (This field is not available if the Is Collected check box is empty.)
Go to the tag's Tag Aggregates tab to set up aggregates, as described in the Aggregate Groups topic.
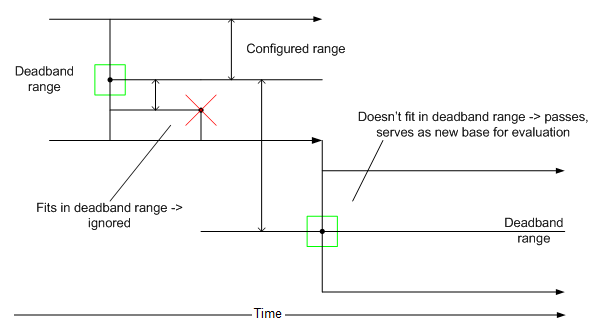
The Deadband filter in Hyper Historian is performed by the Collector on incoming data. It serves as the front-line for all of the filtering logic. The deadband filters out values based on difference of values of consequent changes – if the difference is below defined threshold, new value is ignored.
Deadband configuration is straightforward:
It can be either disabled or enabled
If enabled, it is possible to configure its range as either of the following:
As an absolute value (non-negative).
As a percentage of value range (max - min) defined for the tag. The value configured is minimum difference between values to allow subsequent value. Actual range around base value spans both up and down (see example below).
Deadband Filter Behavior
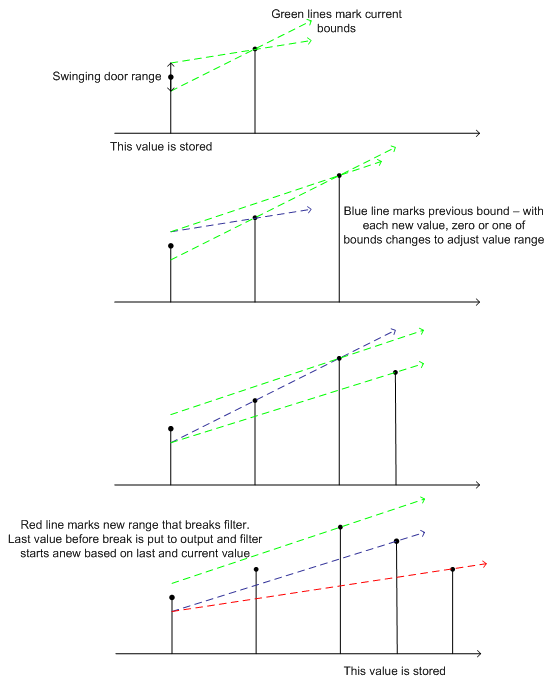
The Swinging Door filter in Hyper Historian is implemented by the Logger on incoming values it receives from the Collector. It serves as the last-line of the filtering logic. The swinging door filters off values based on difference of consequent values from linear trend; if the difference is below defined threshold, new value is ignored.
Swinging door is a generalization of a deadband filter. Swinging door filters off values following certain linear trend. It starts with one value (the first one is always forwarded to storage). Two tangents are considered, originating above and below base value in defined filter range. Tangents are effectively defined by second value in filter (see example). As subsequent values come in, tangents are adjusted to form geometrical region encompassing all values in filter so far.
Geometrically, as long as tangents don’t intersect prior to base value (i.e. the region defined by tangents is not broadening – hence commonly used filter name), the filter is valid. When a new value causes the region to open up, the filter is flushed – the last value prior to the breaking one is dumped to storage and the filter is re initialized using that value and the breaking one.
There are certain guaranties about maximum deviation of values filtered off (the difference of ignored value from stored trend can’t be higher than distance between tangent base points considered above and below base point).
Filter configuration is similar to deadband’s:
It can be either disabled or enabled
If enabled, it is possible to configure its range as either of the following:
As an absolute value (non-negative)
As a percentage of value range (max - min) defined for the tag
Besides these parameters, there are two additional ones:
Minimum distance between values - If two subsequent values are closer (time-wise) than defined threshold, the new value is ignored
Maximum distance of values - If distance between last stored value (physically) and incoming value is higher (time-wise) than defined threshold, the filter is flushed as if new value would be breaking one
Swinging Door Filter Example