|
|
The features on this page require a GENESIS64 Advanced license and are not available with GENESIS64 Basic SCADA . |

![]()
|
|
The features on this page require a GENESIS64 Advanced license and are not available with GENESIS64 Basic SCADA . |
![]()

TrendWorX64 is a client/server application that allows you to collect and display real-time and historical OPC data in charts and graphs that reflect live data or historical data that is being replayed. Based on the OPC UA specification for data exchange between OPC servers and clients, TrendWorX64 provides backwards compatibility to the older standards of OPC-HDA (Historical Data Access) and OPC-DA (Data Access) servers. With TrendWorX64 you can create open solutions that are highly scalable, distributed, and redundant and that can connect with a wide variety of data sources.
With TrendWorX64 you can perform the following operations:
Collect and log OPC data in a SQL server database such as Microsoft SQL Server, SQL Server Express, or an Oracle Database for later analysis using the TrendWorX64 Logger.
Connect and analyze real-time OPC data sources and analyze trends in real-time using the TrendWorX64 Viewer.
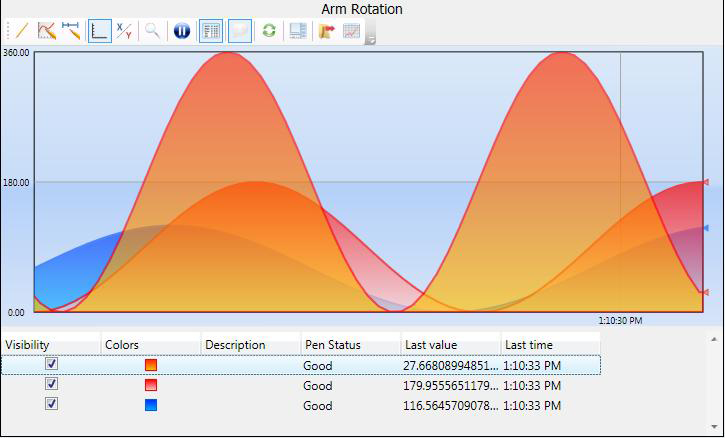
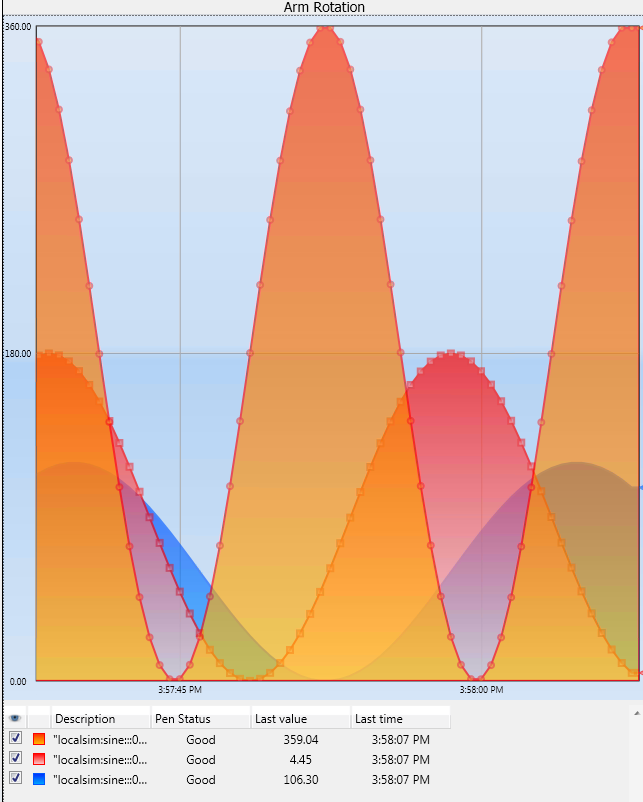
Display trending data in several different plot types including: line, area, bar, pie, and other plot types inside the TrendWorX64 Viewer . For an example, click here.
Insert the TrendWorX64 Viewer into GraphWorX64 to create multifunction HMI (Human/Machine Interface) graphics data displays.
|
|
Warning. Not all TrendWorX64 features are supported in Microsoft Silverlight. If you are saving Silverlight files, refer to Silverlight Files in GENESIS64 for more information. |
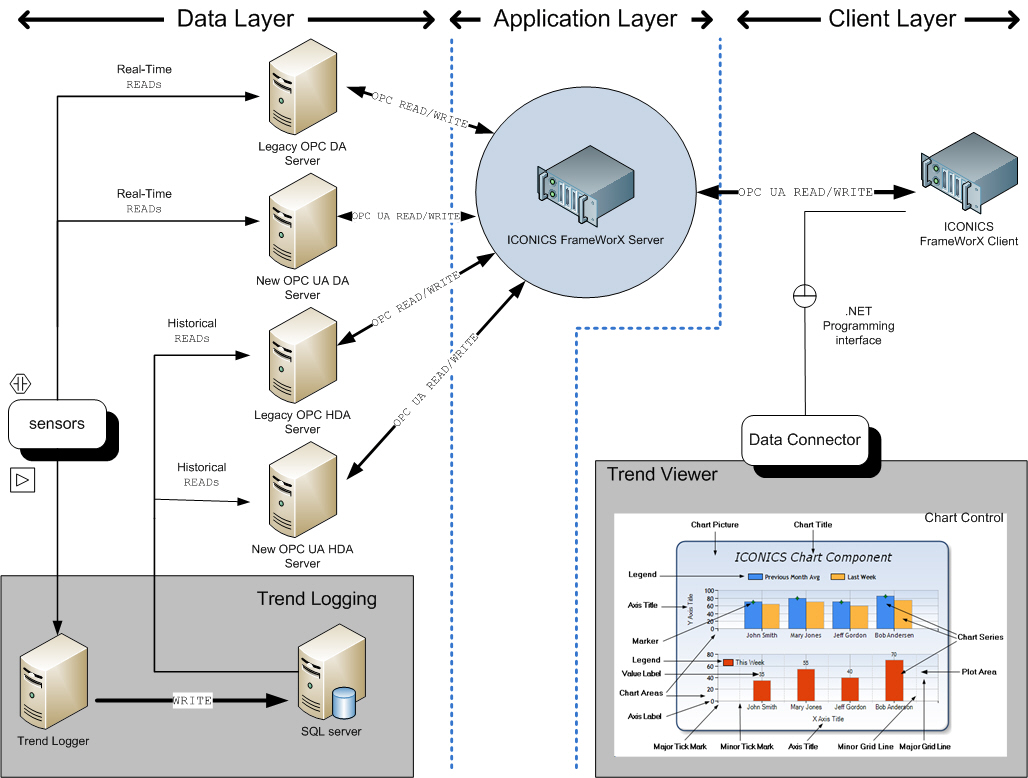
TrendWorX64 uses a multi-tiered client server architecture that with three main architectural layers:
Presentation Layer or Client Layer. The client TrendWorX64 Viewer connects to the FrameWorX server to obtain data that has been processed from the different data sources. TrendWorX64 Viewer is the client application that is the consumer of trending data and this application displays data in a .NET control.
Application Layer or Logic Layer. The FrameWorX server manages the data connection between the different data sources to supply either real-time or historical OPC data to the TrendWorX64 Viewer .
Data Layer . The data layer contains the different types of OPC servers that TrendWorX64 supports, including OPC UA for both data access and historical data as well as OPC-DA and OPC-HDA data sources. The OPC UA Server serves as the source of tags and their values. The trend server could be an ICONICS OPC UA server, a simulator, or a third party OPC UA compliant server product. The data layer also includes a system for recording and storing trending data into a SQL database. The TrendWorX64 Logger is a server application that reads OPC data and stores it in a SQL database for later use. Data stored in the SQL server database is read by an OPC UA historical database server or an OPC-HDA server and is supplied to the FrameWorX server when required. TrendWorX Architecture illustrates the relationship of the various components in the TrendWorX64 system.
|
|
Note: The TrendWorX64 Server can be any OPC UA server and so is written in the form TrendWorX64 server with a lower case "s." This contrasts with the situation of AlarmWorX64 where the AlarmWorX64 Server is an ICONICS application and whose configuration is described in AlarmWorX64 Server . |
In order to successfully monitor and display trending information you will need to have access to your data source, configure the data connection, and create your plot or chart type. Use the list below to ensure that you have performed the necessary steps required for successful data trend analysis. In most cases the exact order that you perform these steps is not crucial.
To configure a trend display, perform the following actions on the server side:
Ensure that the ICONICS FrameWorX server is running. You should see an icon ![]() for this service in the Windows Taskbar Status area.
for this service in the Windows Taskbar Status area.
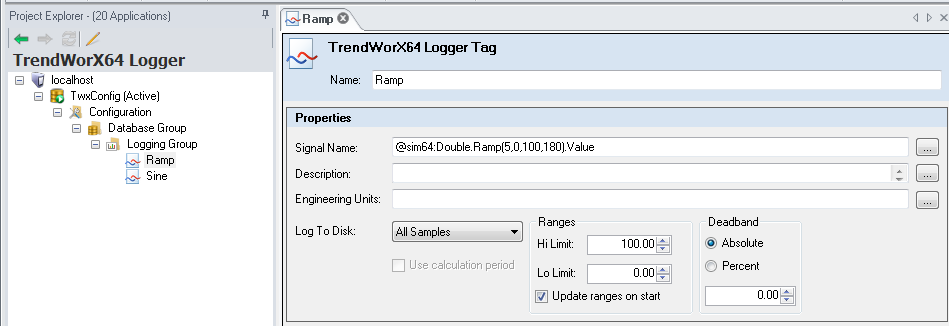
Open the TrendWorX64 Logger in the GENESIS64 Workbench and in Configuration mode configure or create a Database Group to configure the SQL server that you will use to store logged data for historical data analysis. GENESIS64 creates a default database, but you can change its configuration or substitute a different database, as required.
In the logger in configure mode, create or use a Logging Group and set the data collection properties such as data collection rate, start and stop times, triggers for logging collected data into a database, and table management features.
Continuing in the logger's Configuration mode, use or create the individual tags that will be logged in the Logging Group by adding Tag objects and assign them to a data source.
Click the Apply button in the TrendWorX64 Logger to enforce your selections. The logger begins collecting data using your settings.
Check the logger's ribbon to see that the logging Traffic Light icon has changed from red ![]() to green
to green![]() , which indicates that logging is taking place.
, which indicates that logging is taking place.
On the client side, you need to perform the following operations to create a trend display:
Open TrendWorX64 Viewer.
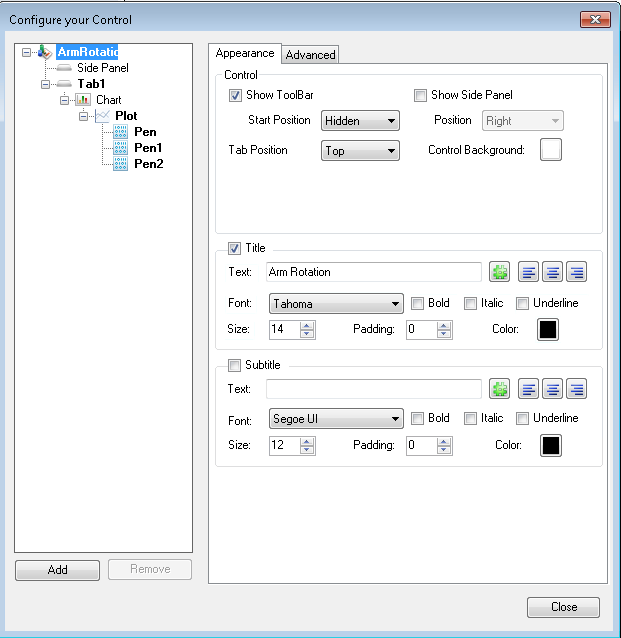
In the Configure group on the TrendWorX64 Viewer Configuration ribbon, click the configure viewer button. The TrendWorX64 Viewer configurator appears.
Add tabs, charts, plots, and pens to the viewer by following the guidelines in Working With Trends. A viewer can have any number of tabs, a tab can have any number of charts, and a chart can have any number of pens.
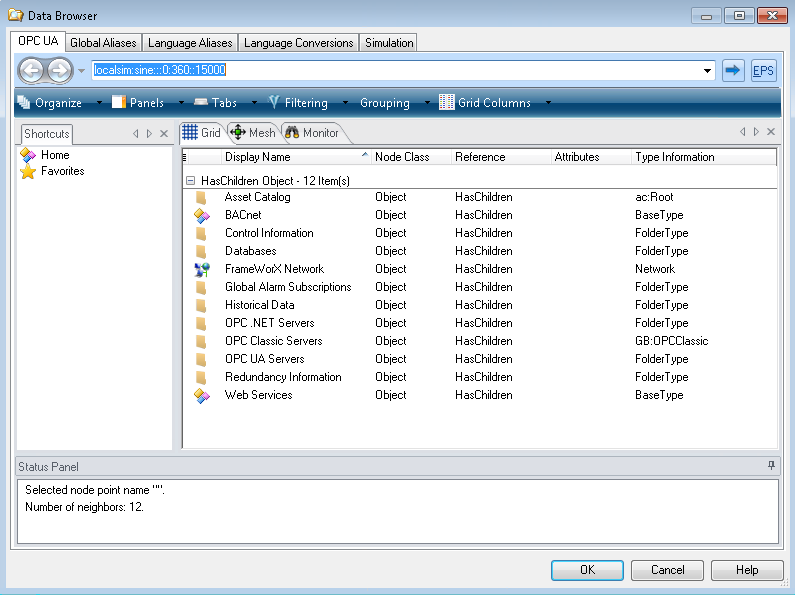
Set the data source for those pens in the Data Browser by following the guidelines in the General tab section of Pen Options for Trends. For historical data access set the pen's data source in the TrendWorX64 Viewer to an OPC UA HDA historical OPC data access server, or for real-time data access set the pen's data source in the TrendWorX64 Viewer to an OPC UA DA real-time OPC data source.
Click the OK button, then the Close button to enforce your selections, and click the Runtime button to view your trending data in the chart.
See also: