|
|
The features on this page require a GENESIS64 Advanced license and are not available with GENESIS64 Basic SCADA . |

![]()
|
|
The features on this page require a GENESIS64 Advanced license and are not available with GENESIS64 Basic SCADA . |
![]()
To open a trend display in the GENESIS64 Workbench :
Click the Home ribbon and click the New trend button in the TrendWorX64 group. This loads a TrendWorX64 Viewer into the Workbench with a tab called New Trend.
Click the File tab, then select Open.
Navigate to and select the project file that contains the trend file.
Click the OK button.
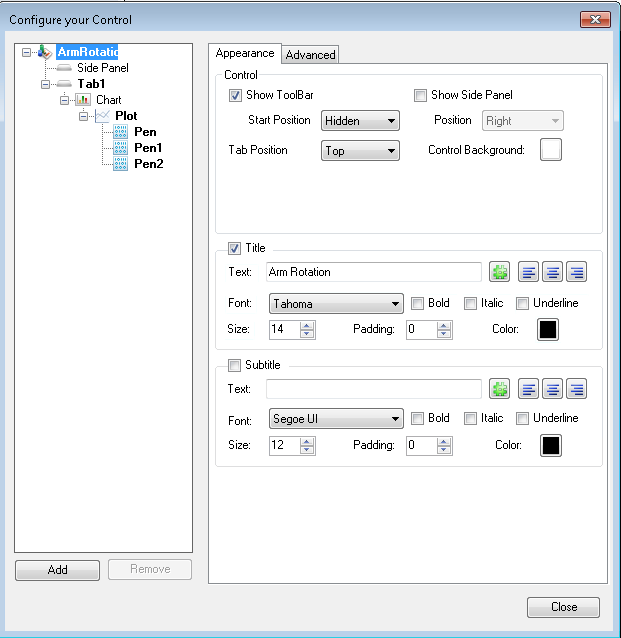
To create, connect (subscribe), modify, or configure trends you can either use the ribbon tab groups or the configurator in the configuration mode. Every command on the ribbon is duplicated in the configurator, so it is much more convenient to configure trends in that central location. In many GENESIS64 applications configurators are based on .NET Framework forms. In TrendWorX64 Viewer the configurator is a multi-tabbed dialog box with a tree control.
To open the configurator:
In the Workbench work area, select the trend's tab.
On the TrendWorX64 Viewer Configuration ribbon, click the Configure viewer button in the Configure group. The TrendWorX64 Viewer configurator appears.
TrendWorX64 automatically adds one side panel, one tab, and one chart to the viewer, which display on the left side of the configurator. You can add more side panels, tabs, and charts; and you can include plot objects such as pen groups and pens within charts. You can alter the display of the viewer, tab, chart, or plot objects; but only the pen objects define the connection to an OPC data source (called a subscription).
|
|
Warning. Not all TrendWorX64 features are supported in Microsoft Silverlight. If you are saving Silverlight files, refer to Silverlight Files in GENESIS64 for more information. |
The TrendWorX64 Viewer has an object hierarchy that is reflected in the configurator:
The TrendWorX64 Viewer can contain one or more tabs that have charts. It also contains a side panel that you can show or hide.
The Side Panel is a panel that optionally appear to the right of the tabs in the viewer. It can contain multiple trend charts that display high-level trends. A side panel already exists in the viewer; you cannot add more.
Tab objects are tabs that appear in the viewer; they can have multiple trend charts.
Chart objects are charts that contain one or more pens that are plotting trends.
Plot objects contain the basic design of the chart.
Pen objects display the data in the plot from the data source; the pen object contains the data source connector specifying the data path.
To design the Trend Viewer:
Click the TrendWorX Viewer at the top of the tree.
Use the Appearance and Advanced tabs to design it.
To add a tab to the Trend Viewer, then configure the tab:
Right-click the TrendWorX Viewer at the top of the tree.
Hold your cursor over Add, then select Tab. A tab containing one chart is added to the viewer.
To configure the tab, select the tab in the tree control, then use the Appearance and Advanced tabs to design it.
To add a chart object to a tab or to the side panel, then configure the chart:
In the tree, right-click the tab that will contain the chart or click the Side Panel object.
Hold your cursor over Add, then select Chart. A chart is added to the tab.
To configure the chart, refer to Chart Options for Trends.
To add a plot to a chart, then configure the plot:
In the tree, right-click the chart that will contain the plot.
Hold your cursor over Add, then select Plot. A plot is added to the chart.
To configure the plot, refer to Plot Options for Trend Charts.
To add a pen to a plot, then configure the pen:
In the tree, right-click the plot that will contain the pen.
Hold your cursor over Add, then select Pen. A pen is added to the chart.
To configure the pen, refer to Pen Options for Trends.
To add multiple pens to a plot at once, then configure each pen:
To configure the trend data source, do the following:
In the tree control, click the pen that will display the trend.
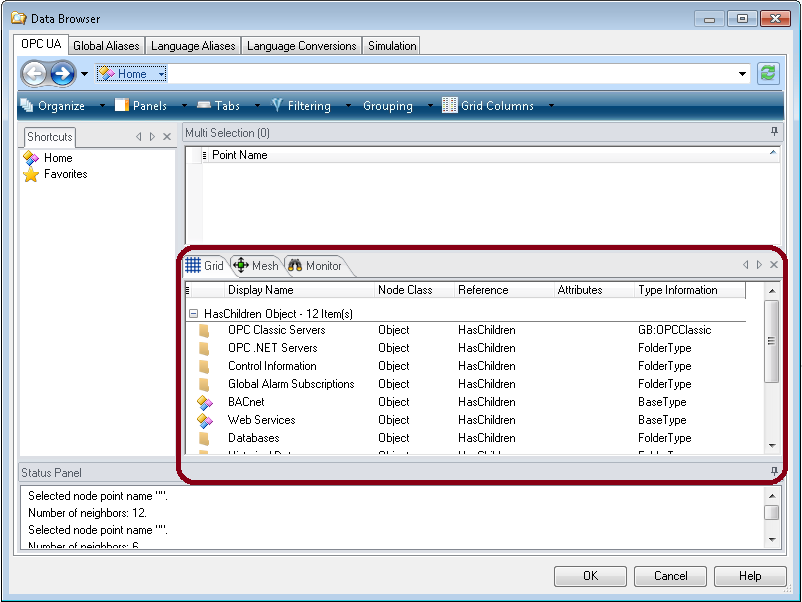
In the General tab, click the Data Source ellipsis button ![]() to open the Data Browser.
to open the Data Browser.
Using the Grid panel in the Data Browser, navigate to the OPC UA DA or OPC UA HDA trend server that you wish to connect to the pen.
|
|
Note: Historical data is OPC UA HDA data stored in a database for future replay. One source of historical data is the ICONICS TrendWorX64 Logger . Real time data is data being generated from OPC UA DA data sources and polled by the FrameWorX server . |
Select the trend server in the Grid panel, then click the OK button to connect the pen to its data source (this is called a point). The pen is added to the chart.
|
|
Tip: Paths to the OPC UA point can be defined using global aliases. For more information, refer to Global Aliasing. |
In order to view remote historical data sources you may need to supply the path to the server directly into the Unified Data Browser address bar of a client. The Unified Data Browser does not automatically browse and resolve historical data sources such as OPC UA and OPC-HDA.
|
|
Warning. Not all TrendWorX64 features are supported in Microsoft Silverlight. If you are saving Silverlight files, refer to Silverlight Files in GENESIS64 for more information. |
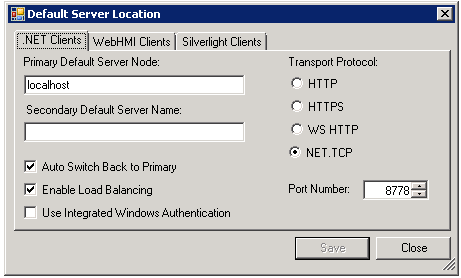
First check to see what current address is specified for your default FrameWorX64 server by doing the following:
Click Start > ICONICS > Tools > FrameWorX64 Server Location. The Default Server Location dialog box appears.
Note the address to the server so that you can modify it and enter the correct address into your client.
|
|
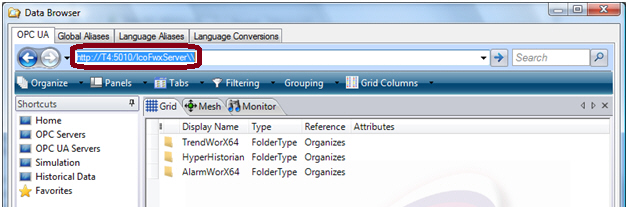
Note: The address is typically similar to the string:
http://<localhost>:5010/IcoFwxServer
and the modification you make is to substitute your server name in place of the <localhost>. |
To view a remote historical data source in TrendWorX64 Viewer , do the following:
Click the pen that will connect to the remote historical data source in the TrendWorX64 Viewer configuration dialog box.
In the General tab, click the Advanced configuration button to open the Advanced Configuration dialog box.
Click the Use HDA connection option if it is not already selected. Click OK to close the dialog box.
Click the Data Source ellipsis button ![]() to open the Data Browser.
to open the Data Browser.
In the address bar, enter the location of your default server in the following form:
http://<localhost>:5010/IcoFwxServer
where <localhost> is replaced by the actual server name or IP address.
Click the OK button to close the Data Browser, then click the Close button to exit the TrendWorX64 Viewer Configurator.
This procedure applies to setting a remote HDA Server in the TrendWorX64 Viewer or to setting the data source to logged Hyper Historian historical data.
See also:
TrendWorX64 Viewer Configurator