![]()
![]()
In GraphWorX64, selectors are dynamic actions that are applied to a group of objects so that different objects are displayed at different times based on the criteria you specify and the data values of the data source. Selectors offer discrete and analog animation. In discrete animation the object shown is based on the value of the data source being matched to one of a set or collection of states of states (for example, a StateField). To create this type of animation you would use the State Selector tool on the ribbon's Dynamics tab. Analog animation based on a variable data source is created with the Range Selection tool on the ribbon's Dynamics tab. The sections that follow describe these two different types of animation:
|
|
Note: For how to use selectors in a 3D viewport, refer to State Selector Animation in 3D and Range Selector 3D Animation in Discrete Mode. |
Discrete animation using the State selector provides a set of individual states under which each member or state is activated. The State selector provides the conditions that are used to select a state from the collection of state values. The easiest way to visualize a State Selector action is to consider a data source that can be toggled on and off. You could have a button that has Pick Action such that when you click the button a variable such as localsim::var1 changes from 0 to 1, and then back again on the next click. What a State Selector does is to associate a state that will be displayed based on that variable. States don't have to be Booleans, of course, they could be a fill level for a tank done in steps of 20%. To demonstrate that you would need a Toggle Pick Action with 5 steps of 1. The procedure is outline below.
To Create a Discrete Animation with the State Selector:
Click the Button tool and create a button; then set the DataSource to localsim::var1.
Set the Command for the Pick Action to Toggle Value; then click the More Values property and create a collection of integer values ranging from 0 to 5.
Click the Process Point tool and create a PPT with the DataSource set to localsimvar1. This is done to see the values at runtime.
Create bars with a heights of 1, 2, 3, 4, and 5; then group each set into single groups as shown in the figure below.
The Five Different Levels or States

Select the five different level groups, then click the States button in the Selectors tab group of the Dynamics ribbon.
Selectors Tab Group in the Dynamics Ribbon
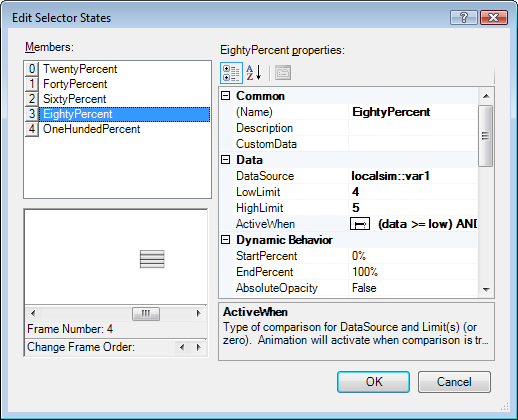
Set the State Selector dynamic's DataSource property to localsim:var1; then click the States property to open the Edit Selector States dialog box as shown in the figure below.
Set the five steps to have the following LowLimit and HighLimit properties : For Step 1, LowLimit 1, HighLimit, 2; for Step 2, LowLimit 2, HighLimit, 3; for Step 3, LowLimit 3, HighLimit, 4; for Step 4, LowLimit 4, HighLimit, 5; and for Step 5, LowLimit 5, HighLimit, 5.
Set Steps 1 -4 to be ActiveWhen to (data>=low) AND (data <high); and for Step 5 to (data>=low) and (data<=high). The figure below shows the fourth step's definition.
The Edit Selector States for the Fourth Step
Move all of the groups so that they share a common bottom and left border; then go into runtime.
Click the Button to change the values you see in the PPT; the levels represented by the bar graph change to indicate the different states based on the variable, as shown in the figure below.
The Bars Step Level Animation at Runtime

Another perhaps more convenient method for showing levels is to use a Size Pick Action where a change in the DataSource changes the value of the shape's size. That's the way that cut-away level indicators for tanks and other objects are normally animated.
A traffic light is a perfect example of discrete animation. In a traffic light, or semaphore, there are three separate lights: usually red, yellow, and green (although this is culture-dependent) and you want the light to change from red to yellow to green and then cycle back from green to yellow to red. Most of the time is spent in the red and green states, with yellow providing a somewhat briefer interval during which yellow provides a caution that the light is about to change. If your data source is a ramp function that goes lineally from 0 to 100 and then from 100 to 0, you could simulate the lighting pattern that you might want a traffic light to have, as follows:
Red State. When the data source has a value from 0 - 40 the top light is red and the other two lights are greyed out.
Yellow State. When the data source has a value from 40 - 60 the middle light is yellow and the other two lights are greyed out.
Green State. When the data source has a value from 60 to 100 the bottom light is green and the other two lights are greyed out.
There are numerous ways that you could turn the lights to grey:
You could define a fill color when the circle is disabled
You could create a grey circle that is below the colored circle and hide the colored circle when it isn't active
You could create three different traffic light each of which has a separate state
Or, use other methods that will work equally as well. The last method of three separate traffic lights each with a single state is perhaps the easiest to visualize, so that's the one that is described below.
Discrete animation using the State Selector provides a set of conditions under which each member or state is activated. The State Selector provides the conditions that are used to select a state from the collection of state values.
To Create an Automated Traffic Light Using the State Selector:
Create the traffic light state by creating three circles and group them, enclosing the group in a rectangle to help visualize the traffic light better.
Duplicate the traffic light twice to create three traffic lights, then change the color of the bottom circle in the first light symbol to green, the color of the middle circle in the second light to yellow, and the top circle of the third light symbol to red.
You have just defined the three separate states used by the State Selector, and should have a display that looks something like the figure below.
Traffic Light States

Select the three lights then click on the State button in the Selectors tab group in the Dynamics ribbon, as shown below.
The State Selector dynamic appears in the Dynamics pane.
Selectors Tab Group in the Dynamics Ribbon
Set the DataSource property to localsim::triangle as that simulator not only ramps up lineally, but ramps down lineally as well.
The State Selector Dynamics Pane

|
|
Note: If the DataSource is the same for all states then you can set it at the top level and it will be applied to all three; if you want to set a separate DataSource for any of the states, do so at the state level. |
Click the States property and in the Edit Selector States set the following properties for the three states:
Red: LowLimit, 0; HighLimit, 40; ActiveWhen, (data>low) AND (data<=high)
Yellow: LowLimit, 40; HighLimit, 60; ActiveWhen, (data>=low) AND (data<=high)
Green: LowLimit, 60; HighLimit, 100; ActiveWhen, (data>low) AND (data<=high)
The figure below shows the green state and its definition in the Edit Selector States dialog box.
The Definition of the Green State

Move the three traffic lights so that they appear one on top of the other.
Click the Process Point button and click to add a process point to the design surface; then set the DataSource of the PPT to localsim::triangle.
Click the Runtime button to observe the changing traffic light, as well as the numerical values of the simulator, as shown below.
The Traffic Light and Simulator Process Point at Runtime

While you can use the State Selector to animate a set of states based on range values, a more general and powerful method involves the use of the Range Selector tool. The Range Selector has both a Discrete and Analog Animation Mode setting. Let's take a brief look at how the Range Selector tool is applied to the traffic light problem that you just saw using the Analog Selector mode.
To Create an Analog Animator Using the Range Selector:
Define three traffic light states as was done in the previous section: red, yellow, and green lights each in their own group
Select them and define a Range Selector dynamic by clicking the Selectors tab group in the Dynamics ribbon.
Set Range Selector dynamic DataSouce to localsim::triangle, the AnimationMode to Analog Selector, but leave the ActiveWhen property at its default setting of Always.
Click the FrameDistribution property to open the Edit Frame Distribution dialog box shown in the figure below.
Select each frame for the animation and move the sliders to set the red, yellow, and green properties as follows: red, 0% to 40%; yellow, 40% to 60%; and green 60% to 100%; then click the OK button.
Edit Frame Distribution

Click the Runtime button and observe your traffic light.
The procedure above yields the same result that you saw for the State Selector, and if you had the two sets of traffic lights one next to the other you would see that both are synchronized. The Analog Selector smoothly changes from one state to another and yields much better animation for animation with smaller increments. The State Selector is essentially a switch, changing from state to state.
Although the Range Selector was set up to provide a state based assignment with a variable interval, many animation effects are based on a single time interval after which the next frame in the animation is displayed. You would create a single interval animation effect by setting the following Range Selector dynamic properties:
DataSource set to 1 (always true)
ActiveWhen set to data!=0.
AnimationMode set to Discrete Animator
FrameDistribution set to the values each frame is displayed; in the previous example you would use 0.4 0.2 0.4 as the value entered into this property.
Duration set to the number of milliseconds for the cycle
Repeat count set to the number of cycles, or infinite to repeat the entire loop.
When you go into runtime with these settings you would see the traffic light cycle every duration period with each frame appearing for the frame distribution you set. The data source is always on, but the duration interval triggers the appearance of each successive frame.
The figure below shows the settings for the Discrete Animator AnimationMode of the Range Selector.
Discrete Animator Animation Mode of the Range Selector
See also: