![]()
![]()
With the State selector, you define a set of individual states for a group of objects, and specify the object that is activated for each state. The State selector provides the conditions that are used to select a state from the collection of state values.
The easiest way to visualize a State selector action is to consider a data source that a runtime user can toggle on and off. To configure a display that lets a runtime user do this, you can create a button that has Pick Action so that when the user clicks the button a variable (such as localsim::var1) changes from 0 to 1, and then back to 0 again on the next click. The State Selector associates a state that will be displayed based on that variable. States don't have to be Boolean, of course—you might use a state for a fill level for a tank, which is filled in 5 steps of 20% for each step. To demonstrate that, you would need a Toggle Pick Action with 5 steps of 1.
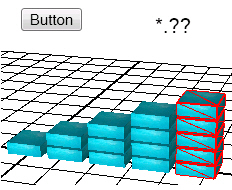
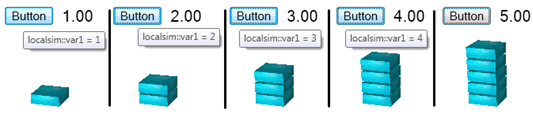
The example below uses a State Selector to animate five states that depict the fill level of a tank. It uses a button to let you simulate the animation in runtime, but you can replace the data source with your own data source that comes from an OPC tag that sets a state value.
|
|
Note: This topic describes State and Range selector use in 3D displays in GraphWorX64. For information that is specific to 2D displays, refer to Selectors and Animation. |
For this example you will create a toggle button:
First create a toggle button. Go to the 2D space. Click the Button tool on the 2D Dynamics ribbon, then draw a button in the display. While the button is still selected, click the Data Source button and set the button’s data source to localsim::var1—to do this, go to the Data Browser’s Simulation tab, and type var1 into the Name field and click OK.
The button has a Pick action dynamic. Go to the Dynamic pane and set the Pick action dynamic’s Command property to Toggle Value; then go to the MoreValues property and click the ellipsis button ![]() . This opens the Edit Toggle Values dialog box. Create a collection of integer values from 1 to 5, putting one value on each line.
. This opens the Edit Toggle Values dialog box. Create a collection of integer values from 1 to 5, putting one value on each line.
Click OK to close the dialog box.
Next, add a process point so you can see the values of localsim::var1 at runtime. If you don’t know how to do this, follow these steps: In either the 2D space or the 3D viewport, click the Process Point button on the Dynamics ribbon. This creates a process point and opens the Data Browser dialog box where you will set the process point’s data source to localsim::var1—to do this, go to the Data Browser’s Simulation tab, and type var1 into the Name field and click OK.
|
|
Note: So far you have only created tools that will help during runtime that do not have anything to do with animating objects using a State Selector. Next you will create the objects we want to animate. |
Create the objects that will swap in and out of the display depending on the state. To do this, create stacks of boxes consisting of 1, 2, 3, 4, and 5 cube primitives. Once you have created five stacks, group the cubes in each stack so that you have five groups (or, to be more exact, one single cube and four groups). Example.
Now you are ready to create a State Selector dynamic.
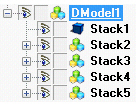
Select the five different groups, then click the State icon in the Selectors section of the Dynamics ribbon. This groups the five stacks into a dynamic model called DModeln in the Explorer. It also adds a State Selector dynamic for the Dmodel group; to access the State Selector dynamic, select the Dmodel in the Explorer, then go to the Dynamics pane.
On the Dynamics pane, go to the State Selector dynamic's DataSource property and click the ellipsis button ![]() , which opens the Data Browser. Go to the Simulation tab and select localsim:var1 from the list on the left, and click OK to close the Data Browser.
, which opens the Data Browser. Go to the Simulation tab and select localsim:var1 from the list on the left, and click OK to close the Data Browser.
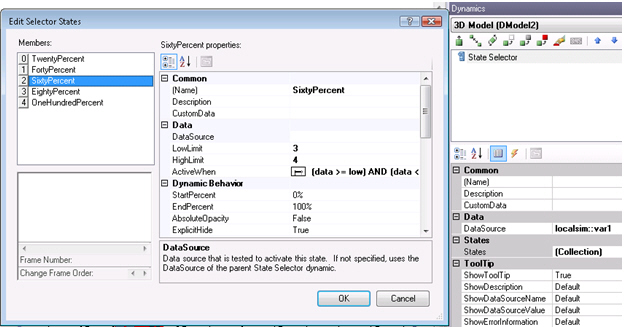
Click the States property’s ellipsis button to open the Edit Selector States dialog box. Each member in the Members column is one stack.
Set the ActiveWhen property:
Set Stacks 1 through 4 to (data>=low) AND (data <high)
Set Stack 5 to (data>=low) AND (data<=high)
Set the LowLimit and HighLimit properties for the stacks like so:
Stack 1 – set the LowLimit to 1, set the HighLimit to 2
Stack 2 – set the LowLimit to 2, set the HighLimit to 3
Stack 3 – set the LowLimit to 3, set the HighLimit to 4
Stack 4 – set the LowLimit to 4, set the HighLimit to 5
Stack 5 – set the LowLimit to 5, set the HighLimit to 5
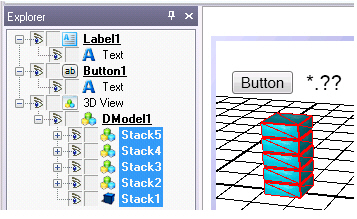
Align the five stacks so that they all occupy the same 3D space. Note, also, that the sequence of the stacks in the Explorer is important.
Click the Runtime button to go into runtime mode.
In Runtime mode, click the Button to change the values displayed in the process point; the stacks change to indicate the different states based on the variable. Note that the fly over text reveals the data source and its value.
If you were to replace the State Selector’s data source with an OPC tag for a sensor that registers the values 1 through 5, the display would provide a dynamic, graphical display of the sensor’s value at all times. The blocks in the stacks could be different colors, you can add more of them, you might make them smaller, or “insert” them into a container or on a dashboard. Their use is limited only by your own imagination.
See also: