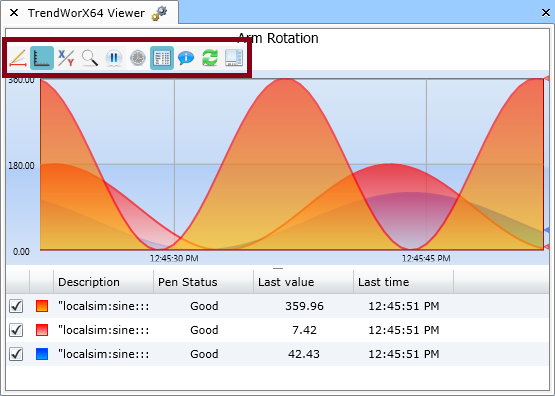
You can customize the display of a TrendWorX64 Viewer control within PortalWorX-SL using the runtime toolbar, which is illustrated below. You can access this toolbar by double-clicking within a chart that shows trending data.
The Runtime Toolbar as it Appears within the TrendWorX64 Silverlight Web Part

The options that you can access on runtime toolbar appear in the table below:
|
Button Image |
Button Name |
Button Action |
| Edit Trend Period and Rates | Opens the Edit Trend Period and Rates configurator, which allows you to adjust the time format and interval for the chart as well as the frequencies for collecting and displaying data. | |
| Show/Hide Axes | Displays or hides the axes along the sides of the trend display. | |
| Swap Y/X Axes | Inverts the axes on the trend display (if the data values appeared on the y-axis originally, they would now appear on the x-axis). | |
| Enter/Exit Zoom Mode | Activates or deactivates Zoom Mode, which allows you to zoom in on a particular region of the trend display. | |
| Freeze/Unfreeze Trend | Activates or deactivates Freeze Mode, which causes the trend display to stop refreshing. | |
| Previous Trend Page/Next Trend Page | Move either back or forward in time on the trend display at an interval equal to the current trend period. This pair of buttons is visible only in Freeze Mode. | |
| Set Right Time | Opens the Navigate trend configurator, which allows you to set a time and date for each side of the trend display. This button is active only in Freeze Mode. | |
| Show/Hide Legend | Displays or hides the legend that appears underneath the trend display. | |
| Show/Hide operator comments | Displays or hides operator comments within the trend display. This option is meaningful only if you have enabled operator comments for the data being displayed. | |
| Refresh Data | Forces the trend display to re-draw the collected data. | |
| Show/hide the Side Panel | Displays or hides a side panel to the right of the trend display. |
The Edit Trend Period and Rates configurator allows you to adjust the trend interval and presentation as well as the data collection and display refresh rates. You can open the configurator by clicking the Edit Trend Period and Rates button ![]() on the Runtime toolbar.
on the Runtime toolbar.
You can adjust the following options in the configurator:
|
|
Note: All historical clients and reporting tools will always retrieve historical data in their local (non-UTC) time.
|
|
|
Note: The time axis of the chart (usually the x-axis) must show either the time or date at all times.
|
|
|
Note: To force an immediate refresh of the data whenever needed, click the Refresh Data button
|
Click the Close button ![]() in the top-right corner of the configurator to close the window and return to the main PortalWorX-SL window.
in the top-right corner of the configurator to close the window and return to the main PortalWorX-SL window.
Zoom Mode allows you to examine a particular region of the trend display more closely, perhaps to view a particularly subtle or sensitive change in the trending data. You can enter this mode by clicking the Enter/Exit Zoom Mode button ![]() on the Runtime toolbar.
on the Runtime toolbar.
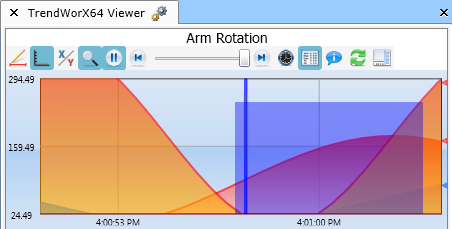
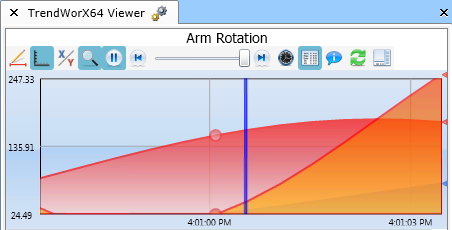
Once in zoom mode, click and drag over the area of the chart that you want to appear on the display once the zoom-in process is complete. The selected region will then fill the entire display. An example of this process appears below:
Selecting a Region while in Zoom Mode
 |
 |
 |
To exit Zoom Mode, click the Enter/Exit Zoom Mode button ![]() on the Runtime toolbar again, or right-click the trend display and select Reset Zoom.
on the Runtime toolbar again, or right-click the trend display and select Reset Zoom.
To enter Freeze Mode, click the Freeze/Unfreeze Trend button ![]() on the Runtime toolbar. Freeze Mode stops the data refresh animation within the trend display. While in this mode, the TrendWorX64 Viewer control is still collecting data, but the trend display does not show this new data.
on the Runtime toolbar. Freeze Mode stops the data refresh animation within the trend display. While in this mode, the TrendWorX64 Viewer control is still collecting data, but the trend display does not show this new data.
After entering Freeze Mode, you will notice that the Runtime toolbar changes slightly. There is also a cursor that appears near the center of the trend display. You can click and drag this cursor on the chart to inspect the values of the chart's pens (graphs) at different instants of time.
To view data from a different time on the chart while in Freeze Mode, complete one of the following actions:
Finally, there is a summary pane that appears beneath the chart while in Freeze Mode. This pane allows you to view the trend over a larger trend period and navigate across large intervals of time quickly.
To exit Freeze Mode, click the Freeze/Unfreeze Trend button ![]() on the Runtime toolbar again.
on the Runtime toolbar again.
If you would like to set a specific trend period or a specific time and date for the left and right edges of the trend display, you can use the Navigate trend configurator, which appears below. You can open the configurator by clicking the Set Right Time button ![]() on the Runtime toolbar while in Freeze Mode.
on the Runtime toolbar while in Freeze Mode.
Adjusting the Time Interval on the Trend Display using the Navigate trend Configurator
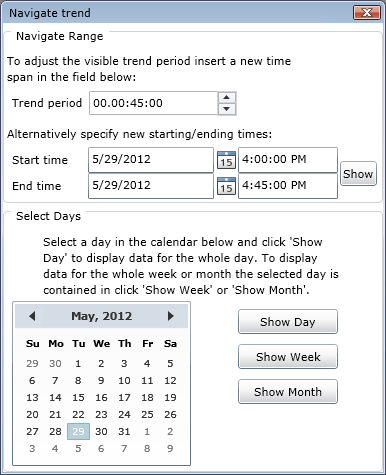
You can adjust the following options in the configurator:
|
|
Note: Click the Show button to force the chart to refresh the display to show the specified trend period or start and end times.
|
Click the Close button ![]() in the top-right corner of the configurator to close the window and return to the main PortalWorX-SL window.
in the top-right corner of the configurator to close the window and return to the main PortalWorX-SL window.
When you enter Freeze Mode, a smaller chart called the summary pane should appear beneath the main trend display. If the summary pane does not appear when you enter Freeze Mode, click the small arrow beneath the chart on the right side of the display.
Adjusting the Height of the Summary Pane and the Trend Period Visible in the Main Trend Display
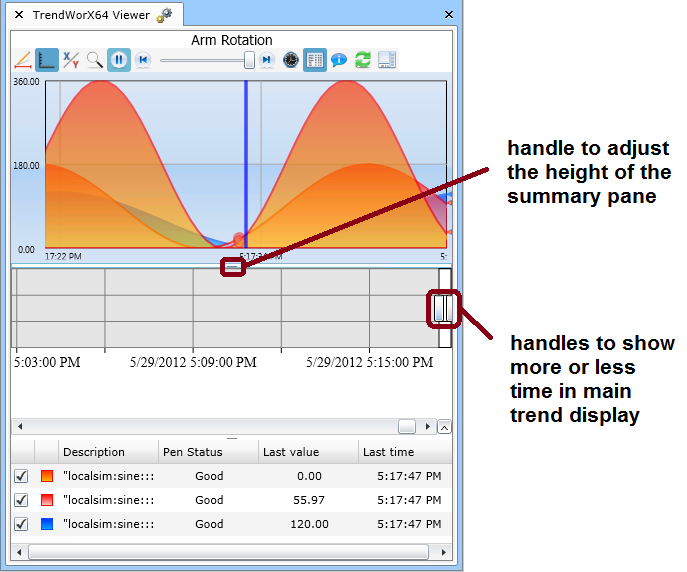
The summary pane displays trend data in a smaller graph that generally includes a larger time interval than the one in the main trend display. The portion of this time interval that appears in the main trend display appears as a white box inside of the summary pane chart. The summary pane is useful for navigating across large periods of time quickly, allowing you to view trend data at a significantly different time interval than the one that currently appears in the main trend display.
When you move the cursor into the summary pane, handles will appear on either side of the white box inside of the pane, as shown in the figure above. You can click and drag these handles to adjust the trend period that appears in the main trend display.
You can also adjust the height of the summary pane itself by clicking and dragging the handle in top-center of the pane, as shown in the figure above.
To hide the summary pane, either click the small arrow in the bottom-right corner of the pane, or click the Freeze/Unfreeze Trend button ![]() on the Runtime toolbar to exit Freeze Mode.
on the Runtime toolbar to exit Freeze Mode.
See also:
TrendWorX64 Silverlight Web Part