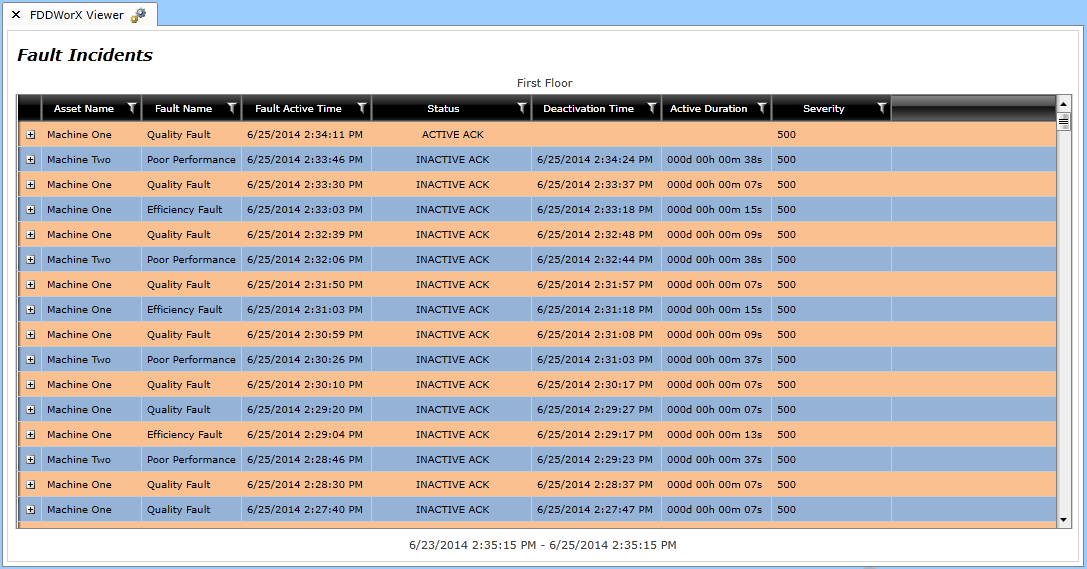
The Runtime mode of the Fault Incidents View, an example of which is shown below, allows users to see the results of their Fault Incidents View Configuration.
Fault Incidents View in Runtime in PortalWorX-SL

Configuration of the Fault Incidents View is explained in more detail in Add Fault Incident View.
There are a number of options available to users once the Fault Incidents View is in Runtime mode, including:
Filtering the Fault Incidents Data
If you have selected to 'Override Selected Asset' and 'Show Runtime Panel' in the General Tab of the Fault Incidents View configuration, once you place the viewer into Runtime mode, you will see the name of the displayed asset level at the top of the window, as shown below.
Highlighted Selected Asset Level Button

Clicking the name of the selected asset level activates an Asset pulldown menu above it, as shown above, allowing you to select an alternative asset's fault incidents to view (if configured to do so). The chart will then update to show the now currently selected asset.
If you have selected to 'Override Inherited Time Range' and 'Show Runtime Panel' in the General Tab of the Fault Incidents View configuration, once you place the viewer in to Runtime mode, you will see the currently selected time range displayed at the bottom of the window, as shown below.
Highlighted Selected Time Range Button

Clicking the currently shown time range activates Start and End range fields, as shown above. The Start and End pulldown menus allow to select from Now, Inherited, Relative to End, Preset and Custom. Each choice then provides additional contextual options for setting a time range. Once you have completed making changes in this section, click on the Apply/Update Time Range button. Clicking the date range button again collapses this section.
You can sort the Fault Incidents by clicking on your selected column header, as shown below.
Sorting the Fault Incidents by the Status Column

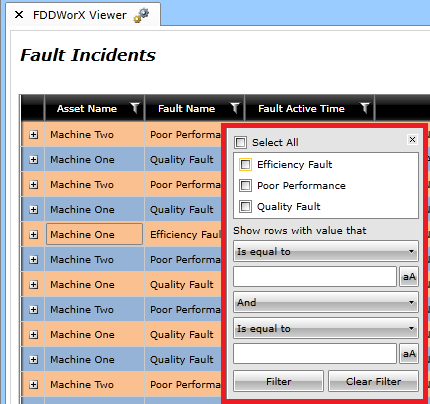
Clicking on the Filter button next to a column header name [ ] brings up the filtering window, shown below, which allows you to filter the Fault Incidents by your selected criteria. The options are listed based on the context of the selected column. Click the Filter button to proceed or the Clear Filter button to re-set your filtering criteria. Click on the [x] button to close the filtering window. The Fault Incidents will now be filtered according to your settings.
Filtering by Fault Name
Right-clicking the Fault Incidents, either individually or as a continuous group (while holding the Shift key) or specifically grouped (by holding the Ctrl key), brings up a number of options, as shown below.
Fault Incidents View Right-click Options

These options include:
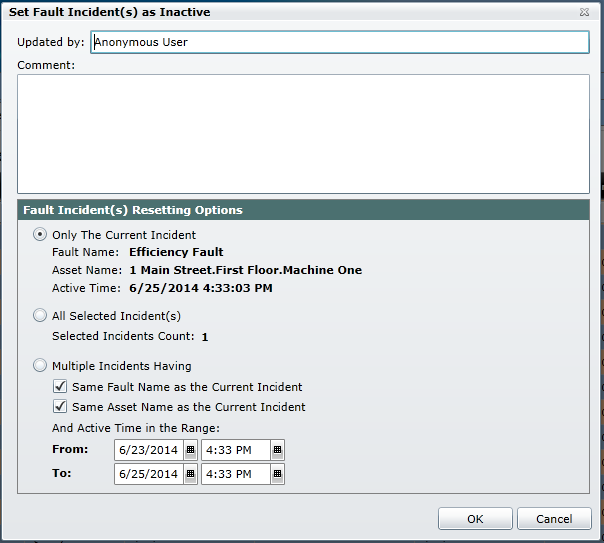
Set Incident as Inactive... - This can only be performed on those items with ACTIVE ACK status. Clicking on this option brings up the Set Fault Incident(s) as Inactive window, as shown below. You can enter the user name in the Updated by: text entry field, as well as additional text about the fault incident in the Comment: field. You can also select, by clicking the appropriate radio button, which Fault Incident(s) Resetting Option you would like to use, including: Only the Current Incident [where the current information is displayed for you to confirm], All Selected Incident(s) [where you can see the Selected Incidents Count] or Multiple Incidents [where you can make selections based on similarity of Fault Name or Asset Name, as well as the Active Time in the Range, using the From: and To: fields]). Click OK to save your settings and return to the Fault Incidents View.
Set Fault Incident(s) as Inactive Window
Acknowledge Incident... - This can only be performed on unacknowledged items. Clicking on this option acknowledges the selected Fault Incidents.
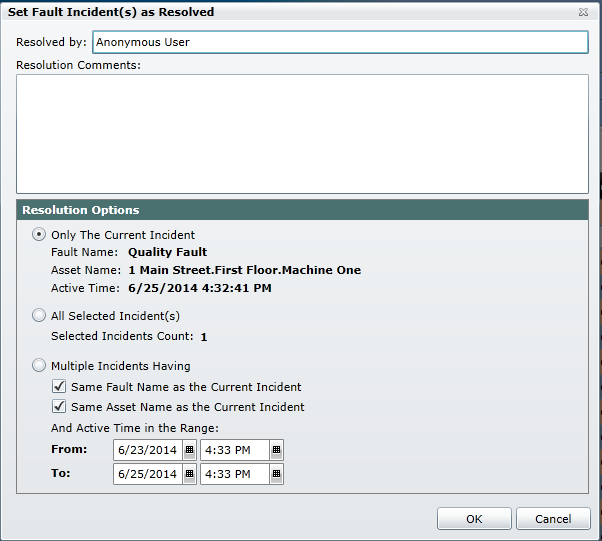
Set Incident as Resolved... - This can only be performed on unresolved items. Clicking on this option brings up the Set Fault Incident(s) as Resolved window, as shown below. You can enter the user name in the Resolved by: text entry field, as well as additional text about the fault incident in the Resolution Comments: field. You can also select, by clicking the appropriate radio button, which Resolution Option you would like to use, including: Only the Current Incident [where the current information is displayed for you to confirm], All Selected Incident(s) [where you can see the Selected Incidents Count] or Multiple Incidents [where you can make selections based on similarity of Fault Name or Asset Name, as well as the Active Time in the Range, using the From: and To: fields]). Click OK to save your settings and return to the Fault Incidents View.
Set Fault Incident(s) as Resolved Window
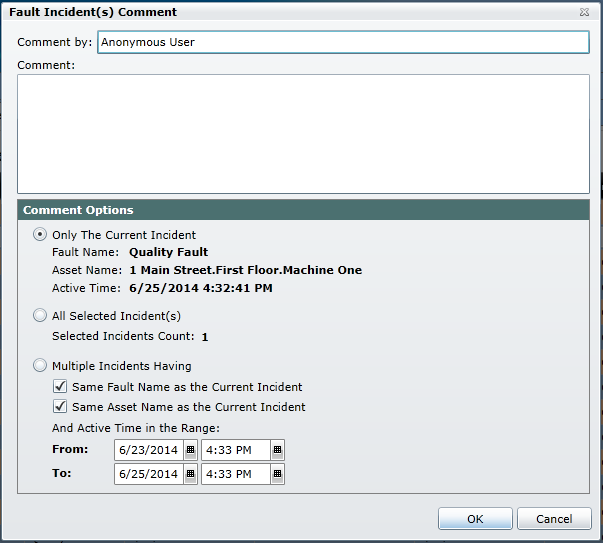
Add Comment... - Clicking on this option brings up the Fault Incident(s) Comment window, as shown below. You can enter the user name in the Comment by: text entry field, as well as additional text about the fault incident in the Comment: field. You can also select, by clicking the appropriate radio button, which Comment Option you would like to use, including: Only the Current Incident [where the current information is displayed for you to confirm], All Selected Incident(s) [where you can see the Selected Incidents Count] or Multiple Incidents [where you can make selections based on similarity of Fault Name or Asset Name, as well as the Active Time in the Range, using the From: and To: fields]). Click OK to save your settings and return to the Fault Incidents View.
Fault Incident(s) Comment Window
Clicking the plus sign button [+], shown below, expands your selected Fault Incident, allowing you options similar to the Right-Click Options.
Highlighted Plus Sign Button for an Unexpanded Fault Incident

Once you have clicked on the plus sign button [+], you'll notice the expanded Fault Incident contains three tabs: General, Comments and Diagnostic.
Expanded Fault Incident (Active Ack) - General Tab

The General Tab contains the status of the selected Fault Incident. In the example above, the item is Active, Acknowledge and Unresolved. The Active Time is also listed. Contrast the above screen capture with the one below, showing an Inactive Ack Fault Incident, where the General Tab lists it as Inactive, Acknowledged and Unresolved. The Inactive Fault Incident also shows the Deactivation Time and the Active State Duration.
Expanded Fault Incident (Inactive Ack) - General Tab

Depending on the status of the expanded fault incident, you will also see buttons to take further action, if necessary. For instance, the top incident can be Deactivated and Resolved. The bottom incident can only be Resolved. These options are the same as those listed under Right-Click Options.
Expanded Fault Incident - Comments Tab
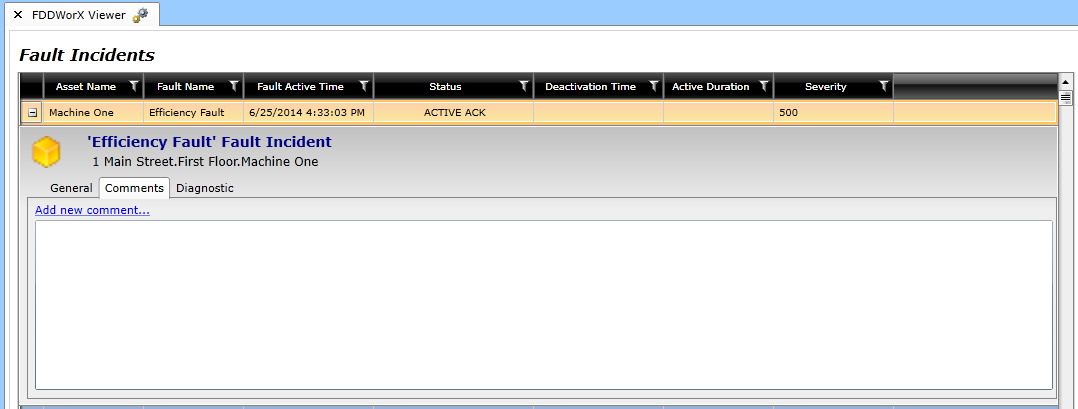
The Comments tab allows you to click on the 'Add new comment...' text, which opens the Fault Incident(s) Comment window, as shown below. You can enter the user name in the Comment by: text entry field, as well as additional text about the fault incident in the Comment: field. You can also select, by clicking the appropriate radio button, which Comment Option you would like to use, including: Only the Current Incident [where the current information is displayed for you to confirm], All Selected Incident(s) [where you can see the Selected Incidents Count] or Multiple Incidents [where you can make selections based on similarity of Fault Name or Asset Name, as well as the Active Time in the Range, using the From: and To: fields]). Click OK to save your settings and return to the Fault Incidents View. Once added, the Comment will appear in the Comments Tab's text field (along with the user name and date/time of the comment).
Fault Incident(s) Comment Window

The Diagnosis Tab provides "at a glance" information related to the probable causes of the selected fault incident, as shown below.
Expanded Fault Incident - Diagnostic Tab
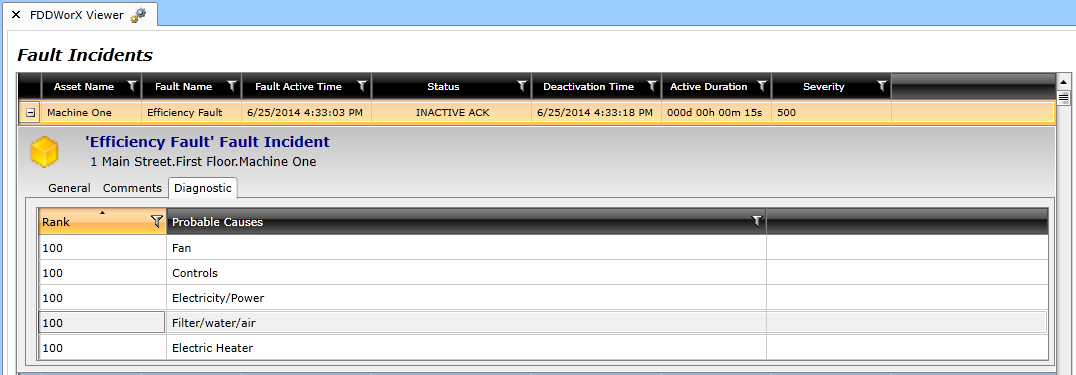
The Diagnosis Tab allows you to sort by column header (for instance, the example above would allow you to sort by Rank or Probably Causes). You can also filter items, by criteria that is contextual to your selected column, by clicking the Filter button [ ].
].
See Also: