The FDDWorX Viewer is a Silverlight control that is used to visualize the data collected by the FDDWorX server, including Faults, Fault Summaries, Asset Summaries and Diagnostic causes. There is a FDDWorX Viewer that can be used within PortalWorX-SL and a similar Web Part that can be used in PortalWorX SP (utilizing SharePoint).
In this Quick Start, we will configure a FDDWorX viewer to display a grid with faults. We will add a Row Detail to the grid so that when we expand the fault, we can display more information including a list of causes, a chart showing the current week’s distribution of faults, and asset details.
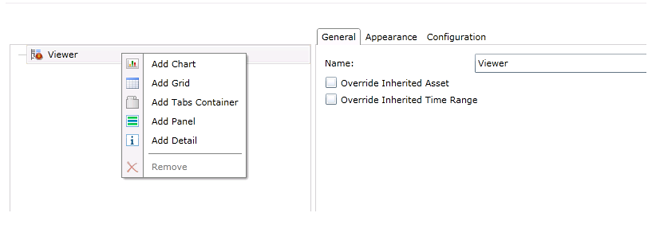
In your FDDWorX Viewer, right-click on "Viewer" and select "Add Grid", as shown below.
Figure 1 – Adding a Grid
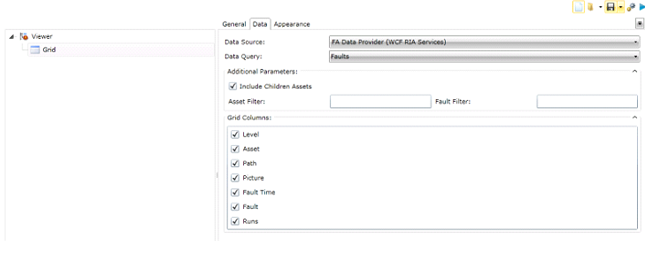
Click your Grid in the tree and select the Data tab. Select "Faults" from the Data Query drop down menu
Figure 2 – Data tab for Grid
Right-click the Grid in the tree and select "Add Row Detail". This will allow you to expand a row in your grid to retrieve more information.
Next, right-click the new Row Detail and select "Add Panel".
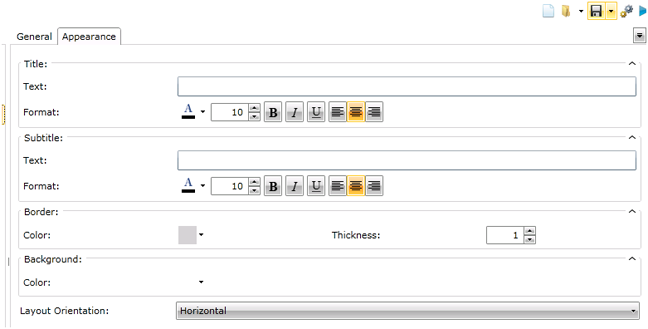
Click the Panel in the tree and make sure that the Layout Orientation specified on the Appearance tab is "Horizontal". This will ensure that if you add multiple features to this panel, they will be displayed side-by-side. If you prefer that features added to the panel be displayed top-to-bottom, you can select "Vertical" orientation.
Figure 3 – Panel Appearance Tab
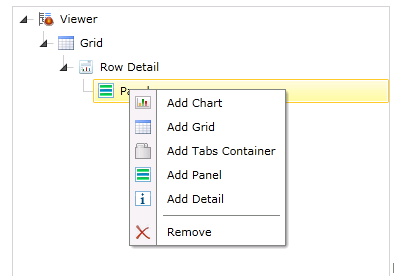
Right-click on the new Panel and select "Add Tabs Container".
Figure 4 – Adding a Tabs Container
Right-click on the new Tabs Container and select "Add Tab".
Select the tab in the tree. On the Appearance Tab, enter “Distribution” for the Title text.
Right-click the Tab and select "Add Chart". Select a Bar chart for Chart Type.
Next, right-click the chart and select "Add Series".
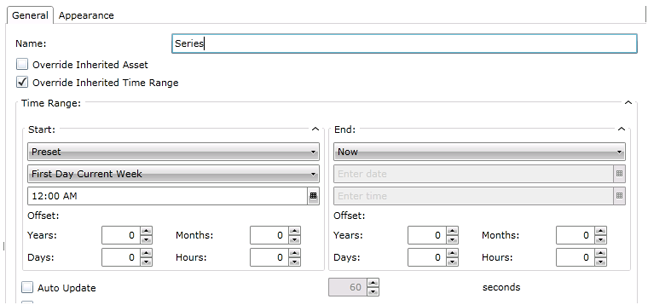
Click on the series in the tree. For this series, we will only want to look at the faults that have occurred this week, so first, check the Override Inherited Time Range check box. In the Start section, change the start to "Preset" and "First Day of Current Week".
Figure 5 – Overriding the Time Range
On the Data tab, select "Distribution by asset" for the Data Query. Select "Day" as the Interval Type in the Additional Parameters section.
Check the "Format" check box and change the Format to MMM-dd.
Next, try creating another Tab for inclusion in the Tab Container. Name it “Causes” and add a Grid to it that uses the latest Causes data query.
Next, we will add an Asset Detail to our panel to be shown next to our Tabs Container. Right-click on "Panel" and select "Add Asset Detail".
Select the Asset Detail in the tree and on the Data tab, choose the "Summary by asset Data" Query.
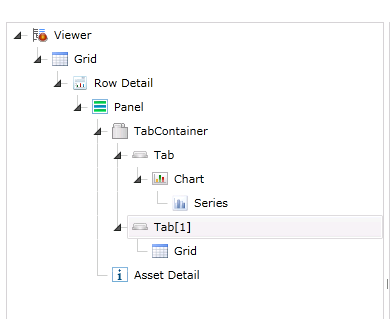
When you are finished, your tree should look similar to the one in the figure below
Figure 6 – Final Configuration
Make sure to click the "Save" button at the top of the viewer to save this configuration. Clicking the blue play button at the top right of the viewer will switch the viewer to Runtime mode. You won’t see any results there now because the viewer is configured to use an Inherited Asset. This means the asset that is passed to the queries in the viewer is determined when you select an asset in the tree that has a Load FDDWorX Data command that was defined for it in the the Workbench. (For more information, refer to the discussions for Setting up Commands for Runtime Navigation and Commands in the the Workbench help.)
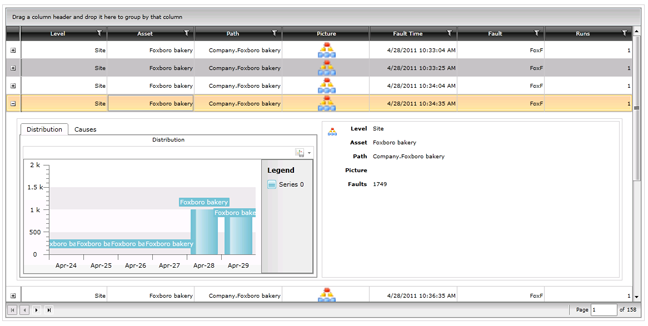
To verify that your configuration is working correctly, you can click the Viewer in the tree and check the "Override Inherited Asset" check box and select some specific asset for which faults have occurred. If you switch to runtime, you will see a grid of these faults. If you click the plus sign [+] at the beginning of any row, you will see the panel that we defined.
Figure 7 – FDDWorX in Runtime Mode
See Also
Adding an FDDWorX Viewer in PortalWorX-SL
Adding the FDDWorX Web Part in SharePoint 2010