This topic describes how to display historical trends:
TrendWorX64 Viewer can display historical trends on charts and graphs and is standard on the Hyper Historian installation disk. The following example requires you to run both TrendWorX64 Logger and Hyper Historian in the GENESIS64 Workbench .
A Trend within TrendWorX64
Click the bottom right carat/arrow in the left-side navigation pane, then Add or Remove Buttons, then TrendWorX64 to load into the Workbench. The small Hyper Historian logo will appear on the bottom-left side of the navigation pane.
While in TrendWorX64, click the upper left button marked Configure. In the navigation pane, expand the Viewer, then the tab. Then select the chart and click Add to add a new pen to the chart.
Pen Configuration within TrendWorX64
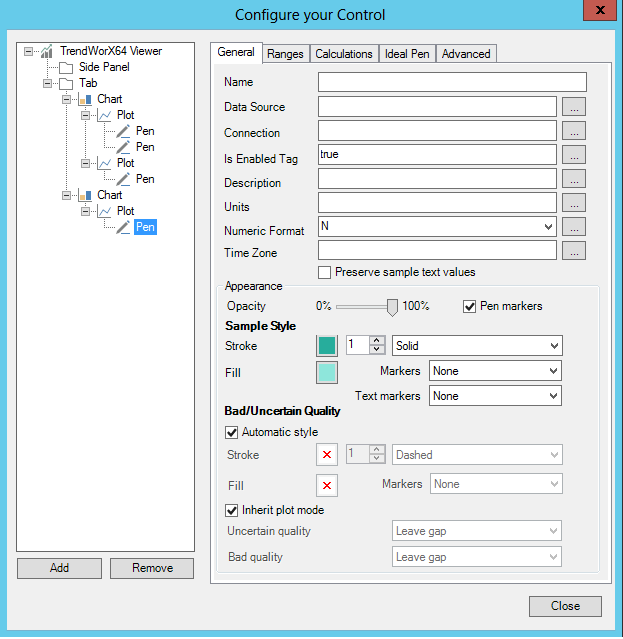
Enter a Data Source in the text entry field or click on the Data Source ellipsis button ![]() to open the Data Browser. Within the Data Browser, make sure you are on the OPC UA tab and click the ellipsis button
to open the Data Browser. Within the Data Browser, make sure you are on the OPC UA tab and click the ellipsis button ![]() under Data Item.
under Data Item.
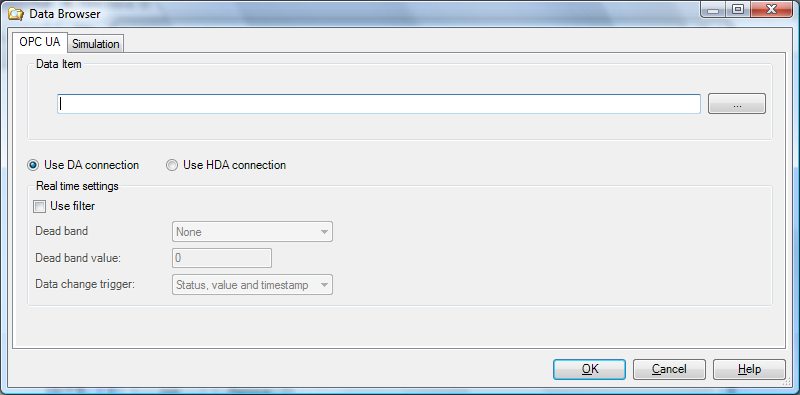
OPC UA Tab within the Data Browser
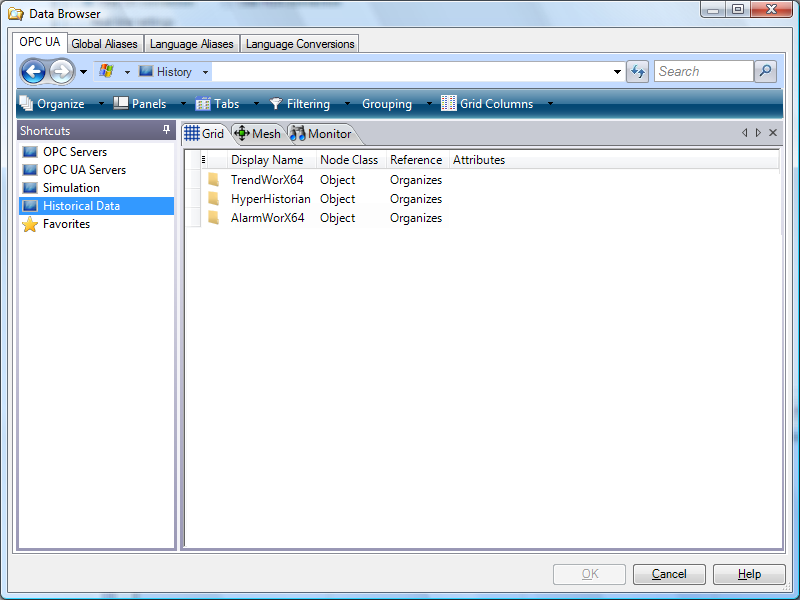
In the secondary Data Browser that appears, click Historical Data in the left-side navigation pane, then look for Hyper Historian on the right. Double-click Hyper Historian, then double-click Logging Group, then OPC UA collecting. For demonstration purposes in this sample trend example, double-click Sine then click OK.
Historical Data/Hyper Historian Shortcut
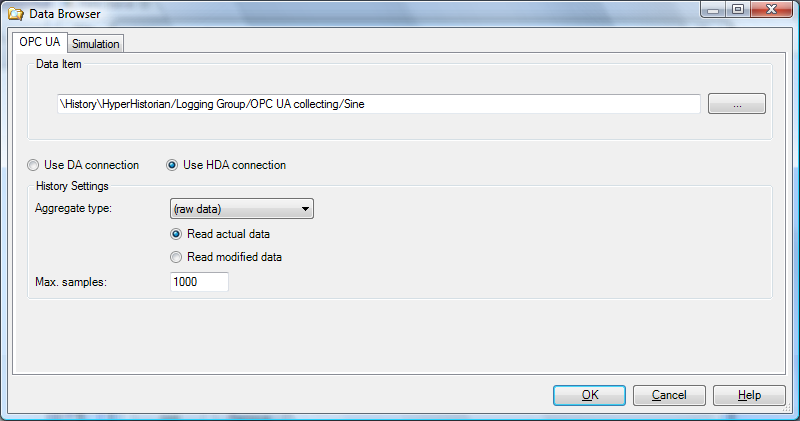
Within the remaining Data Browser tab, click the Use HDA connection radio button, then click OK.
HDA Selection within the OPC UA Tab
In the Control Configuration, you can now change the Description to, for example, "Hyper Historian Sine”.
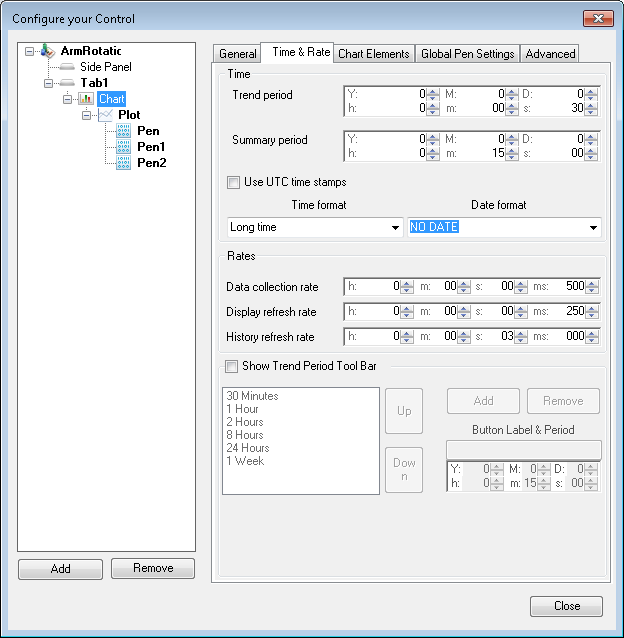
Next, in the left navigation pane click Chart View and select the Time and Rate tab (which is shown below). Enter your desired time settings (trend and summary periods in days, hours, minutes, seconds and/or milliseconds), specify whether to use UTC time stamps, and specify the time or data format. Set the rate settings (display refresh, data collection, and history refresh rates in hours, minutes, seconds and/or milliseconds), then click OK. For more about designing a trend chart, refer to Chart Options for Trends and Pen Options for Trends.
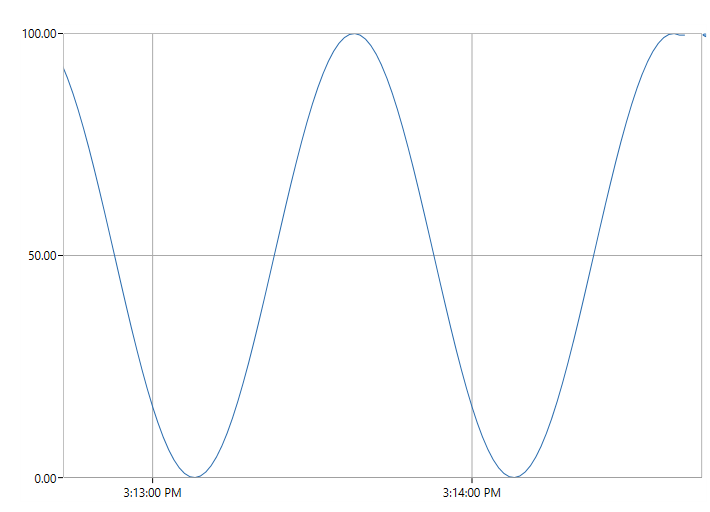
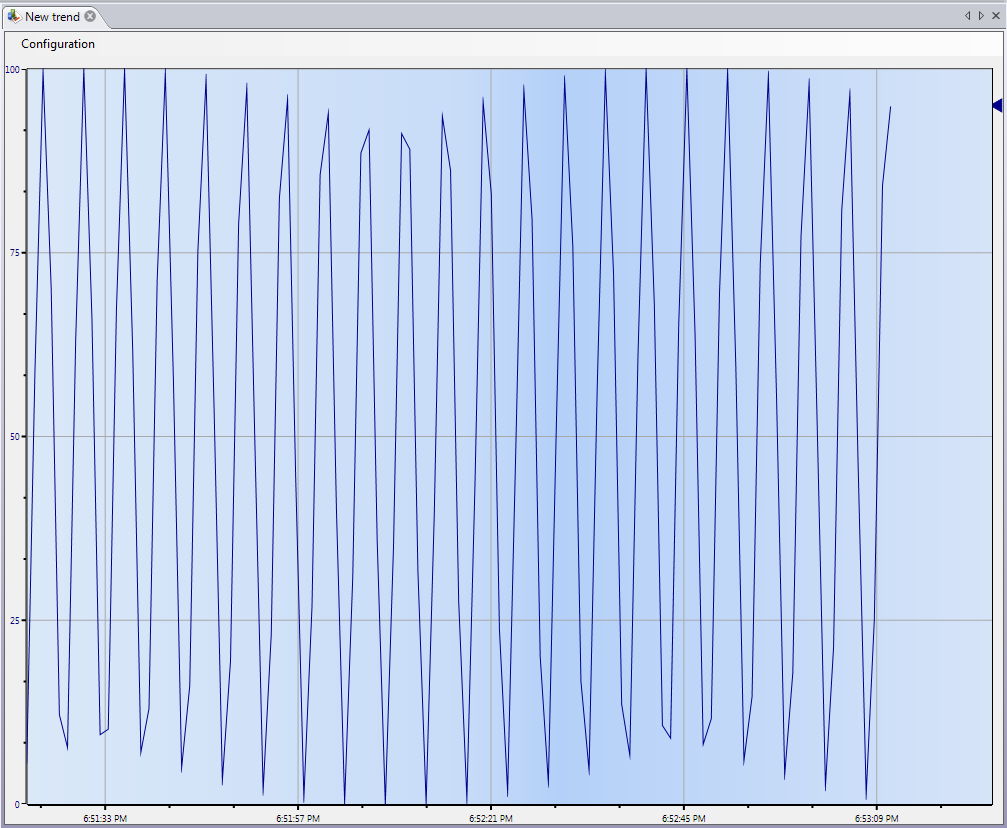
In the Workbench Project Explorer, in the New Trend that you just created, click on Runtime and you’ll see the trend in motion (which, in this sample, is the running sine wave).
Time & Date Tab within TrendWorX64 Configuration
In Hyper Historian you can now double-click anywhere in the viewer to enable the toolbar. In the toolbar, you can configure the trend during runtime, change plot types (line, area, bars or pie), edit the trend’s visual appearance, configure the timing for trend period and rates, show or hide axes, swap the x and y axes, zoom within the trend viewer, freeze and unfreeze the trend, and show and hide the legend.
Completed Historian Trend Example
Return to Top
In order to view remote historical data sources you may need to supply the path to the alarm server directly into the Unified Data Browser address bar of a client. The Unified Data Browser does not automatically browse and resolve historical data sources such as OPC UA and OPC HDA. The procedure is only slightly different to the one you just saw above where you set the data source of a pen to a local HDA server.
First check to see what current address is specified for your default FrameWorX64 server by doing the following:
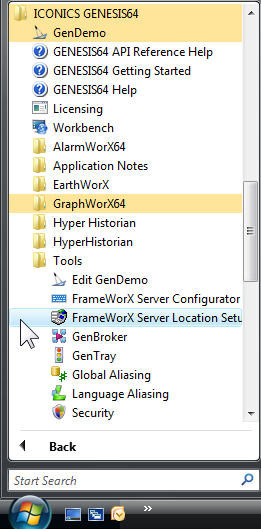
Click Start > ICONICS GENESIS64 > Tools > then select the FrameWorX64 Server Location Setup command as shown in the figure below.
The FrameWorX64 Server Location Setup Command
The Default Server Location dialog box appears as shown in the figure below.
The Default Server Location Dialog Box
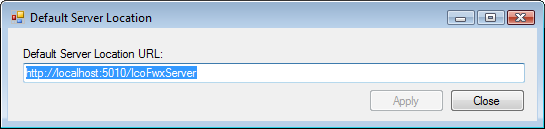
Note the address to the server so that you can modify it and enter the correct address into your client below.
The address is typically similar to the string: http://localhost:5010/IcoFwxServer, and the modification you make is to substitute your server name in place of the localhost.
To view a remote historical data source in TrendWorX64 Viewer , do the following:
Click the pen that will connect to the remote historical data source in the TrendWorX64 Viewer configuration dialog box.
Click the ellipsis button ![]() next to the Data Source text box to open the Data Browser for a pen object.
next to the Data Source text box to open the Data Browser for a pen object.
Data Browser
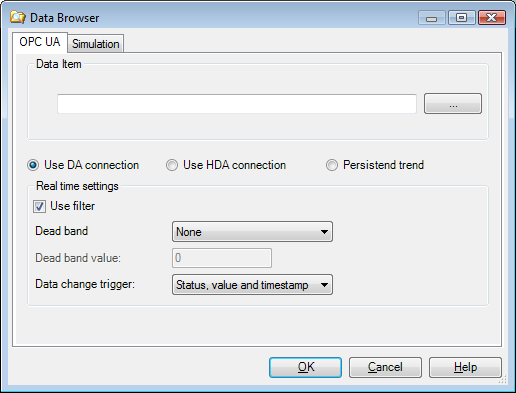
Click the Use HDA connection radio button.
Click the Ellipse button next to the Data Item text box to open the Unified Data Browser.
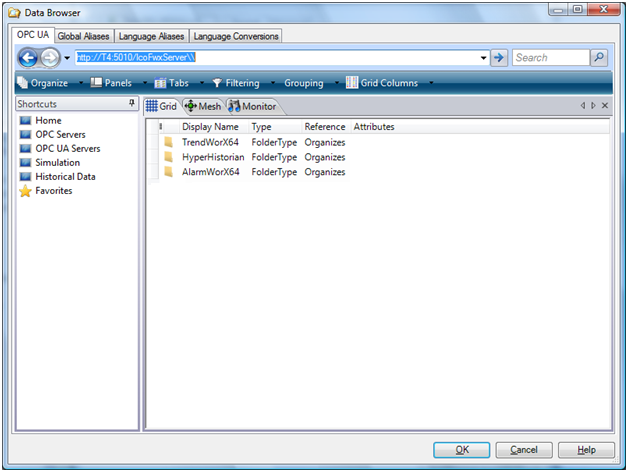
Enter the location of your default server into the address bar in the form you saw previously:
http://<localhost>:5010/IcoFwxServer
where localhost is replaced by the actual server name or IP address as shown in the figure below.
Enter a Remote HDA Server Directly into the Unified Data Browser
When you click outside of the Address bar the address changes from a path to its breadcrumb state, as shown in the figure below.
A Remote HDA Server Address in Breadcrumb Form
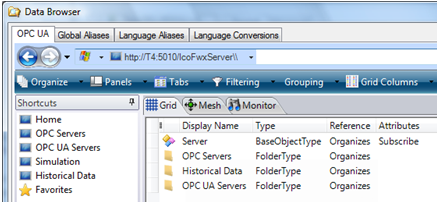
Click the OK button twice to return to your pen's configuration form in TrendWorX64 .
This procedure applies to setting a remote HDA Server in the TrendWorX64 Viewer as well as setting the data source to logged Hyper Historian historical data.
You may have noticed that when you view a real-time pen in the Trend Viewer, each time you exit runtime and re-enter it, the pen starts drawing from the right-hand side as if no data was there before. To change this behavior so that some of your data persists as you enter and exit runtime (or change displays), you can use the Memory Persistent Logger to save data in RAM.
Return to Top