Chart Options for Trends
A chart contains one or more plots that display trends. Each tab can have any number of charts. The Chart object is where you set the general properties of your display. The TrendWorX64 Viewer Configurator offers the largest set of configuration options in Configuration mode. However, you can also alter a Chart object's properties in Runtime mode by selecting options on the runtime toolbar or by using the TrendWorX64 Viewer Configuration tab group on the Workbench or GraphWorX64 ribbon. In all instances the features described work the same way.
To display a chart's options:
-
Click the Configure viewer button on the TrendWorX64 Viewer Configuration ribbon. This opens the TrendWorX64 Viewer configurator. (In Runtime, click the Edit Pens button on the TrendWorX64 Runtime ribbon.)
-
Select the Chart object from the tree view on the left corresponding to the Chart option you wish to customize, then go to the tab desired on the right. The TrendWorX64 Viewer chart has the following tabs. The Advanced tab contains each of the chart's properties, but you can set many of these properties using the other four tabs.
-
Add a plot to the chart by right-clicking the chart in the tree view, then hovering your cursor over Add and selecting Plot. You can then add a pen by right-clicking on that plot and then Add and then Pen (or Multiple Pens). This adds a pen to the chart in the tree view. Repeat this step for each pen you are adding to the chart. For more about pens, refer to Pen Options for Trends.
|

|
Warning. Not all TrendWorX64 features are supported in Microsoft Silverlight. If you are saving Silverlight files, refer to Silverlight Files in GENESIS64 for more information.
|
General Tab Options
The General tab sets some general chart properties associated with explaining the data that you are seeing in your display. You can alter the name of the object, legend and summary views, and work with a gallery and styles. A short description of each property follows. In configuration mode, as you change a property the sample view changes to reflect how your data will appear when you enter Runtime mode.
Properties you can set include:
-
Description: The name of the chart object as displayed in the tree control.
-
Background: Set a background color, gradient, or image pattern for the Chart using the dialog box that appears.
-
3D Visualization: When enabled the trend changes to a 3D chart.
-
Runtime Cursor, Only in Freeze Mode: Specify the default conditions in which runtime users see the cursor. Enabling this check box makes the cursor available only in freeze mode; leaving it unchecked makes the cursor available at all times during runtime. Runtime users can override this default setting. For more about freeze mode, refer to the Freeze Mode topic.
-
Legend: Selecting the Legend check box shows the legend in both Configuration mode and Runtime mode. Click here to see an example of what a legend looks like. Runtime users can manipulate pens during runtime if the chart has a Legend that includes certain options. For example, if the legend includes the Visibility field, runtime users can show and hide individual pens in the chart. For more about what runtime users can do, refer to Runtime Operations in TrendWorX. If you are showing the legend, you can select preferences for each of the following options:
-
-
Position: Display the legend to the Left of the chart, on Top of the chart, to the Right of the chart, or on the Bottom of the chart.
-
Show selected pen range: When this check box is enabled, the range of the chart automatically adjusts to match the range of the pens in the legend that are selected.
-
Colored details: Enable this check box to display the details about each pen in a different color within the legend.
-
Show Header: When this check box is enabled, a header row appears at the top of the legend, displaying the names of the legend fields that the user has selected.
-
Field Selection: Select the fields that will appear in the legend. The fields that can appear in the legend are listed below. The fields that appear in the legend give runtime users some control over the chart. For more about each option, refer to the Legend Options for Trend Charts topic.
-
Selected Field Settings, Column Alignment: If you select a field in the right-hand list box, you can adjust how the field's value is aligned within the legend. The value can be either Left-, Center-, or Right-aligned within a column of the legend.
-
Summary View: Selecting this check box displays a summary plot underneath the trend plot that shows values during the entire time that data is being collected. The Summary View shows only in Freeze mode. If the chart will display this view, also specify the position of this view (either on Top of the chart or on the Bottom of the chart). During Freeze mode, below the Summary is a cursor that runtime users can manipulate as a way of showing data changing over time. For a runtime example, refer to the Summary View topic.
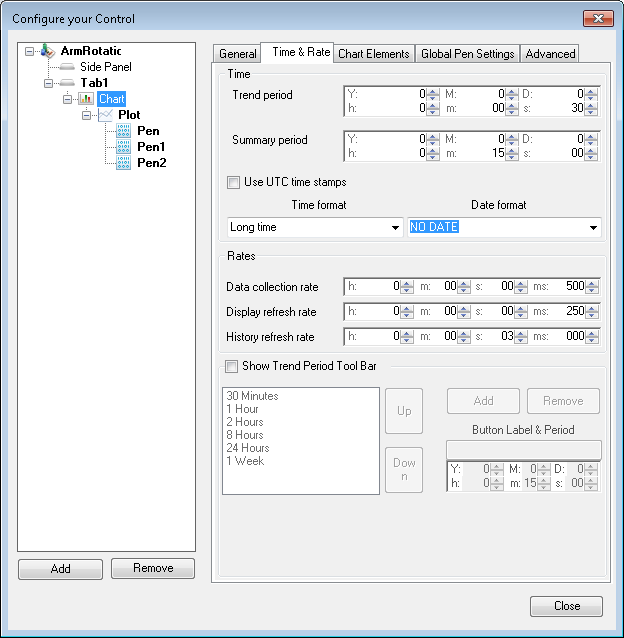
Time & Rate Tab
The Time & Rate tab determines the data collection rate, data display rate, chart refresh rate, and other factors that control what is stored in the TrendWorX64 Viewer data buffer and what is displayed. You can alter these settings either in Configuration mode or using the runtime toolbar buttons at runtime.
The properties that alter time and rates include:
-
Trend Period: Specify the interval of time between the left and right edges of the trend display by clicking the up and down arrows or by entering the desired value next to each time period label (Y = years, M = months, D = days, h = hours, m = minutes, and s = seconds).
-
Summary Period: Specify the length of time that data is to be stored in the data buffer for display in Freeze mode in the Summary window by clicking the up and down arrows or by entering the desired value next to each time period label (Y = years, M = months, D = days, h = hours, m = minutes, and s = seconds). If used, the summary period should be a longer period of time than the trend period. If on the General tab you specified that the Summary View will not appear on the chart, then this field is not relevant.
-
Use UTC time stamps: Enable this check box to display all time stamps in Coordinated Universal Time (UTC). This time is not affected by Daylight Saving Time.
|

|
Note: All historical clients and reporting tools will always retrieve historical data in their local (non-UTC) time.
|
-
Time format: Select the format for displaying times along one of the axes of the chart. You can choose from the following formats (where h or hh is the hour of the day, mm is the minute, ss is seconds, and tt represents AM or PM):
-
-
NO TIME (time will not appear on the chart)
-
Short Time (which is h:mm tt)
-
Long Time (Default) (which is h:mm:ss tt)
-
h:mm tt (example: 9:30 AM)
-
hh:mm tt (example: 09:30 AM)
-
H:mm (example: 9:30)
-
HH:mm (example: 09:30)
-
h:mm:ss tt (example: 9:30:04 AM)
-
hh:mm:ss tt (example: 09:30:04 AM)
-
H:mm:ss (example: 9:30:04)
-
HH:mm:ss (example: 09:30:04)
-
Date format: Select the format for displaying dates along one of the axes of the chart. You can choose from the following formats (where M or MM is the numerical month, MMMM is the name of the month, MMM is the name of the month abbreviated, dddd is the name of the day of the week, d or dd is the numerical day of the month, and yy or yyyy is the year):
-
-
NO DATE (Default) (the date will not appear on the chart)
-
Short date (which is M/d/yyyy, for example: 9/3/2010)
-
Long date (which is dddd, dd MMMM, yyyy, for example: Friday, 03 September, 2010)
-
M/d/yyyy (example: 9/3/2010)
-
M/d/yy (example: 9/3/10)
-
MM/dd/yy (example: 09/03/10)
-
MM/dd/yyyy (example: 09/03/2010)
-
yy/MM/dd (example: 10/09/03)
-
yyyy-MM-dd (example: 2010-09-03)
-
dd-MMM-yy (example: 03-Sep-10)
-
dddd, MMMM dd, yyyy (example: Friday, September 03, 2010)
-
MMMM dd, yyyy (example: September 03, 2010)
-
dddd, dd MMMM, yyyy (example: Friday, 03 September, 2010)
-
dd MMMM, yyyy (example: 03 September, 2010)
|
|
Note: The time axis of the chart (usually the x-axis) must show either the time or date at all times.
|
-
Data Collection Rate: Specify how often the chart's pens read data from the data source by clicking the up and down arrows or by entering the desired value next to each time period label (h = hours, m = minutes, s = seconds, and ms = milliseconds). In most instances data is collected less frequently than it is refreshed. Data collected is stored in the data buffer and shown in the Summary View. The default rate is 1 second.
-
Display Refresh Rate: Specify the frequency with which the viewer updates the display by clicking the up and down arrows or by entering the desired value next to each time period label (h = hours, m = minutes, s = seconds, and ms = milliseconds). The smaller the refresh rate, the more up-to-date the display is, but the more resources are consumed. The default rate is 500 milliseconds.
-
History Refresh Rate: Specify the refresh rate for requesting historical data from the server by clicking the up and down arrows or by entering the desired value next to each time period label (h = hours, m = minutes, s = seconds, and ms = milliseconds). When the logged data is set to WRITE to the database in a certain period, use a history refresh rate that is the same or longer than the historical collection rate. Whenever possible, the Viewer will try to use the rate specified by the user, but in cases where the amount of data to request from the server is too big or when the data on the screen is apparently not changing or moving because of a very large trend period and/or a slow animation rate, the Viewer will internally calculate and use a different (slower) history refresh rate. The default rate is 3 seconds.
|
|
Note. To force an immediate refresh of the data whenever needed, runtime users can click the Refresh Data  button in the Runtime toolbar. button in the Runtime toolbar.
|
|
|
Warning. Selecting a very short trend period (less than 15 seconds) could significantly decrease application performance since it places heavy demands on the computer's resources.
|
|
|
Note: The Trend Period Tool Bar will add a button to the Trend Period Tool Bar only if the button's trend period does not match the trend period of any other button already on the toolbar.
|
-
Chart Elements Options
The Chart Elements tab includes the color of lines and backgrounds, as well as how the different Axes are displayed. You can also alter the ranges that a multi-plot display uses on this tab. In runtime, when you click the Show/Hide Axis button this same tab is displayed as a dialog box. These settings apply to Configuration mode, Runtime mode, and Freeze Mode.
-
Background and Plot Area: These boxes open up the Color Picker where you can choose the a color, gradient, or image pattern to use for the chart background and plot area.
-
Zoom Ruler: Checking this box adds percentages of zooming (100.00% at the top, 50.00% at mid-level and 0.00% at bottom) at the right side of the chart area.
Show Section:
-
Show: When checked will display the grid lines on the chart.
-
Click the Color Picker box to choose a color, gradient, or image pattern to use for the grid lines.
-
X Axis and Y Axis: Specify the lines that will show for the x-axis and y-axis. Select from the following options:
-
-
None: No lines will appear on the grid for that axis.
-
Only major lines: Major lines will be indicated by a solid line.
-
All Lines: Major lines will be indicated by a solid line and minor lines will be indicated by a dotted line.
X Axis section:
-
Show: Selecting this check box displays the x-axis, which is the axis along the bottom of the chart.
-
Advanced button: This button is active if the Show check box is checked. Clicking it opens the Configuration Axis dialog box.
-
-
Background: Use the color picker to set a background color for the x-axis.
-
Show Title: Select this option to show a title for the trend along the x-axis. If you select this option, enter the title in the Text field, and use the Alignment drop-down list to specify whether you want the title Centered, or aligned at one end of the x-axis or the other (Maximum or Minimum). The size of the title is determined by the font selections in this dialog box.
-
Tick Marks: Major and Minor: Sets the size of the tick marks along the x-axis. A higher count makes tick marks appear closer together; a higher length makes them longer. The count is the same as the number on the Chart elements tab for Major and Minor tick marks.
-
Font: Family and size: Select the font family and font size to be used for the labels on the x-axis.
-
Numeric Format: Enter a series of characters according to the guidelines on the following Web site to format the numeric values on the x-axis: http://msdn.microsoft.com/en-us/library/0c899ak8.aspx and http://msdn.microsoft.com/en-us/library/dwhawy9k.aspx. [Examples: "C" shows the number in form of currency; "P" shows the number in percentage; "0.0" shows the number with 1 decimal place; "0.000" shows the number with 3 decimal places.]
-
Text Alignment: Align the labels for the x-axis either Left, Center, or Right relative to the tick marks.
-
Click OK when you are done.
-
Major and Minor Ticks: Sets the number of Major and Minor tick marks on the x-axis of the chart.
Y Axis section:
-
Show: Selecting this check box displays the y-axis, which is the axis along the left side of the chart.
-
Global Range: This option is available if the Show check box is checked.
Leave this check box unchecked  to manually set the number of pens to be used in the Pen Ranges box.
Selecting this check box  lets you set the number of ranges for the y-axis for any number of displayed plots; the following options appear:
-
-
Fixed Range: When selected you can enter a Minimum and Maximum number for the y-axis range. Click the ellipsis button to use an alias to set the minimum and maximum number.
-
Automatic Scaling: The application will set the range of the y-axis.
-
Margin (%): Provide a margin of error based on the percentage of the range that the application sets using automatic scaling. Setting this value to a higher percentage reduces the number of times that the application needs to re-draw the y-axis in Runtime mode.
-
Advanced button: Clicking it opens the Configuration Axis dialog box.
-
-
Background: Use the color picker to set a background color for the y-axis.
-
Show Title: Select this option to show a title for the trend along the y-axis. If you select this option, enter the title in the Text field, and use the Alignment drop-down list to specify whether you want the title Centered, or aligned at one end of the y-axis or the other (Maximum or Minimum). The size of the title is determined by the font selections in this dialog box.
-
Tick Marks: Major and Minor: Sets the size of the tick marks along the y-axis. A higher count makes tick marks appear closer together; a higher length makes them longer. The count is the same as the number on the Chart elements tab for Major and Minor tick marks.
-
Font: Family and size: Select the font family and font size to be used for the labels on the y-axis.
-
Numeric Format: Enter a series of characters according to the guidelines on the following website to format the numeric values on the y-axis: http://msdn.microsoft.com/en-us/library/dwhawy9k.aspx. [Examples: "C" shows the number in form of currency; "P" shows the number in percentage; "0.0" shows the number with 1 decimal place; "0.000" shows the number with 3 decimal places.]
-
Text Alignment: Align the labels for the y-axis either Left, Center, or Right relative to the tick marks.
-
Logarithmic: Leaving this check box empty enables a linear scale in which the steps along the y-axis are constant (for example: 11, 12, 13, 14, 15, 16; or 5, 10, 15, 20, 25). The linear scale is the scale that is traditionally used for an axis.
-
-
Putting a check mark in this check box enables a logarithmic scale for the y-axis. For example, logarithmic values with base value of 10 are 100, 1000, 10000, 100000. You might use the logarithmic scale if the pen is recording values that increase exponentially or values in an astronomical range. Click here to see a comparison of the two types of scale.
-
Click OK when you are done.
Global Pen Settings Options
The Global Pen Settings tab determines how the chart displays uncertain or bad quality data and how the legend displays the chart's disabled pens. The following options also appear in Advanced Display Options for pens.
The properties that affect global pen settings include:
- Uncertain quality plot: For uncertain quality pen data, you can choose to either leave the uncertain quality values blank within the chart (Leave gap), plot the points anyway (Plot), or connect surrounding good quality data (Span Over).
- Bad quality plot mode: For bad quality pen data, you can choose to either leave the bad quality values blank within the chart (Leave gap), plot the points anyway (Plot), or connect surrounding good quality data (Span Over).
- Show disabled pens: When this check box is enabled (as it is by default), the chart's disabled pens appear in gray within the chart's legend during runtime. When the check box is disabled, the chart's disabled pens do not appear in the chart's legend at all.
For information about Advanced Options, go to the topic Advanced Display Options.
See also:
Advanced Display Options (TrendWorX)
Pen Options for Trends
Plot Options for Trend Charts
Working With Trends