The AlarmWorX64 Viewer is a GENESIS64 client application that provides real-time alarm information. With this application, you can create a viewer that contains alarms, which can be viewed independently or incorporated into a GraphWorX64 display, such as a console. The viewer communicates to OPC UA servers (including legacy Alarm & Events servers) so you can display and manage alarms based on the connections to the data source that you specify. While in AlarmWorX64 Server, you control the manner in which the server is polled. In the AlarmWorX64 Viewer, you determine the alarms' appearance.
The AlarmWorX64 Viewer control in GraphWorX64 allows you to configure any of the following:
AlarmWorX64 Viewer lets you organize and display your alarms in a chart, which provides a summary or aggregate view of alarms organized by the criteria you specify. There are many options in the alarm viewer that affect the way that alarms are displayed, but essentially you determine the following:
Which alarms display - You can create alarm definitions and attach them to specific alarm data sources.
What the display looks like - You can display alarm notifications in a visual form that can be highly customized for a specific application.
How alarms are grouped and sorted - You can modify the display and its behavior to make it easier to notice, respond, and acknowledge alarm conditions.
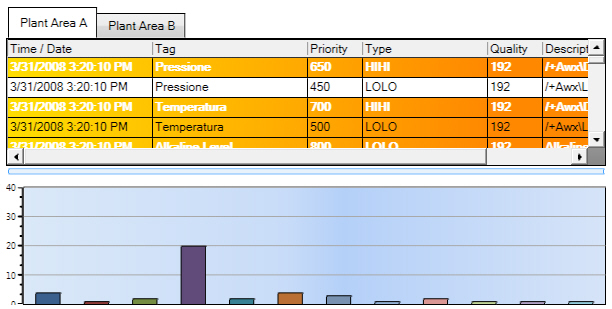
Sample of an AlarmWorX64 Viewer, with Two Tabs, a Grid, and a Chart
Note, however, that AlarmWorX64 Viewer only displays real-time and historical alarms and current operator messages. It is the AlarmWorX64 Logger that stores or logs historical alarm data. The alarm architecture is described in the topic AlarmWorX64 Server.
|
|
Warning: Not all AlarmWorX64 features are supported in Microsoft Silverlight. If you are saving Silverlight files, refer to Silverlight Files in GENESIS64 for more information. |
You can configure and view real-time and historical alarms by using the AlarmWorX64 Viewer. AlarmWorX64 displays real-time alarms or historical alarms in a grid-like view in the AlarmWorX64 Viewer which is a control that can be dropped into any .NET Framework form. Keep in mind that GENESIS64 uses .NET Framework controls which abstracts data location, allowing for the creation of distributed systems. The AlarmWorX64 Viewer is more properly described as a "control" object, and is itself a container that can contain additional objects. More about configuration is described below in this topic and in Working with Alarms.
Runtime operators can view AlarmWorX64 displays that monitor the OPC alarm tags that are configured in a chart or display grid. As alarms are triggered, operators can acknowledge the alarms and take action. Operators can also do alarm analysis toward preventing conditions that trigger alarms, can even summarize alarms into aggregate views. For more information, refer to Alarm Acknowledgement and Alarm Runtime Operations.
The viewer can be used inside the Workbench application, or you can drop an AlarmWorX64 control onto a GraphWorX64 design surface. An AlarmWorX64 viewer can be placed into a GraphWorX64 display, which means you can create a standalone viewer in the Workbench, then use it in any number of GraphWorX64 displays. The alarm grid or chart object is the same viewer you see in Workbench. The alarm grid is the same in both the Workbench and a GraphWorX64 display, although there are some small differences in how the displays are configured and run in the two different forms. In either case, when the alarm is connected correctly to an OPC data source, the grid appears in a form that conforms to your specifications. Live alarms appear in the grid view as a combination of text and background colors, text font, blinking and beeping based on current state of alarms, severity, etc., that you set in the AlarmWorX64 Viewer configurator. In a chart display, alarms may be summarized as categories of error events, as a bar chart, or in any other supported chart format.
|
|
Warning: Alarm data is provided by the AlarmWorX64 Server which is a Windows service that polls OPC data sources. For the AlarmWorX64 client/server system to function correctly, the FrameWorX server must be properly configured. |
The AlarmWorX64 Viewer opens in the GENESIS64 Workbench. You can open an AlarmWorX64 Viewer in any of the following ways:
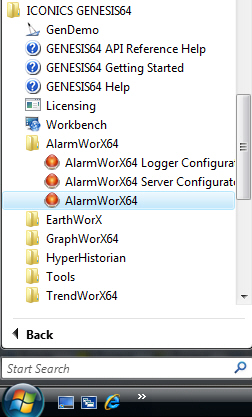
From the Start menu, select All Programs > ICONICS GENESIS64 > AlarmWorX64 > AlarmWorX64.
If the Workbench is open, click the AlarmWorX64 bar in the Project Explorer, or go to the Home ribbon and click the AlarmWorX icon.
There are instances when you are in the Workbench application where you need to move from AlarmWorX64 viewer to server to logger and the component isn't yet loaded into the tree control. To put the icon into the tree control launch bar you click the tree control menu button and select the component. Once the icon is in the tree control shortcuts you can click the icon to view the component in the tree control.
The AlarmWorX64 Viewer control can be dragged and dropped into GraphWorX64, where it works the same as it does in Workbench. The AlarmWorX64 Viewer has its own tree control in the Project Explorer, and displays a set of alarms in a multi-tabbed display.
To place an AlarmWorX64 Viewer control into the GraphWorX64 design surface:
From the Start menu, select All Programs, ICONICS GENESIS64, GraphWorX64 , GraphWorX64 .
Click the Controls menu on the GraphWorX64 ribbon and then click the AlarmWorX64 Viewer control button.
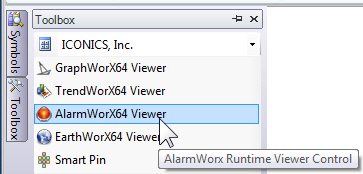
Or, alternatively, click the Toolbox and select the AlarmWorX64 Viewer control.
Click and drag the cross hair until you have the control size you desire. You can modify its shape and size later.
After a moment, you will see the AlarmWorX64 Viewer control appear with its selection handles visible. You can click the object to select it or click the design surface to deselect it.
The control can be re-sized using the handles modifying either the horizontal or vertical dimension; or by using the corner handles re-sizing both dimensions while retaining the same aspect ratio. What you see in the control is simply a graphic and doesn't indicate the data or data sources. You can perform a few selected operations by using the GraphWorX64 ribbon in the AlarmWorX64 Configuration mode. The AlarmWorX64 Viewer runtime toolbar includes buttons for opening the configurator (an extended property sheet), changing views, modifying visual elements, and applying themes.
As you make changes in the ribbon, the graphic you see for the control changes to indicate the effect.
To configure an alarm viewer, you need to perform the following steps:
Open an AlarmWorX64 Viewer in the Workbench or the GraphWorX64 display.
Determine the number of and types of alarm display objects you to appear in the viewer and determine how you want to organize them in the viewer. For example, you may want to create several tabs in the viewer, one for each plant; or you may want a viewer to focus on one plant, and have each tab show a different set of alarms.
Create the tabs to be included in the display, then add the grids, charts, lists, or flips that you want included on each tab.
For each grid, chart, list, or flip, set the data source for the contents, establishing a connection to points (set of alarms) that you want to display.
At runtime, when an alarm fires it will appear as a row in the grid, and each field value will appear as column. If the same alarm fires multiple times then, depending upon how you set up the behavior, operators will most likely see the state of each row change over time as the alarm condition changes.
|
|
Note: Alarm data contains one or more fields (such as severity, acknowledge, etc.), whereas trend data displays a single value that changes over time. |
Specify the appearance of the chart, graph, list, or flip.
Group alarms into groups based on fields and the range of values that you define (optional).
|
|
Tip: The appearance options that you see in the AlarmWorX64 Viewer are identical to the ones that appear in the TrendWorX64 Viewer . Data sources and connection properties are very different, however. |
Define conditions that will guide runtime operators with message text, and display visual status icons for the condition types.
With these defined features, save your alarm display and click the Runtime button to view live or real time alarm data.
For more information about each of these steps, refer to Working with Alarms.
See also:
Grouping Alarms in Grids and Charts
Configuring Filters for Alarm Grids and Charts
Setting the Alarm Beep Function