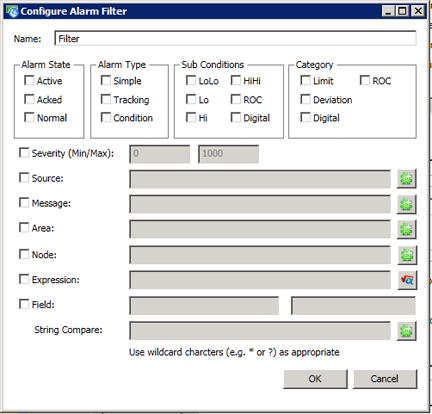
In the Configure Alarm Filter dialog box in AlarmWorX64 Viewer, you can create criteria that define a filter or range of values under which a chart's or grid's data is affected. A filter is an expression that must be satisfied for an alarm to conform to that filter. It creates a condition for displaying or working with data, and can be used in several places in an alarm viewer. Once you define a filter for one context, it becomes available in all other contexts, too. For example, if you define a filter for use in a chart, you also use that same filter for translating text.
Configure Alarm Filter Window

To open the Configure Alarm Filter dialog box:
To open the dialog box, click on one of the following:
A chart's Data Analysis tab (from the Group Data Samples field)
A grid's Condition tab (when creating an alarm's appearance from a Visual Styles cell)
A grid's Grouping Range tab (when creating a grouping range from an Alarm Condition cell)
A grid's Status Indicator tab
A grid's Text Translator tab (when creating conditions for displaying text from an Alarm Condition cell)
A grid's Behavior tab (when using the Configure Client Side Filter option)
A grid's Behavior tab (when using the Force Comment on Condition option)
To use a filter that is already defined:
Open one of the tabs listed above.
Use the pulldown menu within the Edit Filters section of that tab (as shown below) to select an existing filter. To edit the filter, click on the ![]() button.
button.
Edit Filters Section of a Tab

To add a filter:
Open one of the tabs listed above.
Click on the Add ![]() button. This opens the Configure Alarm Filter window, as shown below.
button. This opens the Configure Alarm Filter window, as shown below.
Configure Alarm Filter Window

Type the Name (in the top text entry field) of the filter you are creating. For example, you can type "Temp Exceeds 100 F".
Select the Alarm State, Alarm Type, Sub Conditions and Category using the checkboxes in the top of the window.
You can now select (by checkmark) and enter data to use for filtering among Severity, Source, Message, Area, Node, Expression, Field and/or String Comparison. Click on the ![]() button to utilize the Data Browser. When using the Expression field, click on the
button to utilize the Data Browser. When using the Expression field, click on the ![]() button to access the Expression Editor.
button to access the Expression Editor.
When you are done, click the OK button to apply the filter and close the dialog box.
System filters are predefined filters which are frequently used or that provide examples of filters that you can create for yourself. Each predefined filter is made up of a field and a logical operator, plus a value. System filters include the following values (for help understanding some of these values, refer to the Columns topic):
None
Severity <= 100 (other values are 200, 400, 500, 600, 800, and 1000). Shows alarms whose severity is equal to or greater than a specified value.
NewState <= 1 (other values are 3 and 7). Shows alarms whose new state is equal to or greater than a specified value.
Quality == 192 (other values are 0, 64, 4, 8, 12, 16, 20, 24, 28, 68, 80, 84, 88, and 216). Shows alarms whose quality field is equal to a specified value.
Category == 0 (other values are 1, 2, and 3). Shows alarms whose category field is equal to a specified value.
EventType == 1 (other values are 2 and 4). Shows alarms whose event type field is equal to a specified value.
Plus the names of other filters that you have defined in the alarm display.
Column headings for the grid and the fields they are associated with are listed below:
|
Field |
Alias (if any) |
|
SourceName |
|
|
EventType |
|
|
Time |
|
|
ReceiveTime |
Time/Date |
|
TimeZone |
|
|
Message |
Description |
|
Severity |
Priority |
|
ActiveTime |
|
|
ActorId |
|
|
AttributeCount |
|
|
Category |
|
|
ChangeMask |
|
|
ConditionName |
|
|
Cookie |
|
|
EventType |
|
|
NewState |
|
|
OriginalSource |
Tag |
|
Quality |
|
|
SubConditionName |
Type |