|
|
The features on this page require a GENESIS64 Advanced license and are not available with GENESIS64 Basic SCADA . |
|
|
The features on this page require a GENESIS64 Advanced license and are not available with GENESIS64 Basic SCADA . |
History Reader can be accessed as a separate application that is included with the installation of ICONICS Hyper Historian suite. See About Hyper Historian Readers for additional information.
History Reader Application

Point Name - Enter a point name in the text entry field or click on the ellipsis button [...] to open the Data Browser to navigate to your selected point name.
Start Time (UTC) - You can enter the starting day/date/month/year/hour/minute/second in the text entry field or click on the  button to open the calendar tool to pick the date.
End Time (UTC) - You can enter the ending day/date/month/year/hour/minute/second in the text entry field or click on the button to open the calendar tool to pick the date.
Raw data - Click this button if you wish to included raw data in the Hyper Reader read.
Aggregates - Click this button if you wish to include aggregates in the Hyper Reader read. Once selected, you will be able to use the nearby pulldown menu to select from the following (listed alphabetically):
|
Aggregate Type Name |
Description |
|
AnnotationCount |
This Aggregate returns a count of all Annotations in the interval. |
|
Average |
The Average Aggregate adds up the values of all good Raw data for each interval, and divides the sum by the number of good values. If any non-good values are ignored in the computation, the Aggregate StatusCode will be determined using the StatusCode Calculation. This aggregate is not time based so the PercentGood/PercentBad applies to the number of values in the interval. |
|
Count |
The Count Aggregate retrieves a count of all the raw values within an interval. If one or more raw values are non-good, they are not included in the count, and the Aggregate StatusCode is determined using the StatusCode Calculation for non-time based Aggregates. If no good data exists for an interval, the count is zero. |
|
Delta |
The Delta Aggregate retrieves the difference between the earliest and latest good raw values in the interval. The aggregate is negative if the latest value is less than the earliest value. The status is Uncertain_DataSubNormal if non-good values are skipped while looking for the first or last values. The status is Good otherwise. The status is Bad_NoData if no good raw values exist. |
|
DeltaBound |
The DeltaBounds Aggregate returns the difference between the StartBound and the EndBound Aggregates with the exception that both the start and end must be good. If the end value is less than the start value, the result will be negative. If the end value is the same as the start value the result will be zero. If the end value is greater than the start value, the result will be positive. If one or both values are bad the return status will be Bad_NoData. If one or both values are uncertain the status will be Uncertain_DataSubNormal. |
|
DurationBad |
The DurationBad Aggregate divides the interval into regions of bad and non-bad data. Each region starts with a data point in the interval. If that data point is bad the region is bad. The aggregate is the sum of the duration of all bad regions expressed in milliseconds. The status of the first region is determined by finding the first data point at or before the start of the Interval. If no value exists, the first region is bad. Each Aggregate is returned with timestamp of the start of the interval. StatusCodes are Good, Calculated. |
|
DurationGood |
The DurationGood Aggregate divides the interval into regions of good and non-good data. Each region starts with a data point in the interval. If that data point is good the region is good. The aggregate is the sum of the duration of all good regions expressed in milliseconds. The status of the first region is determined by finding the first data point at or before the start of the interval. If no value exists, the first region is bad. Each Aggregate is returned with timestamp of the start of the interval. StatusCodes are Good, Calculated. |
|
DurationInStateZero |
The DurationInStateZero Aggregate returns the time Duration during the interval that the Variable was in the zero state. The Simple Bounding Values for the interval are used to determine initial value (start time <end time) or ending value (if start time > end time) If one or more raw values are non-good, they are not included in the Duration, and the Aggregate StatusCode is determined using the StatusCode Calculation for time based aggregates. Duration is in milliseconds. Unless otherwise indicated, StatusCodes are Good, Calculated. |
|
DurationInStateNonZero |
The DurationInStateNonZero Aggregate returns the time Duration during the interval that the Variable was in the one state. The Simple Bounding Values for the interval are used to determine initial value (start time <end time) or ending value (if start time > end time) If one or more raw values are non-good, they are not included in the Duration, and the Aggregate StatusCode is determined using the StatusCode Calculation (See Clause 5.4.3) for time based aggregates. Duration is in milliseconds. Unless otherwise indicated, StatusCodes are Good, Calculated. |
|
End |
The End Aggregate retrieves the latest raw value within the interval, and returns that value and status with the timestamp at which that value occurs. If no values are in the interval then the StatusCode is Bad_NoData. |
|
EndBound |
The EndBound Aggregate returns the value and status at the EndTime for the interval by calculating the Simple Bounding Values for the interval. The timestamp returned is always the start of the interval. |
|
Interpolative |
The Interpolative Aggregate returns the Interpolated Bounding Value for the startTime of each interval. When searching for Good values before or after the bounding value, the time period searched is a time range which is the size of the ProcessingInterval. |
|
Maximum |
The Maximum Aggregate retrieves the maximum good raw value within the interval, and returns that value with the timestamp at which that value occurs. Note that if the same maximum exists at more than one timestamp, the oldest one is retrieved and the MultipleValues bit is set. Unless otherwise indicated, StatusCodes are Good, Raw. If no values are in the interval no data is returned with a timestamp of the start of the interval. If only bad quality values are available then the status is returned as Bad_NoData. The timestamp of the Aggregate will always be the start of the interval for every ProcessingInterval. |
|
Maximum2 |
The Maximum2 Aggregate retrieves the Maximum good value for each interval as defined for Maximum except that Simple Bounding Values are included. The Simple Bounding Values for the interval are found according to the definition of Simple Bounding Values. Any bad values are ignored in the computation, The Aggregate StatusCode will be determined using the StatusCode Calculation for time based aggregates. If a bounding value is returned then the status will indicate, Raw, Calculated or Interpolated. If TreatUncertainAsBad is false and an Uncertain raw value is the Maximum then that Uncertain value is used. Uncertain values are ignored otherwise. If sloped interpolation is used and the End bound is the Maximum value then End bound is used as the Maximum with the timestamp set to the startTime of the interval. The End bound is ignored in all other cases. |
|
MaximumActualTime |
The MaximumActualTime is the same as the MinimumActualTime Aggregate, except that the value is the maximum raw value within the interval. Note that if the same maximum exists at more than one timestamp, the oldest one is retrieved and the Aggregate Bits are set to MultipleValues. |
|
MaximumActualTime2 |
The MaximumActualTime2 Aggregate retrieves the Maximum good value for each interval as defined for MaximumActualTime except that Simple Bounding Values are included. The Simple Bounding Values for the interval are found according to the definition of Simple Bounding Values. Any bad values are ignored in the computation, The Aggregate StatusCode will be determined using the StatusCode Calculation for time based aggregates. If a bounding value is returned then the status will indicate, Raw, Calculated or Interpolated. If TreatUncertainAsBad is false and an Uncertain raw value is the Maximum then that Uncertain value is used. Uncertain values are ignored otherwise. If sloped interpolation is used and the End bound is the Maximum value then End bound is used as the Maximum with the timestamp set to the EffectiveEndTime of the interval. The End bound is ignored in all other cases. |
|
Minimum |
The Minimum Aggregate retrieves the minimum good raw value within the interval, and returns that value with the timestamp at which that value occurs. Note that if the same minimum exists at more than one timestamp, the oldest one is retrieved and the MultipleValues bit is set. Unless otherwise indicated, StatusCodes are Good, Raw. If no values are in the interval no data is returned with a timestamp of the start of the interval. If only bad quality values are available then the status is returned as Bad_NoData. The timestamp of the Aggregate will always be the start of the interval for every ProcessingInterval. |
|
Minimum2 |
The Minimum2 Aggregate retrieves the minimum good value for each interval as defined for Minimum except that Simple Bounding Values are included. The Simple Bounding Values for the interval are found according to the definition of Simple Bounding Values. Any bad values are ignored in the computation. The Aggregate StatusCode will be determined using the StatusCode Calculation for time based aggregates. If a bounding value is returned then the status will indicate, Raw, Calculated or Interpolated. If TreatUncertainAsBad is false and an Uncertain raw value is the minimum then that Uncertain value is used. Uncertain values are ignored otherwise. If sloped interpolation is used and the End bound is the minimum value then End bound is used as the Minimum with the timestamp set to the startTime of the interval. The End bound is ignored in all other cases. |
|
MinimumActualTime |
The MinimumActualTime Aggregate retrieves the minimum good raw value within the interval, and returns that value with the timestamp at which that value occurs. Note that if the same minimum exists at more than one timestamp, the oldest one is retrieved and the Aggregate Bits are set to MultipleValues. |
|
MinimumActualTime2 |
The MinimumActualTime2 Aggregate retrieves the minimum good value for each interval as defined for Minimum except that Simple Bounding Values are included. The Simple Bounding Values for the interval are found according to the definition of Simple Bounding Values. Any bad values are ignored in the computation, The Aggregate StatusCode will be determined using the StatusCode Calculation for time based aggregates. If a bounding value is returned then the status will indicate, Raw, Calculated or Interpolated. If TreatUncertainAsBad is false and an Uncertain raw value is the minimum then that Uncertain value is used. Uncertain values are ignored otherwise. If sloped interpolation is used and the End bound is the minimum value then End bound is used as the Minimum with the timestamp set to the EffectiveEndTime of the interval. The End bound is ignored in all other cases. |
|
NumberOfTransitions |
The NumberOfTransitions Aggregate returns a count of the number of transition the Variable had during the interval. If one or more raw values are bad, they are not included in the count, and the Aggregate StatusCode is determined using the StatusCode Calculation for non-time based aggregates. The earliest transition must be calculated by comparing the earliest non-bad value in the interval to the previous non-bad value. A transition occurred if no previous non-bad value exists or if the earliest non-bad value is different. The endTime is not considered part of the interval, so a transition occurring at the endTime is not included. Unless otherwise indicated, StatusCodes are Good, Calculated. |
|
PercentBad |
The PercentBad Aggregate performs the following calculation: PercentBad = DurationBad / ProcessingInterval * 100 Where: DurationBad is the result from the DurationBad Aggregate, calculated using the ProcessingInterval supplied to PercentBad call. ProcessingInterval is the duration of interval. If the last interval is a partial interval then the duration of the partial interval is used in the calculation. Each Aggregate is returned with timestamp of the start of the interval. StatusCodes are Good, Calculated. |
|
PercentGood |
The PercentGood Aggregate performs the following calculation: PercentGood = DurationGood / ProcessingInterval * 100 Where: DurationGood is the result from the DurationGood Aggregate, calculated using the ProcessingInterval supplied to PercentGood call. ProcessingInterval is the duration of interval. If the last interval is a partial interval then the duration of the partial interval is used in the calculation. Each Aggregate is returned with timestamp of the start of the interval. StatusCodes are Good, Calculated. |
|
Range |
The Range Aggregate finds the difference between the maximum and minimum good raw values in the interval. If only one Good value exists in the interval, the range is zero. Note that the range is always zero or positive. If non-good values are ignored when finding the minimum or maximum values or if bad values exist then the status is Uncertain_DataSubNormal. |
|
Range2 |
The Range2 Aggregate finds the difference between the maximum and minimum values in the interval as returned by the Minimum2 and Maximum2 Aggregates. Note that the range is always zero or positive. |
|
Start |
The Start Aggregate retrieves the earliest raw value within the interval, and returns that value and status with the timestamp at which that value occurs. If no values are in the interval then the StatusCode is Bad_NoData. |
|
StartBound |
The StartBound Aggregate returns the value and status at the StartTime for the interval by calculating the Simple Bounding Values for the interval. |
|
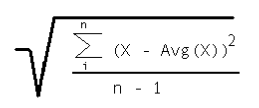
StdDevPopulation |
The StandardDeviation Population aggregate uses the formula:
Where X is each good raw value in the interval, Avg(X) is the average of the good raw values, and n is the number of good raw values in the interval. For every interval where n=1, a value of 0 is returned. If any non-good values were ignored, the aggregate quality is uncertain/subnormal. All interval aggregates return timestamp of the start of the interval. Unless otherwise indicated, qualities are Good, Calculated. This calculation is for a full population where the calculation is done on the full set of data. Use StdDevSample to calculate the standard deviation of a subset of the full population. An example would be when underlying data collected on an exception basis versus sampled from the data source. |
|
StdDevSample |
The StandardDeviationSample aggregate uses the formula:
Where X is each good raw value in the interval, Avg(X) is the average of the good raw values, and n is the number of good raw values in the interval. For every interval where n=1, a value of 0 is returned. If any non-good values were ignored, the aggregate quality is uncertain/subnormal. All interval aggregates return timestamp of the start of the interval. Unless otherwise indicated, qualities are Good, Calculated. This calculation is for a sample population where the calculation is done on a subset of the full set of data. Use StandardDeviationPopulation to calculate the standard deviation of a full set of data. An example would be when your underlying data is sampled from the data source versus stored on an exception basis. |
|
Sum |
The Sum Aggregate adds up the values of all good Raw data for each interval. If any non-good values are ignored in the computation, the Aggregate StatusCode will be determined using the StatusCode Calculation. This aggregate is not time based so the PercentGood/PercentBad applies to the number of values in the interval. |
|
TimeAverage |
The TimeAverage Aggregate uses Interpolated Bounding Values to find the value of a point at the beginning and end of an interval. Starting at the starting bounding value a straight line is drawn between each value in the interval ending at the ending bounding value (see examples for illustrations). The area under the lines is divided by the length of the ProcessingInterval to yield the average. Note that this calculation always uses a sloped line between points; TimeAverage2 uses a stepped or sloped line depending on what the value of the Stepped Property for the Variable. If one or more Bad Values exist in the interval then they are omitted from the calculation and the StatusCode is set to Uncertain_DataSubNormal. Sloped lines are drawn between the Good values when calculating the area. |
|
TimeAverage2 |
The TimeAverage2 Aggregate uses Simple Bounding Values to find the value of a point at the beginning and end of an interval. Starting at the starting bounding value a straight line is drawn between each value in the interval ending at the ending bounding value (see examples for illustrations). The area under the lines is divided by the length of the ProcessingInterval to yield the average. Note that this calculation uses a stepped or sloped line depending on what the value of the Stepped Property for the Variable; TimeAverage always uses a sloped line between points. The time resolution used in this calculation is server specific. If any non-good data exists in the interval, this data is omitted from the calculation and the time interval is reduced by the duration of the non-good data; i.e. if a value was bad for 1 minute in a 5 minute interval then the TimeAverage2 would be the area under the 4 minute period of good values divided by 4 minutes. If a sub-interval ends at a Bad value then only the Good starting value is used to calculate the area of sub-interval preceding the Bad value. The Aggregate StatusCode will be determined using the time-weighted StatusCode Calculation. |
|
Total |
The Total Aggregate performs the following calculation for each interval: Total = TimeAverage * ProcessingInterval (milliseconds) Where: TimeAverage is the result from the TimeAverage Aggregate, using the ProcessingInterval supplied to the Total call. The resulting units would be normalized to seconds, i.e. [TimeAverage Units] * milliseconds. The Aggregate StatusCode will be determined using the StatusCode Calculation. |
|
Total2 |
The Total2 Aggregate performs the following calculation for each interval: Total2 = TimeAverage2 * ProcessingInterval of Good Data (milliseconds) Where TimeAverage2 is the result from the TimeAverage2 Aggregate, using the ProcessingInterval supplied to the Total2 call. The interval of Good Data is the sum of all sub-intervals where non-bad data exists; i.e. if a value was bad for 1 minute in a 5 minute interval then the interval of Good Data would be the 4 minute period. The resulting units would be normalized to seconds, i.e. [TimeAverage2 Units] * milliseconds. The Aggregate StatusCode will be determined using the StatusCode Calculation. |
|
VariancePopulation |
The VariancePopulation aggregate retrieves the square of the standard deviation. Its behaviour is the same as the StandardDeviationPopulation aggregate. Unless otherwise indicated, qualities are Good, Calculated.
This calculation is for a full population where the calculation is done on the full set of data. Use VarianceSample to calculate the variance of a subset of the full population. |
|
VarianceSample |
The VarianceSample aggregate retrieves the square of the standard deviation. Its behaviour is the same as the StandardDeviationSample aggregate. Unless otherwise indicated, qualities are Good, Calculated. This calculation is for a sample population where the calculation is done on a subset of the full population. Use VariancePopulation to calculate the variance of a full set of data. |
|
WorstQuality |
The WorstQuality Aggregate returns the worst status of the raw values in the interval where a Bad status is worse than Uncertain, which are worse than Good. No distinction is made between the specific reasons for the status. If multiple values exist with the worst quality but different StatusCodes then the StatusCode of the first value is returned and the MultipleValues bit is set. This Aggregate returns the worst StatusCode as the value of the Aggregate. The timestamp is always the start of the interval. The StatusCodes are Good, Calculated. |
|
WorstQuality2 |
The WorstQuality2 Aggregate returns the worst status of the raw values in the interval where a Bad status is worse than Uncertain, which are worse than Good. No distinction is made between the specific reasons for the status. The start bound calculated using Simple Bounding Values is always included when determining the worst quality. If multiple values exist with the worst quality but different StatusCodes then the StatusCode of the first value is returned and the MultipleValues bit is set. This Aggregate returns the worst StatusCode as the value of the Aggregate. The timestamp is always the start of the interval. The StatusCodes are Good, Calculated. |
Processing Interval[sec]- Enter a resample interval in seconds. It can’t be less than zero. When zero, then one aggregate is calculated for the whole time domain specified as the reader’s start and end times.
File Name - Enter a file name for the output file in the text entry field or click on the ellipsis button [...] which opens a file explorer, allowing you to navigate to your selected file location and enter your preferred file name.
Timestamps in 24 hours format - Click this checkbox if you wish to include timestamps in 24-hour format along with the Hyper Reader data.
Written Values - This field will display the written values as part of the read process.
Start Read - Once you have completed editing your settings, click this button to being the read process.
Stop Read - You can click this button at any time to stop the read process.
See Also: