|
|
The features on this page require a GENESIS64 Advanced license and are not available with GENESIS64 Basic SCADA . |
|
|
The features on this page require a GENESIS64 Advanced license and are not available with GENESIS64 Basic SCADA . |
This Help topic will walk you through configuring a TrendWorX64 Viewer to drill-down, using the new batch commands and event support.
After you have walked through this application note, you will be able to click on a trend viewer bar to drill down into several pre-configured ranges, and right click to drill back up to the previous range.
This configuration could be useful to, for example, quickly display energy usage data per week, per day, and per hour. This example will use smaller time ranges for illustrative purposes, so you will not need as much logged data to see the results in action.)
We will set up three time ranges for the trend viewer:
One hour
Ten minutes
One minute
Each time a sample is clicked, the viewer will drill down to the next smallest range, and when the viewer is right clicked it will drill up to the next biggest range.
We'll add a trend viewer and configure some basic settings to get started.
Open a GraphWorX64 screen and add a TrendWorX64 Viewer.
Using the Properties panel, give the TrendWorX64 Viewer the name of TWX.
Open the viewer configuration.
Select the Plot object in the tree.
Choose a Plot Type of Bars.
Select the Chart object in the tree.
Ensure that the Chart tab is selected.
Uncheck the box for Context Menu.
Go to the Range tab.
Enable Start Frozen.
If desired, select the Pen in the tree and choose a different pen. Ideally, you will have at least ten minutes of data logged. If you keep the default pen, make sure your Hyper Historian logger is running.
We will use events to write the start, end, and interval of the trend viewer to some points for easy visibility.
Open the trend viewer configuration, if it's not already open.
Select the Chart object in the tree and make sure the Chart tab is selected.
Find the section titled Events and enable the box in this section.
Events Section
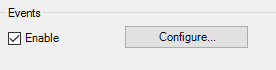
Click on the Configure button in this section. The Control Events Configuration window will open.
Change the drop down for the Event field to Time Range Updated.
Add an item to the Action section and choose the Write Value command.
Configure the command with these settings:
|
PointName |
@sim64:String.Static("Start").Value |
|
ValueType |
String |
|
Value |
{{x=tostringculture(todatetime({{@@chart.starttime}}))}} |
Select your existing write value command and use the Duplicate button to add two more write value commands.
Select the second write value command and update these settings:
|
PointName |
@sim64:String.Static("Interval").Value |
|
Value |
{{x={{@@chart.timeinterval}}}} |
Select the third write value command and update these settings:
|
PointName |
@sim64:String.Static("End").Value |
|
Value |
{{x=tostringculture(todatetime ({{@@chart.endtime}}))}} |
Select OK and Close.
Add three process points to your display for these three points:
@sim64:String.Static("Start").Value
@sim64:String.Static("Interval").Value
@sim64:String.Static("End").Value
We will be using the batch command's conditional execution to ensure that we move only the appropriate level (from one hour to ten minutes, or from ten minutes to one minute).
Open the trend viewer configuration, if it's not already open.
Select the Chart object in the tree and make sure the Chart tab is selected.
Select the Configure button in the Events section.
Change the drop down for the Event field to Sample Click.
Add a new action and choose Batch.
Add a new step to the batch command.
Configure the first step with these settings:
|
Name |
StepHourTo10Minutes |
|
Execute Conditionally |
Yes |
|
Condition |
x={{@@chart.timeinterval}}=="1 Hour" |
|
Action |
Command |
|
On Success |
Quit |
|
On Fail |
Quit |
|
On Condition Fail |
Go to Next step |
For the Command, choose Edit Trend Chart with these settings:
|
SelectedProperties |
ChartInterval ChartStart ChartTickInterval ChartTimeFormat SamplingInterval |
|
SamplingInterval |
1 Minute |
|
ChartStart |
{{x=todatetime({{@@sample.timestamp}})-fromminutes(5)}}
|
|
ChartInterval |
10 Minute |
|
ChartTimeFormat |
Short |
|
ChartTickInterval |
1 Minute |
|
Target |
TWX |
Click OK to the Configure Command dialog.
Select the StepHourTo10Minutes command and select the Duplicate button.
Change the second command with these settings:
|
Name |
Step10MinutesTo1Minute |
|
Condition |
x={{@@chart.timeinterval}}=="10 Minute" |
|
On Condition Fail |
Quit |
Edit the Edit Trend Chart command with these settings:
|
SamplingInterval |
10 Second
|
|
ChartStart |
{{x=todatetime({{@@sample.timestamp}})-fromseconds(5)}} |
|
ChartInterval |
1 Minute |
|
ChartTimeFormat |
Long |
|
ChartTickInterval |
10 Second |
Click OK, OK, and Close.
Go into runtime and observe that you can now click on a bar to drill down.
In this section, we will configure the right-click to drill up through those same three ranges.
Go into configure mode.
Open the trend viewer configuration, if it's not already open.
Select the Chart object in the tree and make sure the Chart tab is selected.
Select the Configure button in the Events section.
Change the drop down for the Event field to Right Click.
Add a new action and choose Batch.
Add a new step to the batch command.
Configure the first step with these settings:
|
Name |
Step1MinuteTo10Minutes |
|
Execute Conditionally |
Yes |
|
Condition |
x={{@@chart.timeinterval}}=="1 Minute" |
|
Action |
Command |
|
On Success |
Quit |
|
On Fail |
Quit |
|
On Condition Fail |
Go to Next step |
For the Command, choose Edit Trend Chart with these settings:
|
SelectedProperties |
ChartInterval ChartStart ChartTickInterval ChartTimeFormat SamplingInterval |
|
SamplingInterval |
1 Minute |
|
ChartStart |
{{x=todatetime({{@@chart.starttime}})-fromminutes(5)}} |
|
ChartInterval |
10 Minute |
|
ChartTimeFormat |
Short |
|
ChartTickInterval |
1 Minute |
|
Target |
TWX |
Click OK to the Configure Command dialog.
Select the Step1MinuteTo10Minutes command and select the Duplicate button.
Change the second command with these settings:
|
Name |
Step10MinutesTo1Hour |
|
Condition |
x={{@@chart.timeinterval}}=="10 Minute" |
|
On Condition |
Fail Quit |
Edit the Edit Trend Chart command with these settings:
|
SamplingInterval |
10 Minute |
|
ChartStart |
{{x=todatetime({{@@chart.starttime}})-fromminutes(25)}} |
|
ChartInterval |
1 Hour |
|
ChartTimeFormat |
Long |
|
ChartTickInterval |
10 Minute |
Click OK, OK, and Close.
Go into runtime and observe that you can now click on a bar to drill down and right click on a bar to drill back up. You should be able to use click and right click like this to navigate between the 1 hour, 10 minutes, and 1 minute levels.
See Also:
TrendWorX64 Viewer Configuration Ribbon
Configuring TrendWorX64 Viewer
