In AlarmWorX64 Viewer, you can configure the display of alarms for inclusion in a runtime display. Before you can create a display of alarms using AlarmWorX64 Viewer, you must understand the options that are available to you so that you can plan your display. There are three levels in an alarm display's configuration:
The Viewer (or display) Level, of which there is only one
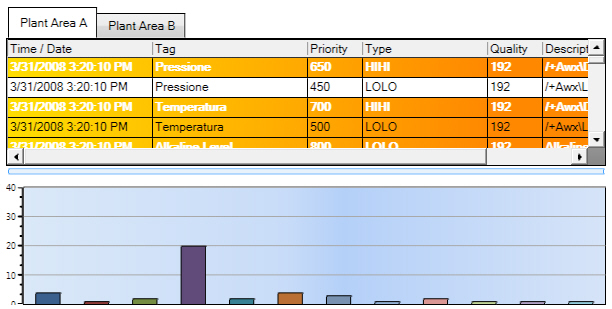
Tab Level. You can add as many tabs as you need for the display. In the example below, there are two tabs: Plant Area A and Plant Area B. By providing individual tabs, you can group alarms by physical location, by function, by department, or by any other separation you have a need for.
Grid and Chart Level. To each tab, you can add any number of grids and charts. In the example below, the Plant Area A tab shows one grid at the top, and one chart at the bottom. Grids displays the alarms and are where operators can acknowledge them; Charts provide summary and aggregate data for your review.
Sample of an AlarmWorX64 Viewer, with Two Tabs, and Showing a Grid and a Chart
|
|
Warning. Not all AlarmWorX64 features are supported in Microsoft Silverlight. If you are saving Silverlight files, refer to Silverlight Files in GENESIS64 for more information. |
This topic describes how to open an existing display of alarms, and how to create a new display, and includes instructions for configuring each level of the display.
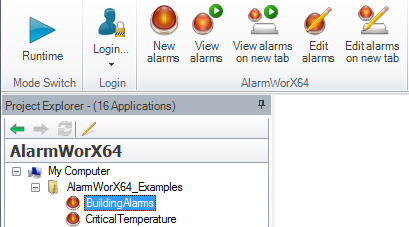
To Configure an AlarmWorX64 Viewer in the Workbench:
In the AlarmWorX64 provider, click the Home menu button and click the AlarmWorX64 Viewer's icon. This loads an AlarmWorX64 Viewer into the Workbench with a tab called New Alarms.
On the New Alarms tab, click the File menu then select Open.
Navigate to and select the project file that contains the alarm display.
Click the OK button.
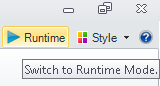
You can use the AlarmWorX64 Viewer Button drop-down menu to create a new display, edit an existing display, view the alarms in runtime, or create or edit an alarm on a new tab. This drop-down menu is part of the ICONICS Viewers tab group in the Home ribbon.
The AlarmWorX64 Viewer gets alarm updates from real-time alarms that are configured in the AlarmWorX64 Server. The server is the source of the real-time alarms that you will be connecting to. You can set up an alarm viewer that connects to all alarms defined in the local AlarmWorX64 Server, or (more likely) you can create alarm subscriptions that each individual grid and chart in the viewer connects to. In the same way, you can also connect to historical alarms that are logged by an AlarmWorX64 Logger, either by connecting the grid or chart to the local logger or by connecting to individual alarm subscriptions on the logger. But before you do this, you must create the viewer and set up each of its tabs, with each tab's grids and/or charts. Once you have set up the viewer, you can connect each grid and chart to its alarms.
The remainder of this topic provides instructions for:
Select the alarm tab you are working with.
Click the AlarmWorX Configurator ribbon.
Click the Configure Viewer button on the left hand side of the AlarmWorX64 Configuration ribbon.
The AlarmWorX64 Viewer Configurator appears with the AlarmWorX64 Viewer object selected in the tree and the object's Appearance and Advanced tabs showing on the right. In the tree, you can see that AlarmWorX64 automatically adds at least one tab and one grid (also called a view). You can alter the display of the AlarmWorX64 Viewer control, tab, or grid objects. You can also add more tabs and grids, and you can add charts; but only the grid object has the connection to an alarm event source (called a subscription). How to work at each level is described below.
To Configure the AlarmWorX64 Viewer Control:
Click the AlarmWorX Viewer at the top of the tree.
Use the Appearance and Advanced tabs to design it.
These can be overridden at lower levels in the display. For a description, refer to Display Options.
To Add a Tab to the Display and Configure it:
Right-click the AlarmWorX Viewer at the top of the tree.
Hold your cursor over Add, then select Tab.
To configure the tab, select the tab in the tree control, then use the Appearance and Advanced tabs to design it.
To Add a Grid, Chart, List, or Flip to a Tab and Configure it:
Click the tab that will contain the grid, chart, list, or flip. (Note that you can also add a grid or chart to a grid or chart.)
Click the down arrow on the Add button as shown below, then select Grid, Chart, List, or Flip.
Add a Grid, Chart, List or Flip to the AlarmWorX64 Viewer

To configure the grid or chart, select it in the tree view. On the right side of the dialog box, tabs appear. For detailed information, refer to Grid Options or Chart Options. Note that the steps for connecting a grid or chart to alarms using the Source tab are described below.
To Configure an Alarm Source (an Alarm Subscription):
Use the Source tab to configure alarm sources for the grid. Real-time data is data being generated from data sources and polled by the FrameWorX server. Historical data are alarms stored in a database for future replay. Note that you can mix the two source types on a tab: for example, you can have one grid that shows real-time data while a second grid on the same tab might display historical alarms.
|
|
Note: You can repeat these steps to add as many subscriptions as you need in the subscription list. The list is automatically saved each time you add a server endpoint. |
To configure the alarm source for a grid or chart (that is, to add an alarm subscription), click the Grid, Chart, List, or Flip object in the tree control. The Source tab appears on the right side of the configurator, as shown below.
The Source Tab of the AlarmWorX64 Viewer Configurator,
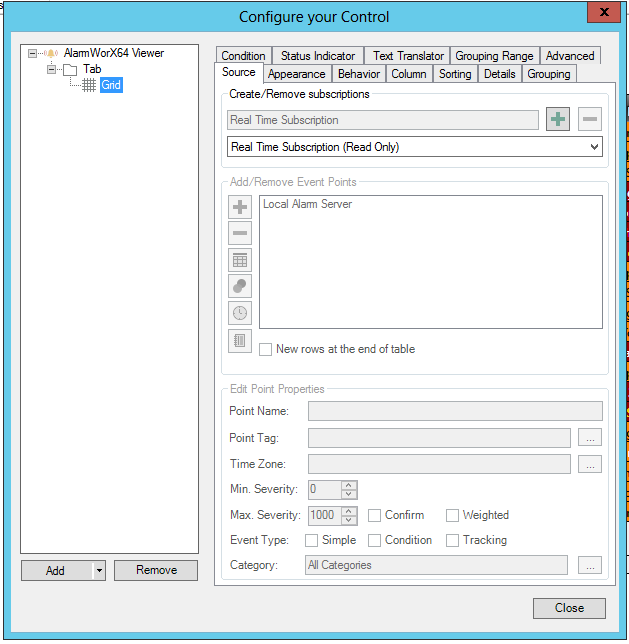
In the Create/Remove subscriptions section, use the drop-down list at the top of the Source tab to select any of the following:
Real Time Subscription (Read Only) gets all alarms from the Local Alarm Server. If this is what you want, select it and you are done using this tab.
Event Subscription (Read Only) gets all events from the Local Alarm Server. If this is what you want, select it and you are done using this tab.
Historical Subscription (Read Only) gets all historical alarms from the Local Logging Server. If this is what you want, select it and you are done using this tab.
<New...> lets you create a new subscription. If this is what you want, select it and proceed to Step 3.
In the field at the top of the tab, enter a name for the subscription object. Make sure the name accurately describes the alarm you are subscribing to.
Click the Plus button ![]() next to that field to create that object. If you select Real-Time, then proceed to Step 6.
next to that field to create that object. If you select Real-Time, then proceed to Step 6.
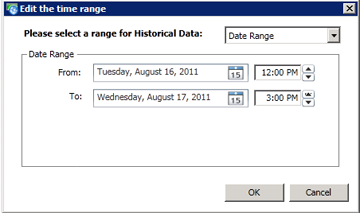
For an Historical alarm, click the following button ![]() on the left side of the Add/Remove Event Points section of the Source tab to edit the time range for the Historical Subscription data that you wish to store in the SQL database, either: Today; Current Shift; Date Range; Last Days; Previous Shift; or Single Day.
on the left side of the Add/Remove Event Points section of the Source tab to edit the time range for the Historical Subscription data that you wish to store in the SQL database, either: Today; Current Shift; Date Range; Last Days; Previous Shift; or Single Day.
If you select Single Day, Date Range, or Last, you need to specify the time range. For example, for the Date Range, fill in the To and From fields that define the beginning and end of the Date range, as shown in the figure below.
Defining a Date Range in the Time Range Section
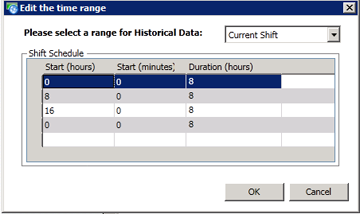
If you select either Current Shift or Previous Shift, the Shift Schedule dialog box, shown below, opens. Fill in the shift info (start time [hour/minute] and duration) and click the OK button, then go to Step 7.
Shift Schedule Dialog Box
Click the Plus button ![]() that is in the Add/Remove Event Points box. This opens the OPC UA browser, which is shown below.
that is in the Add/Remove Event Points box. This opens the OPC UA browser, which is shown below.
Navigate to and select the alarm server that you want to subscribe to as shown in the figure below. Notice that an available alarm server displays the word Subscribe in the Attributes column.
Select an Alarm Source or Creating a Subscription in the OPC UA Browser
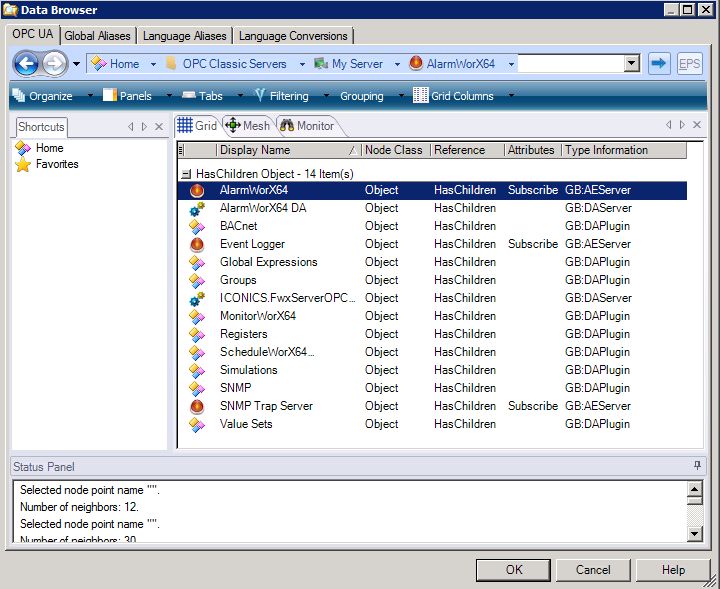
Double-click the server and then open the folder containing the alarms you wish to subscribe to, and select the alarm.
Click the OK button to close the browser and connect your subscription object to its data source, which is called a point. This returns you to the Source tab.
You can repeat this step to add any additional points to appear in the grid.
There are two check boxes in the Add/Remove Even Points box:
Do Not Delete Rows, Just Clear the Fields: In the viewer, when a new alarm condition exists, the alarm appears in the grid. When the alarm condition no longer exists (and, if acknowledgement is required, after acknowledgement has been given), if you leave this box unchecked ![]() , the alarm disappears from the grid and no evidence that the alarm existed remains in the grid. However, if you put a check mark
, the alarm disappears from the grid and no evidence that the alarm existed remains in the grid. However, if you put a check mark ![]() in this box, the alarm will disappear but its empty row will remain in the grid giving runtime users an indication that the alarm was there. Runtime users can clear these empty rows by clicking the Clear button on the AlarmWorX64 viewer's runtime ribbon (which is described in Alarm Runtime Operations).
in this box, the alarm will disappear but its empty row will remain in the grid giving runtime users an indication that the alarm was there. Runtime users can clear these empty rows by clicking the Clear button on the AlarmWorX64 viewer's runtime ribbon (which is described in Alarm Runtime Operations).
Put New Rows at the End of the Table: In the viewer, when a new alarm condition exists, the alarm is added to the grid. If you put a check mark ![]() in this box, the new alarm will be added to the bottom of the grid, unless a filter prevents the alarm from inclusion in the grid.
in this box, the new alarm will be added to the bottom of the grid, unless a filter prevents the alarm from inclusion in the grid.
To rename the point or to add a filter for the real-time or historical point path:
In the Add/Remove Edit Points box, click on the point to select it.
Click the Filter button ![]() . The opens the Filter dialog box.
. The opens the Filter dialog box.
To give the point a new name, enter it into the Name field.
Create the filter. For more information, refer to Configuring Filters for Alarm Grids and Charts.
When you are done, click OK.
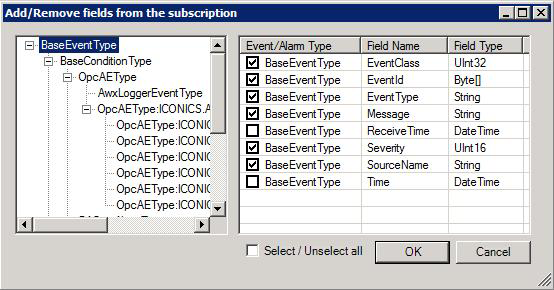
Not all fields are collected with the alarm subscription. To add or remove fields from the alarm:
In the Add/Remove Edit Points box, click on the Fields Editor button ![]() . This opens the "Add/Remove fields from the subscription" window, as shown below.
. This opens the "Add/Remove fields from the subscription" window, as shown below.
Select the fields to be captured in the alarm. Note that selecting all of the fields is highly inefficient. For that reason, select only those fields that you need in order to collect alarm information. A default set is selected for you.
Click OK when you are done.
Add/Remove Fields from the Subscription
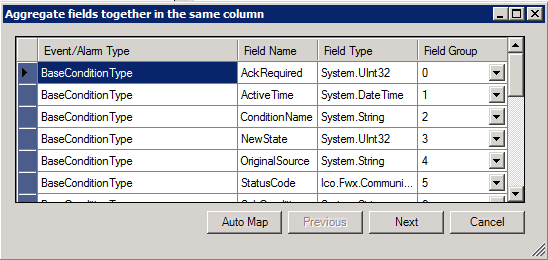
Clicking the Mapping Editor button ![]() in the Add/Remove Edit Points box brings up the Aggregate fields together in the same column window. You can assign Column Map numbers for selected Event Types/Event Names/Types via the pulldown menus in the Column Map column (last column on the right). Or, click on the Auto Map button to automatically assign Column Map numbers to listed Event Types/Event Names/Types. Click OK to save your settings and close the window.
in the Add/Remove Edit Points box brings up the Aggregate fields together in the same column window. You can assign Column Map numbers for selected Event Types/Event Names/Types via the pulldown menus in the Column Map column (last column on the right). Or, click on the Auto Map button to automatically assign Column Map numbers to listed Event Types/Event Names/Types. Click OK to save your settings and close the window.
Aggregate fields together in the same column window
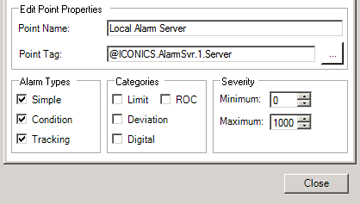
For a real-time data point, you can limit the alarm subscription to certain event types and alarm categories. The Edit Point Properties section of the tab, shown below, allows you to provide a Point Name, select a tag (via the data browser by clicking on the ellipsis [...] button), set Alarm Types (Simple, Condition or Tracking), set Categories (Limit, ROC, Deviation or Digital) and set Severity (via text entry field or up/down buttons for Minimum or Maximum thresholds).
Edit Point Properties Section
You can continue editing other configuration tabs at this time, or click on the Close button to save your settings.
Click the Runtime button to view your functioning alarm viewer with live or real-time alarm data displayed in the window. Click here for an example.
|
|
Note: For detailed descriptions of the Appearance and Advanced tabs, refer to Appearance Tab Options and Advanced Display Options (AlarmWorX). For a description of other grid options, refer to Grid Options in AlarmWorX. For a description of other options for a chart, refer to Chart Options (AlarmWorX). |
See Also: