|
|
The features on this page require a GENESIS64 Advanced license and are not available with GENESIS64 Basic SCADA . |

![]()
|
|
The features on this page require a GENESIS64 Advanced license and are not available with GENESIS64 Basic SCADA . |
![]()
When viewing trend data in runtime within TrendWorX64 Viewer, you can get a report that lists statistics relating to the data each pen is writing. You can give the report a title and can specify what, if any, heading information you want included in the report.
Headings in the report include each point name and description that appear in the chart, the number of samples taken over the trend period and used in the statistics, the average value for the trend period, the minimum and maximum values for the trend period, and the standard deviation for the trend period.
You can print it or save the report or its content to a file. You can export the report to one of the following file formats: HTML, DHTML, PDF, Excel, Tiff, RTF, or CSV. The format you choose determines how the data is formatted. For example, if you save the data to an Excel or CSV format, it is stored in columns; but when saved to an HTML or PDF format, the data is formatted as a the report you see in the dialog box below.
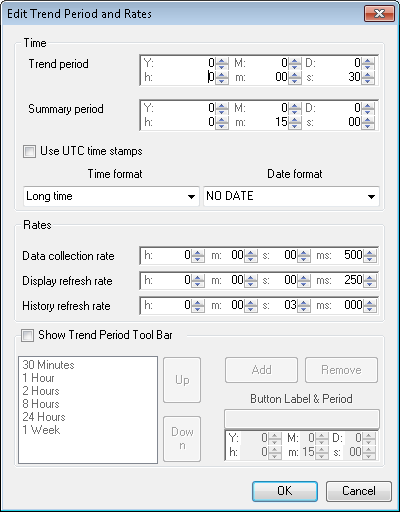
To set the length of the trend period before running the statistics report:
Click the Period button on the runtime TrendWorX ribbon ![]() or the corresponding button on the TrendWorX toolbar
or the corresponding button on the TrendWorX toolbar![]() . This opens the Edit Trend Period and Rates dialog box. (Note that this button is described in detail in the Runtime Operations in TrendWorX topic.)
. This opens the Edit Trend Period and Rates dialog box. (Note that this button is described in detail in the Runtime Operations in TrendWorX topic.)
Change the value in the Trend Period field by clicking the up and down arrows or by entering the desired value next to each time period label (Y = years, M = months, D = days, h = hours, m = minutes, and s = seconds). For example, setting the m label to 01 and all other labels to 0 (or 00) means that the trend period is one minute long. To collect statistics for the past hour, change the h label to 1 and all other labels to 0 (or 00).
Click OK to close the dialog box.
Follow the steps below to see the statistics report.
|
|
Note: You can also select a specific trend period by clicking on the corresponding button on the Trend Period Tool Bar. |
To set the data collection rate before running the statistics report:
Click the Period button on the runtime TrendWorX ribbon ![]() or the corresponding button on the TrendWorX toolbar
or the corresponding button on the TrendWorX toolbar![]() . This opens the Edit Trend Period and Rates dialog box. (Note that this button is described in detail in the Runtime Operations in TrendWorX topic.)
. This opens the Edit Trend Period and Rates dialog box. (Note that this button is described in detail in the Runtime Operations in TrendWorX topic.)
Change the value in the Data Collection Rate field by clicking the up and down arrows or by entering the desired value next to each time period label (h = hours, m = minutes, s = seconds, and ms = milliseconds).
Click OK to close the dialog box.
Follow the steps below to see the statistics report.
To run a report of pen statistics for the trend period:
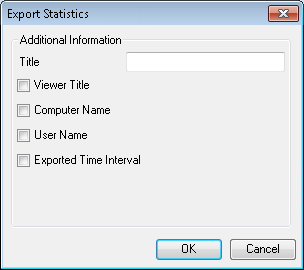
Click the Statistics button  on the runtime TrendWorX ribbon. This opens the Export Settings dialog box so you can add a title, and select options to appear in the statistics report that is produced. These options include: the Viewer Title as it appears in the TrendWorX64 Viewer Configurator, the Computer Name, the User Name of the user generating the report, and the Exported Time Interval of the data from the chart that appears in the report.
Click OK. The report appears in a window.
Sample Pen Statistics for Four Pens in a Trend Chart
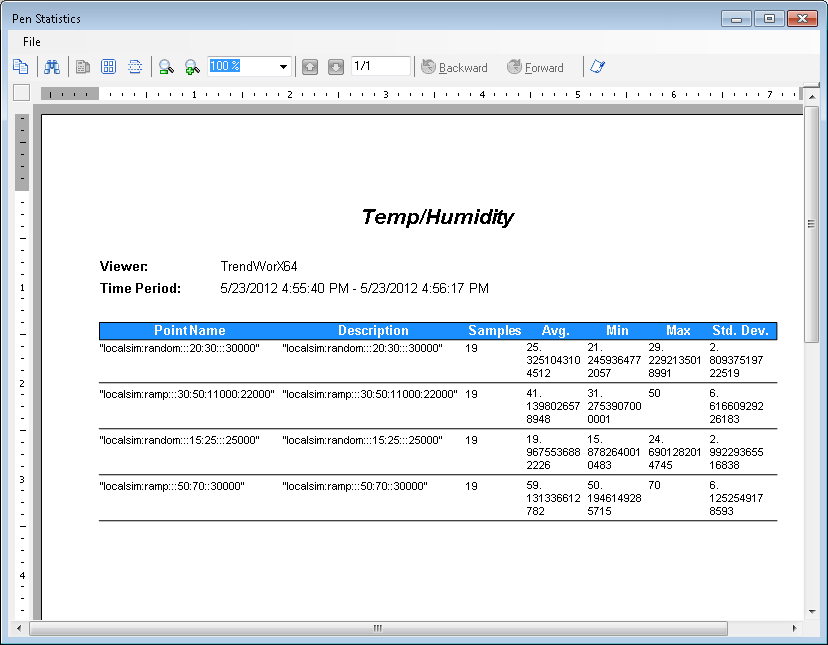
Print or review the report. Tips for working with the report are provided in the TrendWorX Report Viewer topic.
See also: