|
|
The features on this page require a GENESIS64 Advanced license and are not available with GENESIS64 Basic SCADA . |

![]()
|
|
The features on this page require a GENESIS64 Advanced license and are not available with GENESIS64 Basic SCADA . |
![]()
You may see trend data that you want to export for use or import into another program. During runtime, you can display the data that appears in the TrendWorX64 Viewer into a report.
To Run the Report:
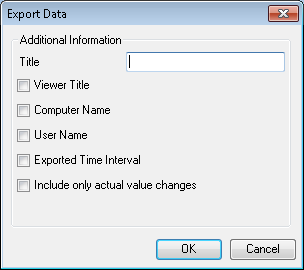
Click the Export Data button ![]() on the runtime TrendWorX ribbon. The Export Data dialog box appears.
on the runtime TrendWorX ribbon. The Export Data dialog box appears.
Use the Export Data dialog box to provide a title for the report. Enable the check boxes below to show the Viewer Title as it appears in TrendWorX64 Viewer Configurator, the Computer Name, the User Name of the user generating the report, the Exported Time Interval of the data from the chart that appears in the report, and/or the actual value changes of the trend.
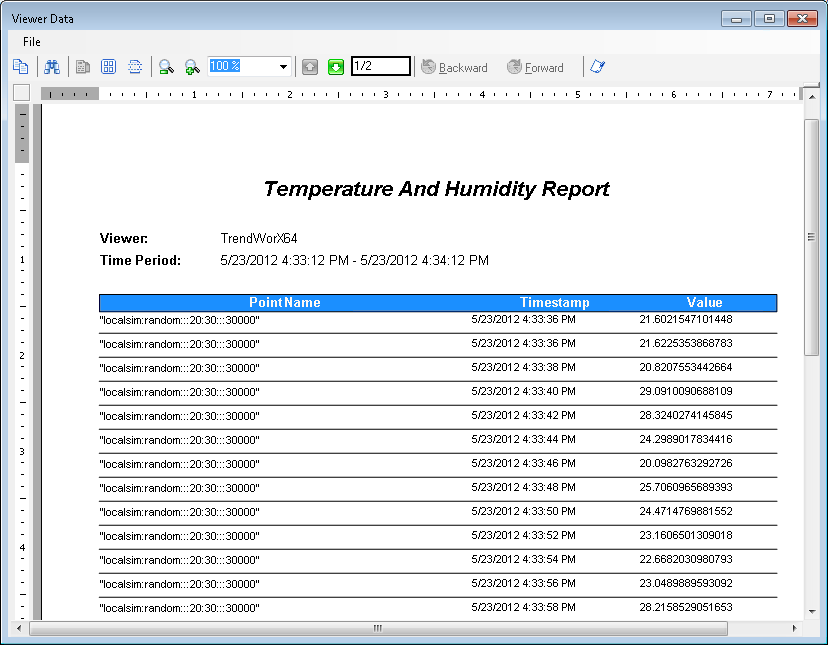
Click OK. The Viewer Data report appears.
|
|
Note: Data for the first enabled pen over the exported time interval will appear at the top of the report, followed by data for each other enabled pen within the selected chart. |
Print or review the report. Additional tips for working with the report are provided in the TrendWorX Report Viewer topic.
You can print it or save the report or its content to a file. You can export the report to one of the following file formats: HTML, DHTML, PDF, Excel, Tiff, RTF, or CSV. The format you choose determines how the data is formatted. For example, if you save the data to an Excel or CSV format, it is stored in columns; but when saved to an HTML or PDF format, the data is formatted as seen in the image below.
Report of Trend Data from the TrendWorX Viewer
See also:
Runtime Operations in TrendWorX