
Home > Hyper Historian > Hyper Historian > Hyper Historian Tools > Hyper Historian Tools
Hyper Historian suite contains a set of standalone tools which were designed to help maintaining Hyper Historian logger service. These tools can be found in the component folder under the following names:
- HistoryReader.exe
o Allows to read historical values and aggregated values from any plant historian server and stores results in a text file.
- HistoryEraser.exe
o Allows to delete historical values from plant historian server (server must allow this action)
- CalculationAnalyzer.exe
o Tool to analyze performance calculation process – functional equivalent to perf. calculation analyzer in Workbench but doesn’t need workbench infrastructure.
- HHSplitter.exe
o Hyper Historian logger storage files management tool.
Next sections will focus on each of these tools in a more detailed way.
It is a simple tool to read historical datal and aggregated values. It stores them in a textual file. Its binary name is HistoryReader.exe and it uses the FrameWorX communication infrastructure to access historical values. Besides investigating what values have been logged or aggregated, this tool is also suitable for verification of historical data accessibility in the Genesis64 ecosystem. The following picture shows the main History Reader layout.
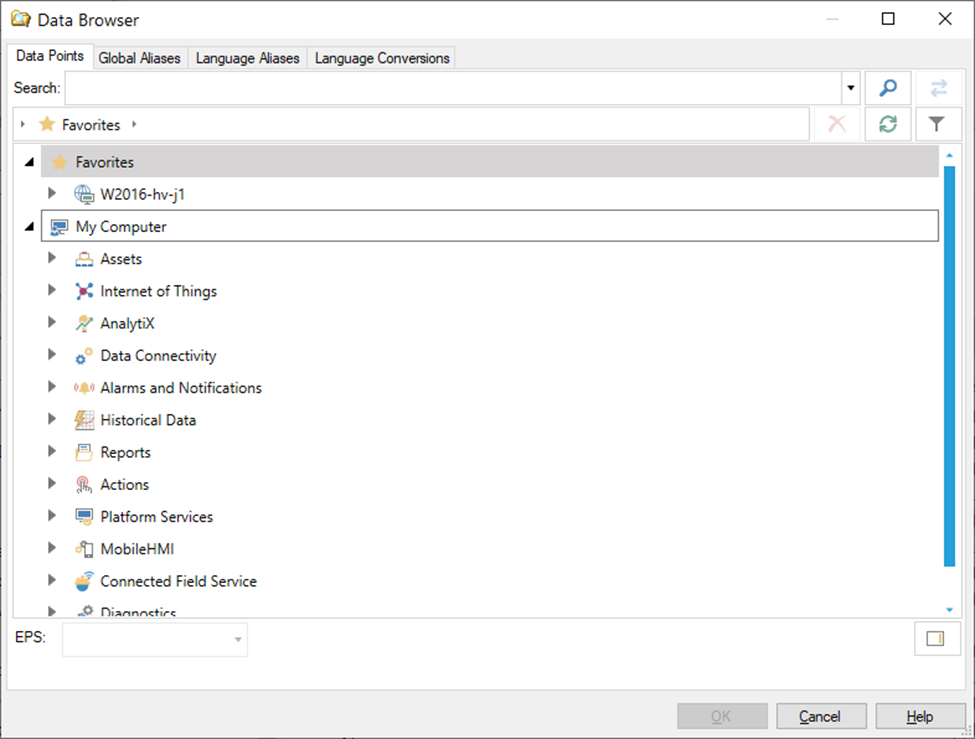
As a first thing, the point name to read historical values from, must be specified. The syntax of a data point must follow FrameWorX syntax. To simplify the process of selecting a data point name, standard ICONICS’s Data Browser can be used (opened by clicking on button with three dots).
Typically plant historian servers store and operate historical values in UTC times. Hyper Historian is not an exception in this concept. This checkbox allows to use local computer time zone settings to convert specified start and end times to UTC times. The returned value timestamps are converted from UTC to local time, too. Thus, when this checkbox is checked, the reader application aligns historical reads with local computer time.
Defines a time domain for each historical values export. To specify these times standard windows calendar controls are used.
If this option is selected, the reader reads all logged samples stored within the specified time domain. If “Include Boundary Vales” checkbox is selected, two more samples are added to output dataset – one sample prior (or equal) to start time and one sample next (or equal) to end time. If such samples do not exist, it always adds a sample with BadNoBound value status and the timestamp equal to either start or end time.
If "Aggregate Data Export" is selected, two additional parameters must be specified – the aggregate name and the processing interval. The aggregate name can be either chosen from a set of predefined names (these names follow up OPC UA – part 13 specification), or it can be typed in. Please note that the support of such aggregates is server specific. However, Hyper Historian supports all the predefined aggregates.
The processing interval defines the granularity of value aggregation. Value 0 specifies that single aggregated value will be calculated out of all values in the specified time domain. In all other cases, the specified time domain is divided by processing interval and aggregated values are calculated for each sub-interval.
A file name where historical values should be stored. This field cannot be empty. The output values are stored in a text file formatted in a very simple way. The first couple of lines are dedicated to basic export information, such as point name, start, and end times followed by the exported values. The exported values consist of a timestamp (date, time in seconds and millisecond part), actual value, data type and status code. These sub-values are delimited by the TAB character.
If this checkbox is checked, the time portion of a timestamp is exported in the 24 hour format. Otherwise, the 12 hour format is used.
They are only an informative field displaying the number of exported values. It is updated while the export is in progress.
Start Read starts the actual export. If some setting is missing or is already started, a popup error dialog is displayed. Stop Read Button can be used to stop the read operation in cases the read time domain was specified too wide and the exporter exports too many values, suitable especially for read raw values where the number of output values cannot be estimated by exporter settings.
Tip: To estimate # of output values for read raw, use aggregate “Count” with “Processing interval” set to zero. This will return a single sample value with a count of stored historical values in the specified time domain.
The configuration parameters, such as point name, start, and end times can be passed as command line arguments to the History Reader tool. The first argument is the Point Name, the second is the Start Time and the last the End Time. The arguments must be separated by a space character. The texts containing spaces must be wrapped by double-quotes characters.
HistoryReader.exe "hh:\Configuration\Calc:=NoisyRamp"
HistoryReader.exe "hh:\Configuration\Calc:=NoisyRamp" "3/24/2022 4:50 PM"
HistoryReader.exe "hh:\Configuration\Calc:=NoisyRamp" "3/24/2022 4:50 PM" "3/25/2022 12:00 AM"
Another simple data modification tool is HistoryEraser.exe. It allows for deleting of historical values from plant historian servers. This function must be supported by a connected historian server. This function is supported by Hyper Historian. However, FrameWorX security can block this operation. Hyper Historian server also has the option to disable all client-side modifications (Logging Server(s) – Disable HDA editing checkbox). If editing is disabled, the eraser tool cannot delete the samples too.
As mentioned in the previous section, the eraser tool can operate on any historian server accessible via FrameWorX infrastructure.
Since this tool allows to delete all samples within the specified time domain persistently, it should be used with care and by system administrators only.
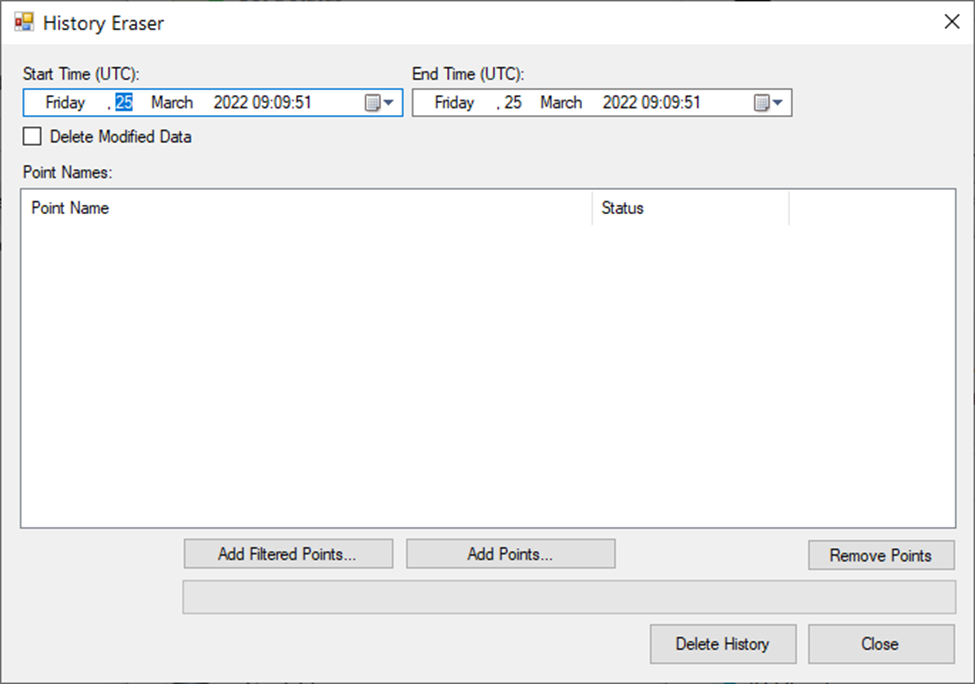
Specifies time domain to erase values from. Standard windows calendar controls are used.
Plant historians (including Hyper Historian) usually do not change the existing value. Instead of this, these values are hidden by a new value. If the most recent value are deleted, the previous value may appear again. In case that the deleting of all values is required, the delete must be performed in two steps: the first with “Delete Modified Data” checked and then the same delete with this checkbox unchecked. If any value was previously updated, it should be sufficient to delete the history with the unchecked “Delete Modified Data” checkbox.
The most important part for deleting history is to select the correct data points. There are multiple ways how to do it.
For filtered inserts, the “Add Filtered Points...” button can be used. Once the button is clicked, the following dialog appears:
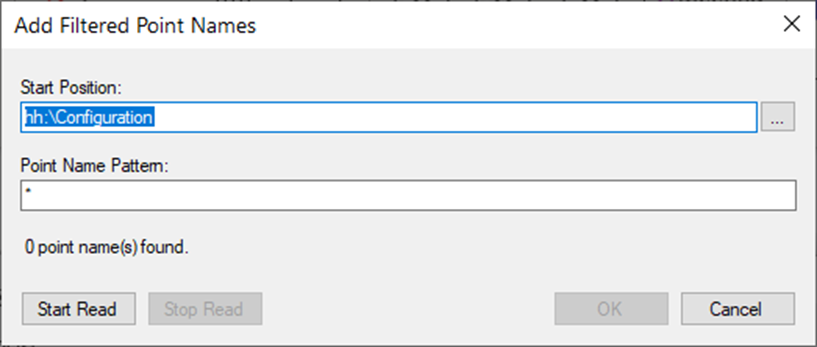
Specify start position – either type in the point path codded in a FrameWorX friendly syntax, or use a standard data browser to select the correct point folder.
Use the point name pattern – standard wildcard characters can be used (*?).
As the last step, click on the “Start Read” button – it starts browsing the server specified in the start position and inserts all data point names that complies to “Point Name Pattern”.
Use the “Add Points...” button to invoke a standard data browser and select (a) data point(s) to delete history. In this mode, the browser allows a multi-selection of data points to insert.
This function is activated by clicking on the “Remove Points” button, It deletes all data point names selected in the “Point Name” list view control.
If all data points are chosen, and the time domain is specified, the current delete data operation starts by clicking on “Delete History” button. Its progress is shown in the progress bar, which is located between the "Data Point Names Manipulation" button and the "Main History Eraser" button.
Unlike the previously described tools, this analyzer tool is specific for Hyper Historian only. This tool was designed as a debugging tool for performance calculations. It is very similar to the embedded ICONICS Workbench analyzer tool ( which can be seen on page Analyzer in every performance calculation form). However, its main advantage is that it is a standalone tool, independent of the Workbench infrastructure. The only prerequisite that is necessary for a successful analysis is to have a working FrameWorX connection with the analyzed Hyper Historian server. In this case, this tool can analyze any Hyper Historian’s performance calculation available in the FrameWorX network. Since calculation analysis is performed by the Hyper Historian server, the Hyper Historian services must be up and running. This tool also supports an off-line calculation analysis. It allows for loading of a calculation trace file. This can be useful if the calculation analysis file is generated on a production server and if it is sent out to technical support for further investigation.
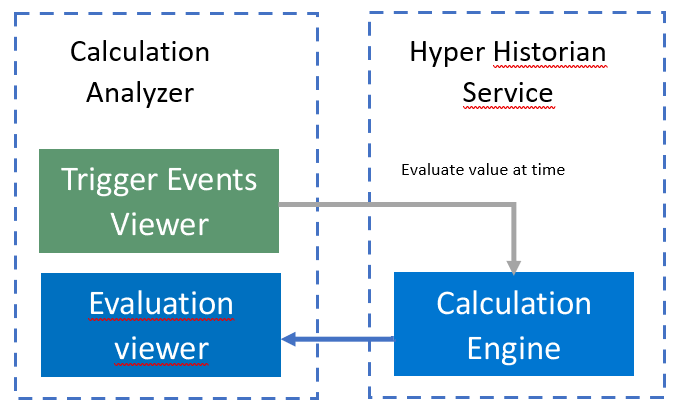
The following picture shows the Calculation Analyzer data flow.
Calculation Analyzer Layout:
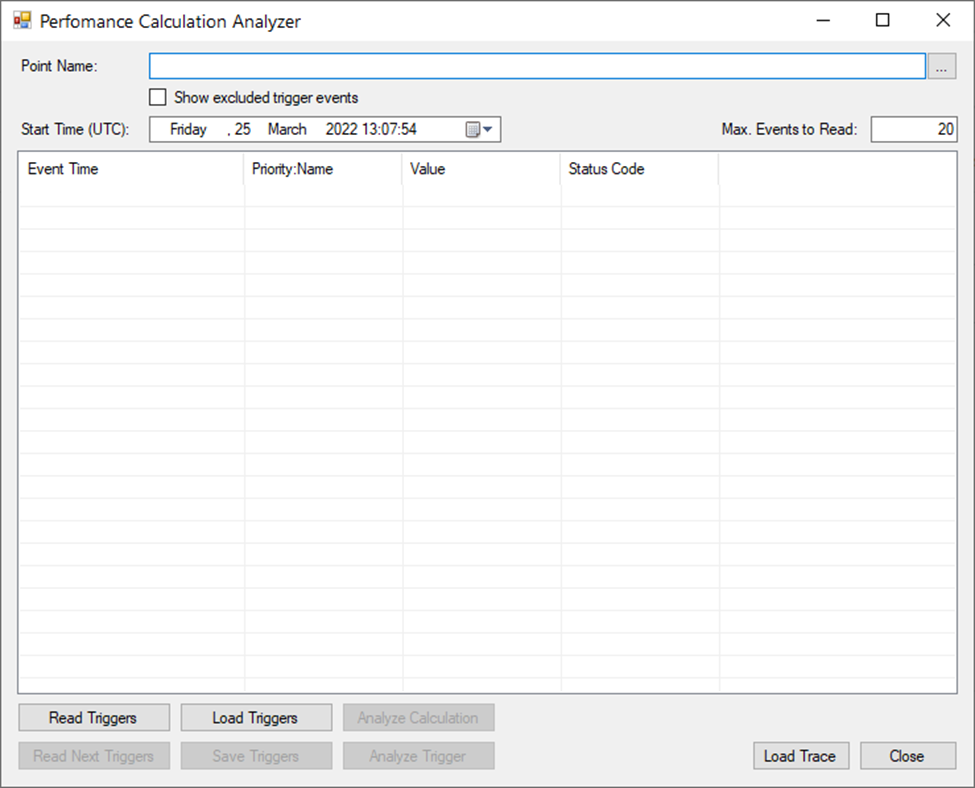
Either type in a calculation data point name or browse for it using a standard data browser. If a point name is not a valid performance calculation point name, the reading of calculation triggers or actual calculation analysis fails.
Once the data point name is specified, the first logical step is to get calculation triggers – i.e., events when the actual calculation is supposed to run. All available trigger events will appear in the list view in the middle of the ”Calculation Analysis” dialog. First, specify a start time (in UTC) to search for the closest trigger event. Then # of the returned trigger events can be limited by “Max. Events to Read” value. By default, it reads 20 trigger events. Once these parameters are specified, click on the “Read Triggers” button to perform the first trigger events read. When the first N triggers are read, the “Read Next Triggers” button should be enabled, It allows to read the next N trigger events. These trigger events can be persistently stored in a file by clicking on the “Save Triggers” button. Such files can be loaded back later for further investigation by clicking on the “Load Triggers” button.
Trigger events can be based on time, triggered by historical values, or filtered by evaluation expressions (it can be a combination of historical values coming from different historical data points). Since the expression may filter out incoming data value changes, it is sometimes useful to also see the events which were filtered out by the expression-based filter. To do so, just check the “Show Excluded Trigger Events” checkbox. Such triggers then appear in the list view in red color. Every expression-based trigger event can be analyzed as well by selecting such event in the list view and clicking on the “Analyze Trigger” button (Shift+Enter or Shift+Double-click should be a shortcut for this action).
This action can be either on-line or off-line. For off-line analysis, just click on the “Load Trace” button and select a calculation analysis trace file. The on-line analysis requires to have some triggers already loaded and one of them must be selected. Then, by clicking on the “Analyze Calculation” button (Enter or Double-click are shortcuts for this action), the actual calculation analysis is invoked – it sends a request to a running Hyper Historian server, and it calculates the value again at a specified trigger time. Once it is evaluated on the server, the analyzer traces are sent back to the analyzer tool.
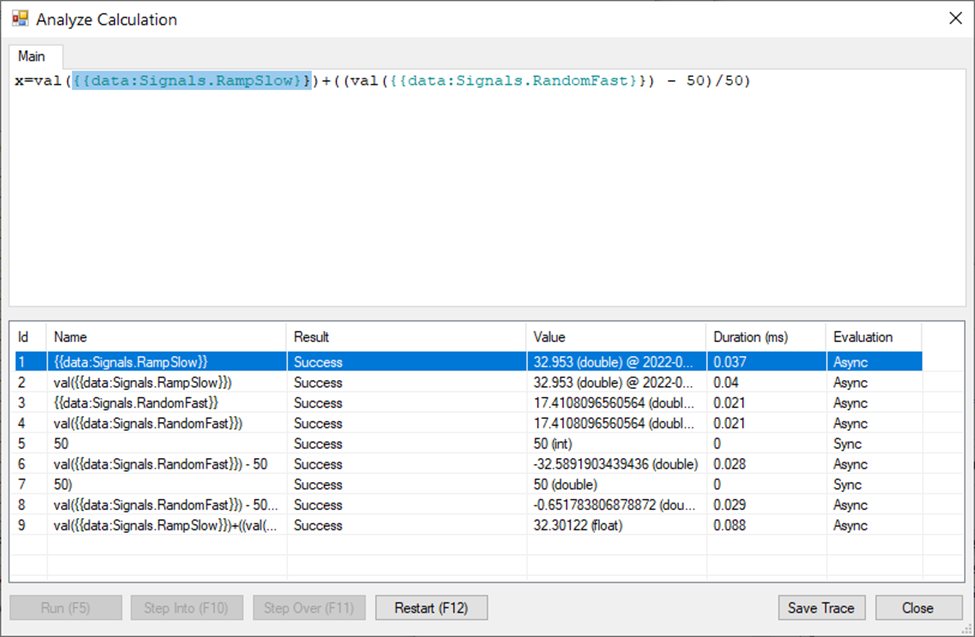
The result of the calculation analysis is then shown in the following dialog:
This dialog supports the saving of a trace file – the same file that can be loaded using the “Load Trace” button visible in the main analyzer dialog.
When the “Analyze Calculation" dialog is shown, click on the “Run” button to show the complete evaluation stack. If a step-by-step evaluation is preferred, the “Step Into” or “Step Over” buttons can be used. If a performance calculation uses custom calculation functions, the used functions appear as additional tabs in this dialog. Selecting any line in the list of evaluation steps also highlights the related part of the expression text in the upper part of this dialog.
Each evaluation step displays the evaluation result, the actual value returned (including quality and data type), the approximate evaluation time (it may differ from production evaluation but it may provide at least some idea of what is slow and what is not that important). Sync evaluations are always faster than Async evaluation, and evaluation type is visible in the last column of the evaluation list.
The “Restart” button returns this dialog to its initial state – the “Run” and “Step…” buttons are enabled again.
The “Close” button just closes this dialog.
This dialog is resizable (including the splitting line between the actual expression and the evaluation list) and new sizes are remembered until the analyzer tool is running (i.e., not persistently stored).
The parameters, such as point name, start time and max. events to read can be passed as command line arguments to the Calculation Analyzer tool. The first argument is Point Name, the second is Start Time and the last is Max. Events to Read. The arguments must be separated by a space character. The texts containing spaces must be wrapped by double-quotes characters.
CalculationAnalyzer.exe "hh:\Configuration\Calc:=NoisyRamp"
CalculationAnalyzer.exe "hh:\Configuration\Calc:=NoisyRamp" "3/24/2022 4:50 PM"
CalculationAnalyzer.exe "hh:\Configuration\Calc:=NoisyRamp" "3/24/2022 4:50 PM" 55