|
|
The features on this page require a GENESIS64 Advanced license and are not available with GENESIS64 Basic SCADA . |

![]()
|
|
The features on this page require a GENESIS64 Advanced license and are not available with GENESIS64 Basic SCADA . |
![]()
The CFSWorX AnalytiX Dashboard helps to provide insight into worker responses to alarms and faults. This powerful tool helps with dispatching the proper field worker and ensuring that items are being responded to in a timely manner.
The CFSWorX AnalytiX Dashboard and the related configuration files can be easily deployed by using a Workbench package file.
Open the Workbench, then right-click on MyProject in the Project Explorer and choose “Unpack Project”.
You will need to locate and select the following package file:
C:\Program Files\ICONICS\GENESIS64\AnalytiX Dashboards\CFSWorX_AnalytiX_Pack_10.96.2.pkgx
In the “Find and Replace” section, you should fill in your machine name as shown below. Use your machine name in place of “myServer”. This machine name will be used in the dashboard displays contained in the package. If your machine is configured for https connection, then you can use https rather than http.
For more details on using the Workbench Unpack feature, see Unpack Project.
Your settings should look similar to this:
Unpack Settings
On the next screen you can see all the configurations in the project being unpacked. The Hyper Historian and BI Server configurations contain settings that are used in this example for Worker Path Replay.
Additional Unpack Settings
Note: The SQL Server and Catalog should be your current active databases.
On the final screen, you will see the Project Files that will be deployed to disc. You should ensure that all of the files are checked. Then push the Unpack button to finish.
Project Files to be Deployed
Refresh the Workbench Project Explorer tree. You should see the BI Server, Hyper Historian, MobileHMI, and Project Files configurations.
The BI Server configurations shown below are used to as data sources that are needed to view data in the dashboards. Analysis of worker responses, geofence events, and worker path replay are all handled by the BI configurations shown below.
BI Server Configuration
This configuration is used to log the historical position data for the sample workers. Then it can be used for the Worker Path Replay function. See Setting Up Worker Path Replay for more details.
Hyper Historian Configuration
This configuration contains the sample geofences for the Foxboro area. These geofences can be displayed on a map. And they can be used to generate events when workers cross in or out of a geofence. See Geofencing Alarms for more details.
Follow the instructions in Geofencing Alarms.
Follow the instructions in Setting Up Worker Path Replay.
The AnalytiX dashboard for CFSWorX provides a way to help manage alarms and faults in your system. You can analyze the CFSWorX alarm and fault response data from the workers. Additionally, you can analyze the position information of workers to help improve operations.
The following pages are available in the dashboard.
Navigation Tree
Overview
Dispatch
Worker Schedule
Event Analysis
Region Analysis
Worker Monitoring
Remote Assistance
Read below for a detailed description of each page.
Please ensure that you have completed all the previous steps, including the setup and verification of mobile device health. Much of the information in the dashboard is related to the GPS position of workers, which must be setup before being able to see the information in the dashboard.
The Navigation Tree is a panel that can be expanded or collapsed to see the assets that are configured in the system. It is intended to be used with the Dispatch page.
The Overview page provides a quick overall view of the CFSWorX system. It includes Key Performance Indicators (KPIs) showing the number of active and unacknowledged alarms, number of scheduled workers, and number of workers in geofences. There is a live alarm viewer, list of worker responses, pie chart showing response types, and an alarm list for geofence events.
Overview Page
The Dispatcher page contains a Map showing the assets and any current alarms for those assets. It also shows the workers in their current position. Using the Navigation Tree, you can view the assets that are configured in the system. In this demonstration version, you can right-click on an asset such as “Lift Station 1” and choose to “Trigger Alarm”. The alarm will appear in the Active Events list at the bottom of the page. Clicking on the event will focus the map on the selected asset and populate the Event Details in the top right section. The Worker Assignment section shows the available workers sorted by the person closest to the selected asset. You can click the Assign button to update the alarm state, assigning the selected worker to this alarm. The Event History shows all state changes in the selected alarm, including all worker responses.
Dispatcher Page
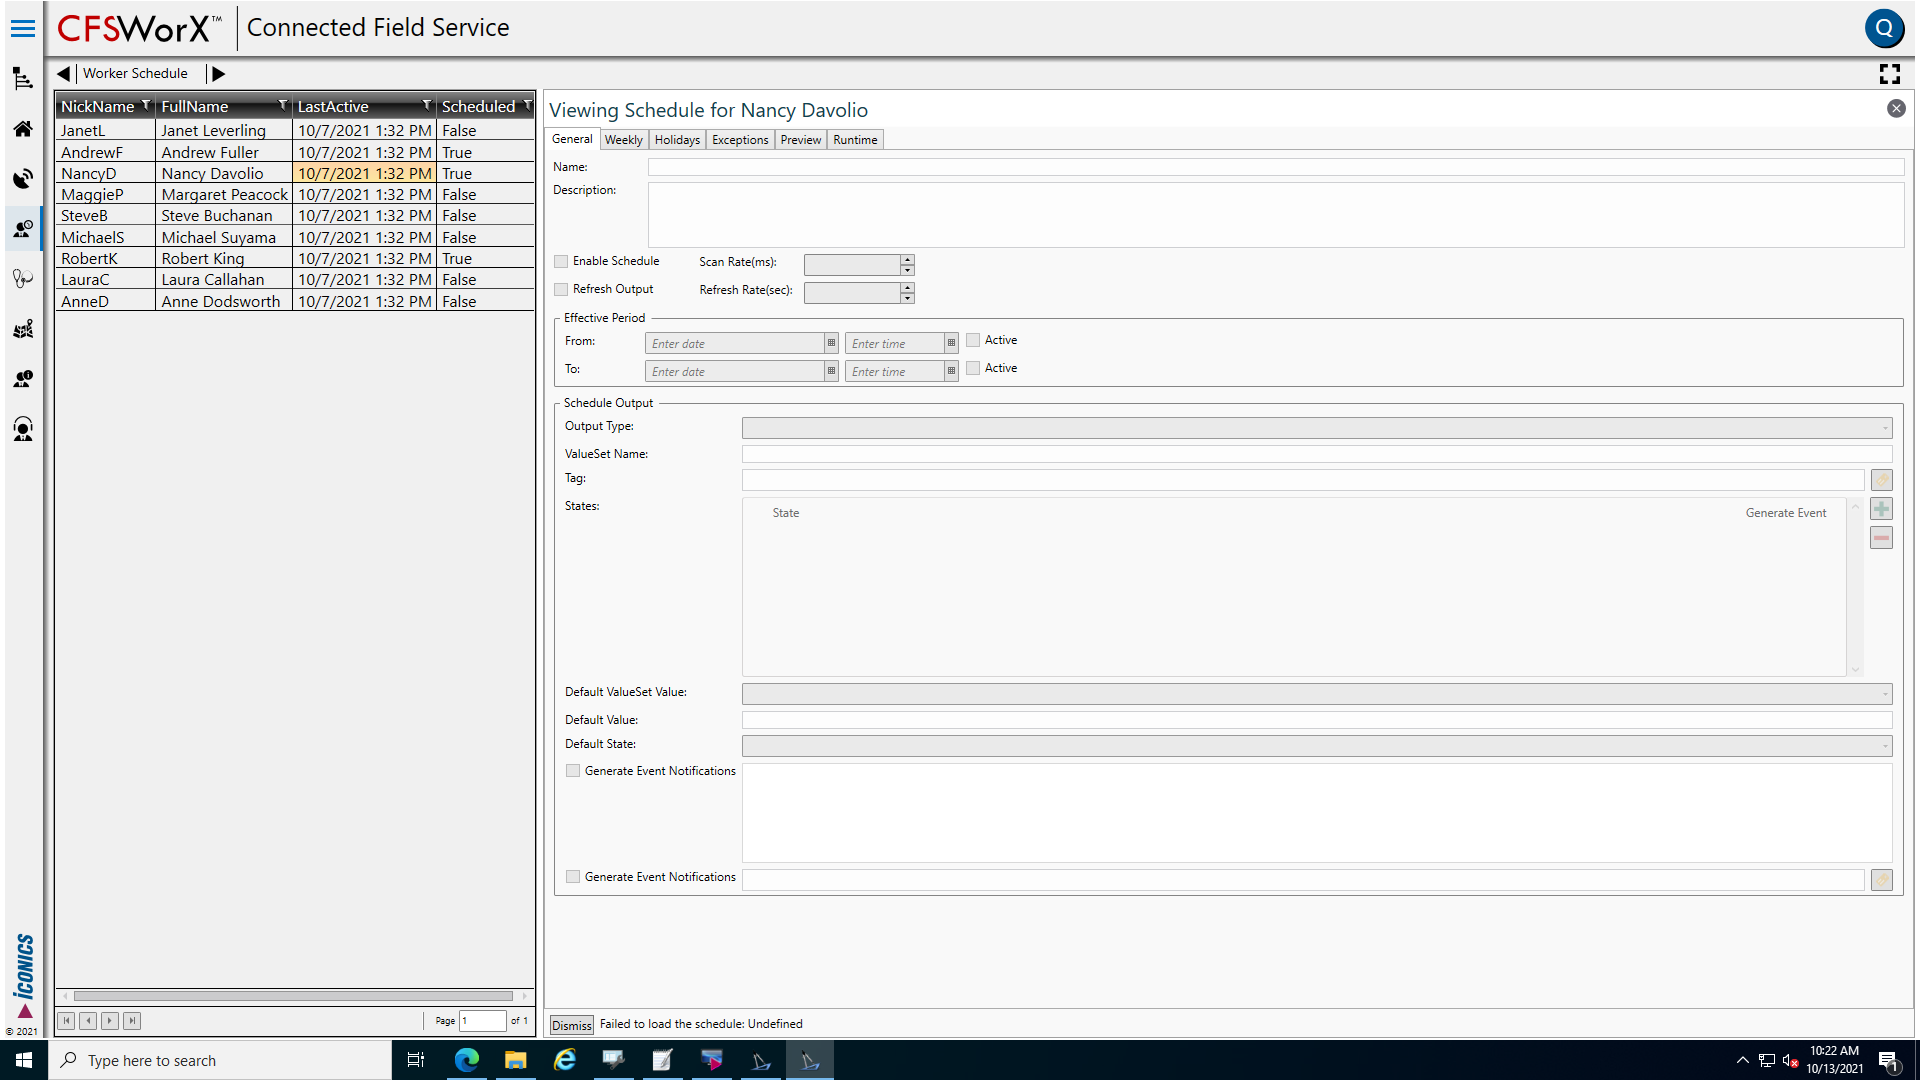
The Worker Schedule page is used to show a list of workers and their associated schedules. This page is only compatible with ICONICS schedules, not 3rd party schedules from Dynamics 365 or other sources. To view a worker's schedule simply click on the worker's name in the list. This will cause the schedule to be loaded on the right side of the display. You can view and even make changes and save the schedule.
The Event Analysis page is used to analyze worker responses to events (alarms or faults). On the left there are various Filters: OriginalSource, Worker, and Response. These filters support single and multi-selection, and can be cleared. The controls on the right side will all be updated when the filters change.
Average Response Times by Worker: shows the average number of minutes between the activation of an alarm and when the response was received from the worker, grouped by worker name.
Average Response Time by Source: shows the average number of minutes between the activation of an alarm and when the response was received from the worker, grouped by source name.
Response Count per Worker: shows the number of responses (of any type) received from each worker.
Response Types per Worker: shows the number of responses of each type by each worker.
Worker Responses: this list shows all of the actual responses received.
Event Analysis
The Region Analysis page is designed to help analyze worker GPS position data and the related geofence alarm information. On the left side there are filters for Worker names, geofence Crossing Type (enter or exit), Alarm ChangeMask, Geofences, and Event Time. The filters will affect the charts and list to the right.
Geofence Crossings Per Worker: shows the number of events related to workers entering or leaving a geofence. The filters can be used to analyze specific crossing types, workers, fences, etc.
Completed Events Total Minutes: shows the total number of minutes that each completed event was active. Note: active events are not included, those are displayed on the next dashboard Worker Monitoring.
Region Analysis
The Worker Monitoring page shows the current position of each worker on a map, and the geofences in the displayed region. With this page you can see the latest information about each worker’s position.
The Worker and Fence ID filters on the left side apply to the Time in Fence and Active Workers in Geofences widgets.
Active Events: the alarm viewer on the top of the page shows all the active geofence events.
Map: shows the position of each worker and the geofences that are visible on the map currently.
Time in Fence (min): shows the number of minutes that the worker has been inside all current geofences.
Active Workers in Geofences: shows the detailed information about worker geofence events. This includes the TimeFromActivationMinutes, which shows how long the worker has currently been inside a specific geofence.
Worker Monitoring Page
This page displays the Expert Application login page for the Remote Expert function. After logging in as an expert, you will be able to receive calls from remote technicians to share video feeds and help guide workers through onsite issues. See Remote Expert Mode for more information.
See Also: