Hyper Historian Quick Start
Hyper Historian is configured through the GENESIS64 Workbench, an integral part of both Hyper Historian and ICONICS GENESIS64 64-bit, OPC-integrated, Web-enabled HMI/SCADA suite. Workbench is loaded as part of the Hyper Historian installation and is a multi-functional, centralized, Web-based environment for product configuration. The Workbench can also act as an advanced operator interface for visualization and service management and has integrated layout/project management and remote, pack-and-go deployment capabilities.
This topic describes How to Configure Hyper Historian and How to View Hyper Historian Data.
How to Configure Hyper Historian
Hyper Historian is configured using the Workbench, a centralized project management application for GENESIS64. After installation, Hyper Historian works “out of the box” and there is not much configuration to do. Let’s take a look at the configuration.
- Open the Workbench by going to Start > All Programs > ICONICS > GENESIS64 > Workbench.
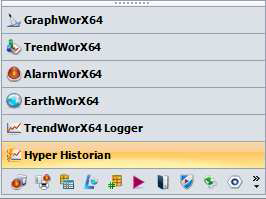
- Once you are in the Workbench, select Hyper Historian in the Project Explorer (or, if hidden, you can click on the Hyper Historian icon in the button bar at the bottom).
Figure 1 - Hyper Historian in the Project Explorer
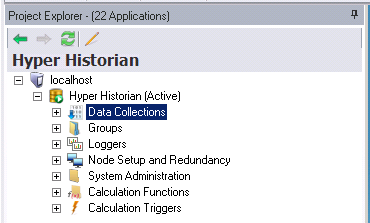
- Once you select the application, you can expand the configuration tree in the Project Explorer, as shown below.
Figure 2 - Hyper Historian Configuration Tree
NOTE: If you see nothing in the Project Explorer after selecting Hyper Historian, it is possible that your security level blocked it. In this case, click the padlock icon  in the lower left corner of the Workbench, and select Log in/Log out to bring up the security login dialog to log in as a user with permissions.
- Expand the Loggers tree. By default, there are a few loggers already configured. Most are memory persistent loggers and one is a File Based Logger. A memory persistent logger keeps most of the information in RAM and only logs data to file when certain events occur. A File Based logger, on the other hand, always logs data to a file.
- Since Hyper Historian works out of the box, you do not need to change anything. But be aware that the logger configurator is where you can set up how long to keep data in a single file, and when to archive data.
- Next, take a look at the Data Collections and Groups sections. Again, default logging groups are pre-configured in the sample configuration database.
- Expand the Groups node and double-click Logging Group to open it on the current tab, making sure that you have applied the settings, if you made any changes. In the Logging Group, you can associate your logger, as well as specify a condition for starting data collection. If no condition is specified, data collection begins when you start the Hyper Historian Logger. You do not have to change anything for the Logging Group because Hyper Historian works out of the box.
- Expand the Logging Group branch. Here are two collector groups (called Collecting data group and OPC UA Collecting) and an aggregation group (called Aggregation). The following steps focus on collector groups. For information on the aggregate group, refer to the Aggregate Groups topic.
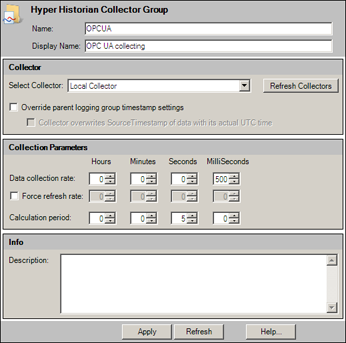
- Double-click the OPC UA collecting collector group to open it. Here, you can select the collector that the collector group belongs to, as well as the data collection rate (which is the sampling rate) and the calculation period used for tag aggregates that you will add to the group’s tags. Again, you can leave the settings here alone. However, if there is a different rate at which you would like to collect data samples, feel free to change it in the Data collection rate section.
Figure 3 - Hyper Historian Collector Group
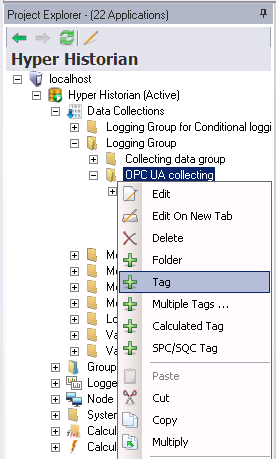
- Within the Data Collections node, and by selecting the same OPC UA collecting collector group, you can add tags to the group or add a folder to organize your tags. Expand the OPC UA collecting group and you should see a few tags associated here, as well as a folder.
- If you wish to, you can delete the tags and folder and add your own. Otherwise, you can just add the tags you are interested in.
- Right-click on the OPC UA collecting group and select the Tag option.
Figure 4 - Adding an OPC Tag
- Enter a name for the new Hyper Historian Tag.
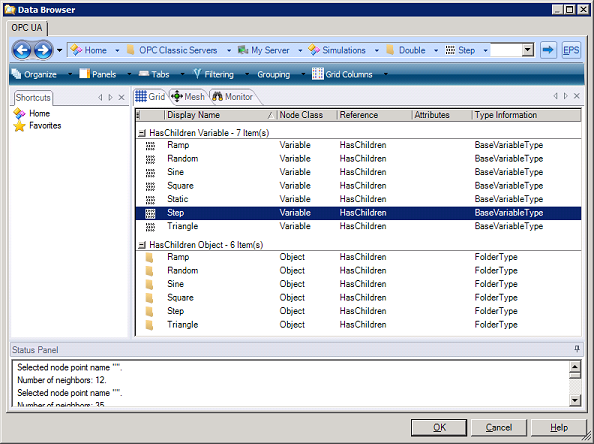
- Enter a Signal Name or click on the Signal Name field’s ellipsis button […] to select an OPC tag from the Data Browser.
Figure 5 - Selecting an OPC Tag
- Once you have added the Signal Name (the OPC tag to trend on), you can leave the settings as default.
- If you want the ability to add comments to the Hyper Historian tag while viewing it in the Trend Viewer, check the option to 'Support Operator Annotations'.
Figure 6 - Hyper Historian Tag Configuration
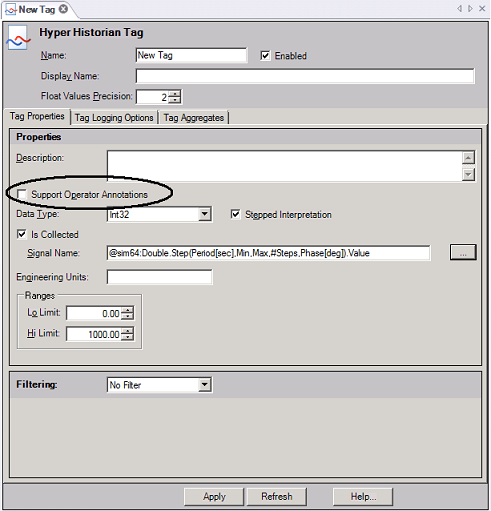
- Once you are done with the pen configuration, click Apply to save the settings.
- You can repeat steps 12-17 to add more tags. Or you can try the Multiple Tags option to add many OPC tags at once.
- Note that we didn't create any calculated tags in this example. If you would like to create one, refer to the Calculated Tags topic for more information.
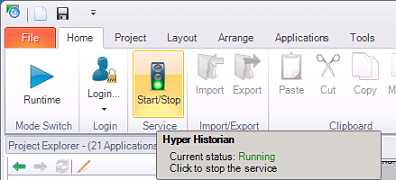
- When you are done configuring your tags, start the service by clicking on the traffic light in the Service section of the Home ribbon so that it becomes green.
Figure 7 - Hyper Historian Running
At this point you are done configuring Hyper Historian and you have started logging data.
How to View Hyper Historian Data
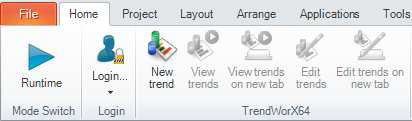
- While you are in the Workbench, click on TrendWorX64 in the Project Explorer. The ribbon's Home tab should look something like Figure 9.
Figure 8 - Ribbon with TrendWorX64 Selected
- Click the New Trend button on the ribbon's Home tab to open a new TrendWorX64 display. A new trend will open and the ribbon's TrendWorX64 Viewer Configuration tab will appear.
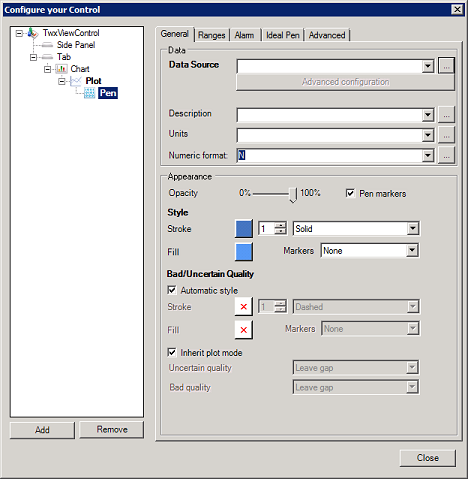
- Click the Configure button on the ribbon's TrendWorX64 Viewer Configuration tab to open the Configure Your Control dialog.
Figure 9 - Configure Button
- Right-click on Chart and select Add > Plot.
- Right-click on Plot and select Add > Pen.
- Select the new Pen object and, on the General tab, click the ellipsis […] button next to the Data Source field on the right.
Figure 10 - New Pen Configuration
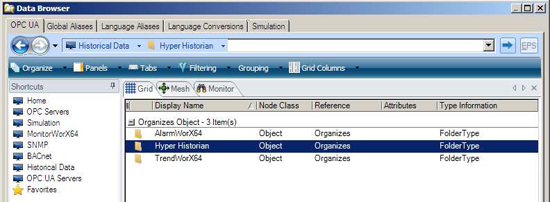
- The Data Browser opens.
- Select Historical Data. Then double-click Hyper Historian on the right.
Figure 11 - Hyper Historian in the Data Browser
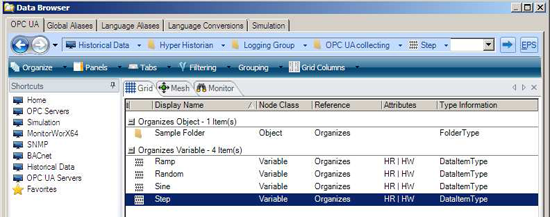
- Double-click the Logging Group, the Data Collector Group (OPC UA collecting), and the folders as they appear, until you see the Hyper Historian tags you have configured.
Figure 12 - Hyper Historian Tags
- Click the tag you want to see data for and click OK in the Data Browser.
- In the Configure Your Control dialog, you should see your tag path in the Data Source field. It should look something like the example in Figure 13.
Figure 13 - Tag Path Format
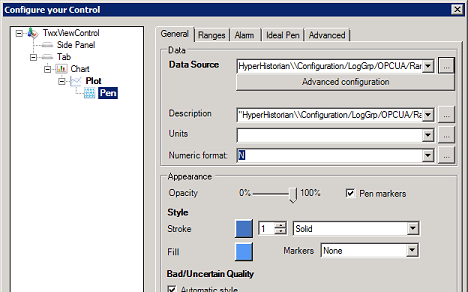
- Feel free to add more tags and configure their appearance if you wish before you exit the 'Configure Your Control' dialog.
- Click Close to close the dialog.
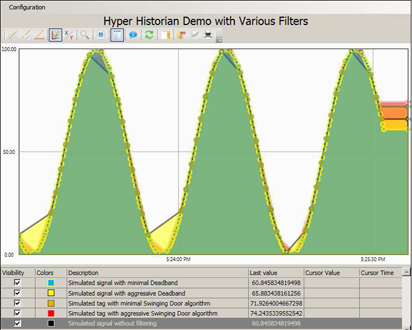
- Click the Runtime button (above the ribbon to the right) to see your data.
Figure 14 - Sample Hyper Historian Data
See also:
Opening Hyper Historian in the Workbench
Configuring the License Mode
Initial Setup
Starting and Stopping the Hyper Historian Service