|
|
The features on this page require a GENESIS64 Advanced license and are not available with GENESIS64 Basic SCADA . |

![]()
|
|
The features on this page require a GENESIS64 Advanced license and are not available with GENESIS64 Basic SCADA . |
![]()
The Visualizer tab, shown below, directs users to the IoTWorX Visualizer, which will open in a new tab or window, utilizing ICONICS KPIWorX technology.
NOTE: IoTWorX Visualizer is distributed as a separate IoT Edge Module. If the module is not part of the IoTWorX Modules deployed on your IoT device, then IoTWorX Visualizer will not be available.
ICONICS IoTWorX - Visualizer Tab
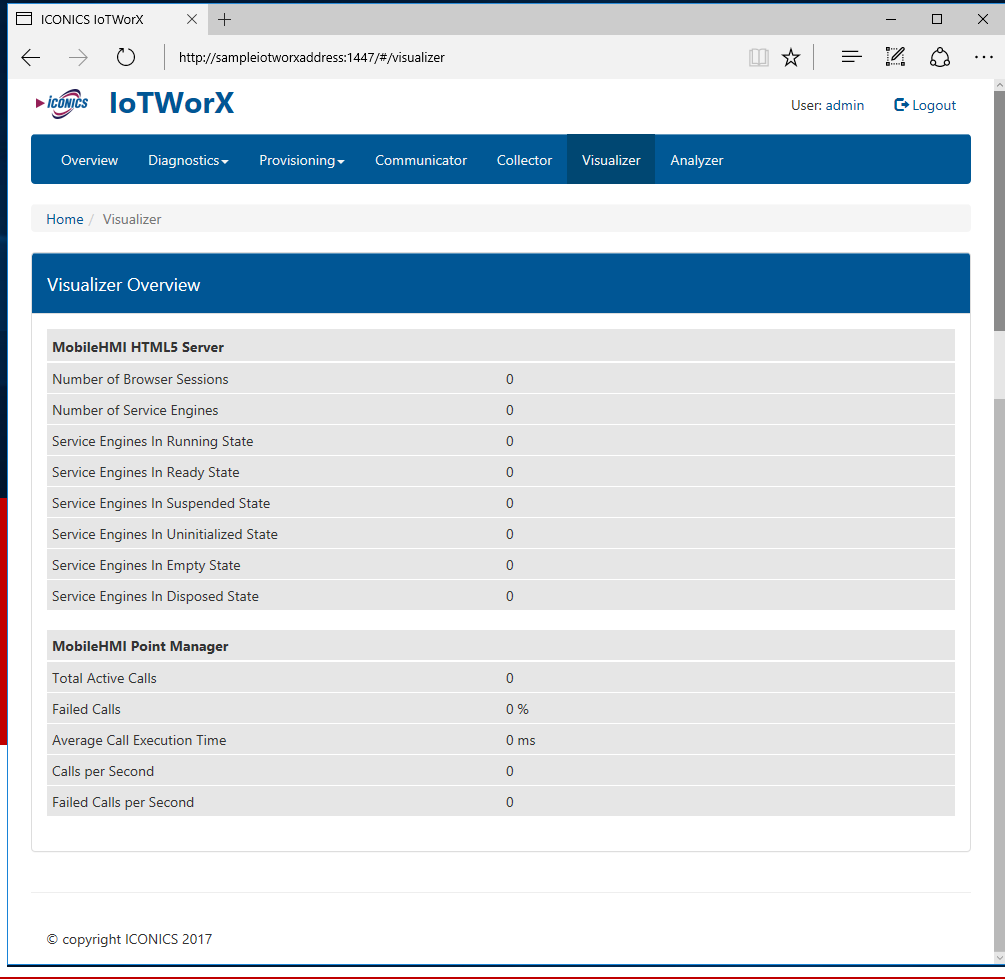
Maximum running instances of IoTWorX Visualizer -Enter a number in the text entry field. This limits the number of clients that can open IoT Visualizer concurrently.
Save Settings -Once you have finalized your settings, click on this button to save your settings.
A new widget, the KPI Process Point, allows the IoT Visualizer users to write to points. Writing to points can be secured with the new security features for IoTWorX. See Support for ICONICS Security and Support for Security.
The Visualizer can now be secured. Security can be configured for an edge device to require users to log into the Visualizer to access certain functionality. See Support for ICONICS Security for more details about security in IoTWorX edge devices.
A new widget, the alarm viewer, allows Visualizer users to see GenEvents. See Support for GenEvents for more details about GenEvents in IoTWorX edge devices.
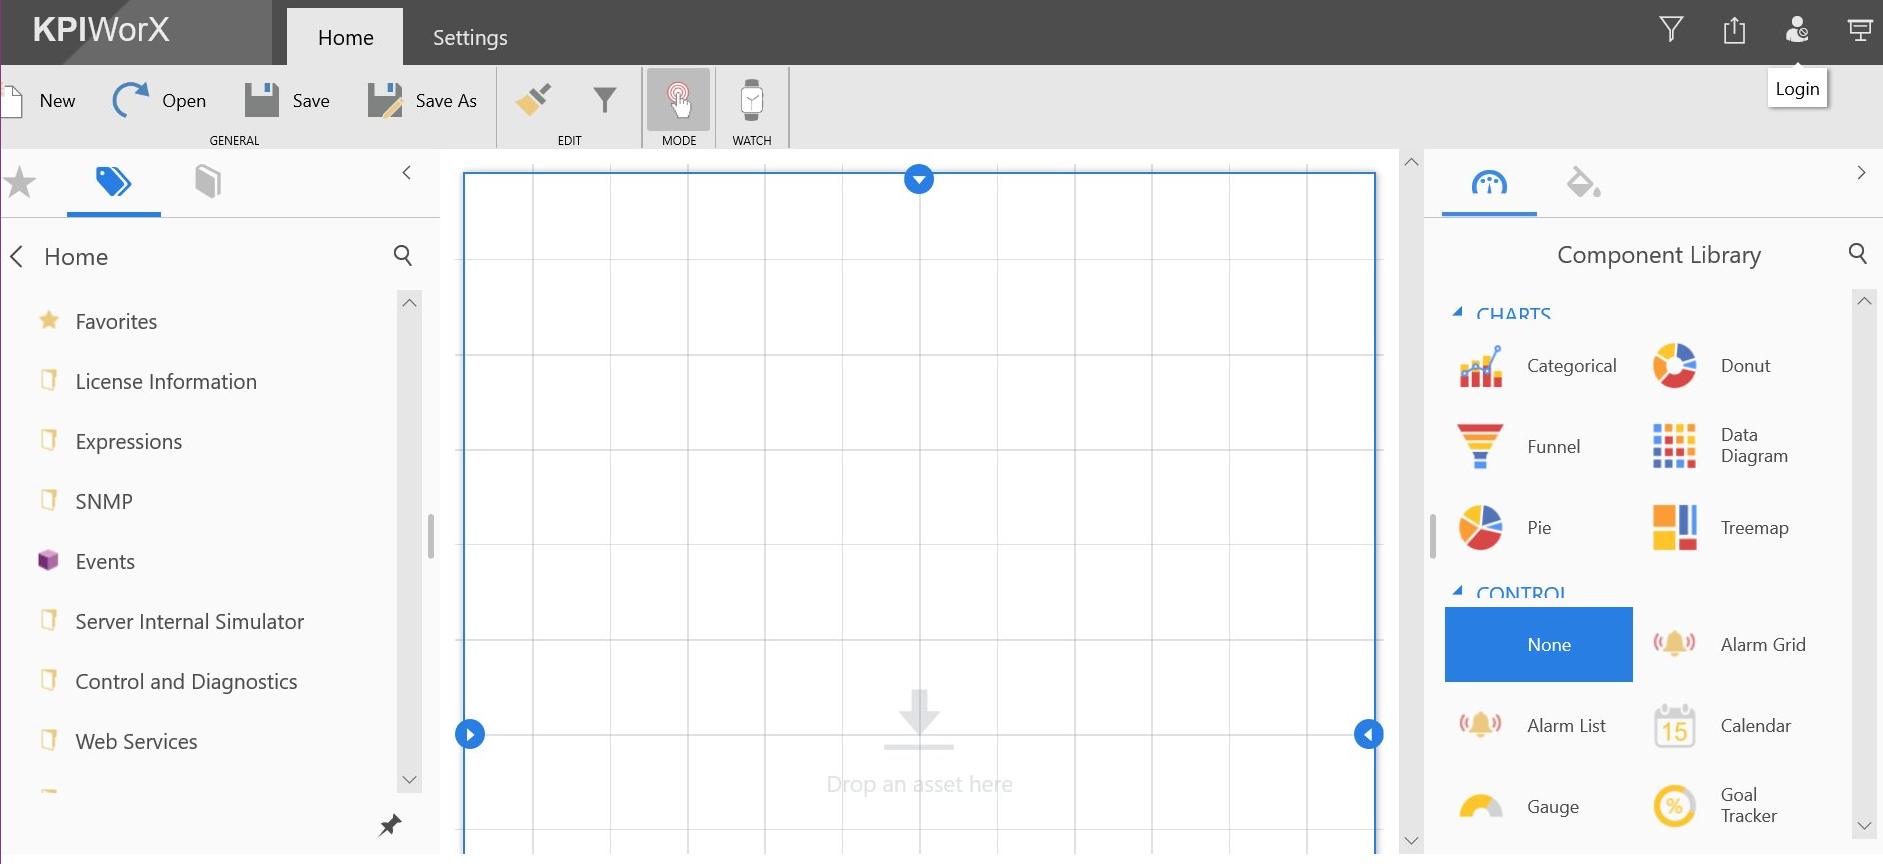
Accessing the IoTWorX Visualizer utilizes ICONICS' KPIWorX tool, shown below.
KPIWorX Used for IoTWorX Visualization
IoT Analyzer fault incidents are available as alarms.
To see to fault incident alarms in the IoT Visualizer, add an alarm widget and configure it to subscribe to AnalytiX > IoT Analyzer > your analyzer group name. The resulting alarm point should look like analyze:GroupName.
See Also: