|
|
The features on this page require a GENESIS64 Advanced license and are not available with GENESIS64 Basic SCADA . |

![]()
|
|
The features on this page require a GENESIS64 Advanced license and are not available with GENESIS64 Basic SCADA . |
![]()
Energy AnalytiX is an analytics data-driven application for Energy Management. It operates by collecting data from various data sources (real time, historical, Web services-based, external, etc.) and then utilizes the collected data in evaluating user-defined energy calculations.
The Energy AnalytiX version released with 10.96.xx ICONICS product release is a new version of the previous releases of Energy AnalytiX (including 10.95.xx) based on a new architecture.
Energy AnalytiX integrates a number of ICONICS key technologies in order to provide an energy management solution, including:
Asset AnalytiX
KPIWorX-BI
Energy AnalytiX is deployed using the AssetWorX infrastructure and the Asset AnalytiX support for mapping equipment properties to Hyper Historian tags and calculations. As such, an end user can add energy functionality to any asset using the Energy AnalytiX extension in the Workbench.
High Level Architecture of Energy AnalytiX
For more information, refer to Energy AnalytiX Quick Start.
Energy AnalytiX product installation will install an energy dashboard for the end user to utilize as a starting point for providing visualization for the energy application.
The energy dashboard is developed to be a general-purpose energy application visualization tool and it will require customization from the end user to make it specific to the end user’s application. For example, if the target energy application does not involve say Carbon-based analysis, then the default energy dashboard will need to be customized to exclude carbon-based visualization.
The energy dashboard consists of three main components
Energy Data Model
Implemented in AnalytiX-BI
Energy Data Model Triggers
Implemented in Actions\Date and Time triggers
Energy Visualization Dashboard
Implemented in KPIWorX-BI
Both the energy data model as well the energy dashboard are developed in a generic way and they accommodate all possible data that an energy application may include. They are also developed in a way to automatically update with newer data, on different periodic intervals, based on the estimated frequency of changes in the underlying data.
Energy data can include data spanning significant time intervals or a high volume of energy calculations. As such, prior to deploying the energy data models or using them, it is advised that the end user sets the data load timeout interval to a high value in the AnalytiX-BI point manager, like 3600 seconds.
AnalytiX-BI Settings
This refers to the process of deployment of the AnalytiX-BI Energy data model and related energy dashboard implemented in KPIWorX-BI. The energy dashboard requires three areas to be available so that it can function
Energy Data Model Implemented Under AnalytiX-BI
Related Triggers the Energy Data Model is Utilizing
Related KPIWorX-BI Dashboard Files
For the new Energy AnalytiX, there will be a new Workbench Project pack file, which the end user will have to unpack manually. The related file will be called EnergyDashboard.pkgx.
EnergyDashboard.pkgx File
It will be located under the \Genesis64 folder under “AnalytiX Dashboards”.
EnergyDashboard.pkgx File Location
The end user will have to unpack it and, while unpacking, the user should check all the related KPIWorX-BI files.
'Unpack a package into the project' Window
After the energy dashboard is successfully unpacked, the end user should perform the following actions:
Restart AnalytiX-BI point manager.
Verify that the following are completed successfully
AnalytiX-BI data flows and data models are unpacked
Triggers related to the energy data model are unpacked
Energy dashboard files are unpacked under \ProgramData\ICONICS
Open the energy dataflows in Workbench Desktop and take a look at the EnergyAssetsDim data flow (under energy dimensions)
If any errors are displayed under the Rename Column step, delete the step, click Apply and then manually re-add the step.
Restart AnalytiX-BI point manager.
Restart IIS.
This issue may appear when for certain asset structures which are much different than the sample one used for creating the energy data model.
Note: For the Rename Column Step in the Energy Assets Dimension, the schema in the Energy Analysis Weekly Data/EnergyAssetsDimBI and Energy Analysis Yearly Data/EnergyAssetsDimBI data models needs to be refreshed. Without refreshing each schema and applying the change, these models will show an “error” in the Status field on the BI form.
Rename Column Step in Energy Assets Dimension
Note: In addition, if data labels are not displayed on data series, it may be the result of different data series available other than the ones used in preparing the energy dashboard. In this case, the user should manually enable the data series labels and manually remove any data series not present in his/her data set.
The energy data model, implemented in AnalytiX-BI includes all the reference data (dimension data) as well all the energy data (fact data) and data relationships to model the energy application and to facilitate advanced energy data analysis and visualization.
The energy data model addresses the following time ranges of energy data:
Current week data
Energy data for the current calendar week by hour
Yearly data
Energy data for the last (3) calendar years by day
In more details, the energy data model consists of:
Data flows
Energy data ETL steps to enrich energy data with metadata
Data tables
Energy data containers
Data Views
Views based on data tables focusing on customized energy data representation
Data Relationships
Relationships between energy data (fact data) and reference data (dimension data)
For more information regarding implementing data models in AnalytiX-BI please refer to About AnalytiX-BI Server and Data Models.
The energy analysis data model consists of two basic groups of data
Dimension data
Reference data, metadata such as asset names, meter types, calendar dates
Fact data
Actual energy data such as consumption or cost data
The Energy Data Model is implemented inside AnalytiX-BI as a collection of:
Data Flows
Data Tables
Data Views
Relationships
Incremental data refresh periodic triggers
Data Models grouped by data range of time
Energy Analysis Data Models
The Energy Data Flows are grouped into several categories, each category representing the functional purpose of the related Data Flows as follows:
The Energy Dimensions consist of the reference energy data such as asset names, calculation names as well as metadata such as meter types, energy variables etc.
Energy Dimension Data Flows in AnalytiX-BI
In more details, the Energy Dimension Data Flows in AnalytiX-BI are:
AssetsPropertiesDim
Asset equipment properties dimension
Date1Hour1WeekDim
Daily dates dimension for (1) month at 1 hour
EnergyAllDDDim
Energy-related temperatures dimension (heating and cooling degree days only)
EnergyAssetsDim
Assets with Energy extension dimension (does not include energy meters)
EnergyBudgetedCostsDim
Energy assets budgeted cost dimension (no energy meters included)
EnergyCarbonDim
Energy asset carbon dimension
EnergyCDDDim
Energy related temperatures dimension (cooling degree days only)
EnergyConsumptionDim
Energy consumption dimension (no energy meters or normalized calculations included)
EnergyConsumptionMetersDim
Energy consumption dimension for energy meters
EnergyCostCentersDim
Energy cost centers dimension
EnergyCostsDim
Energy assets cost dimension (no energy meters included)
EnergyHDDDim
Energy related temperatures dimension (heating degree days only)
EnergyMeterTypesDim
All energy meter types
EnergyNormVariablesDim
Energy normalization variables dimension
EnergyTempDim
Energy temperatures dimension
The Energy Data includes data such as consumption data, normalized variable data, cost data etc.
Energy Data Flows in AnalytiX-BI
In more details, the energy data flows in AnalytiX-BI are:
Energy Weekly (Energy data for the current week by hour)
Energy Weekly Data Flows in AnalytiX-BI
EnergyCarbonWeeklyAll
All assets (no energy meters) energy carbon for 1 week by 1 hour
EnergyConsWeeklyAll
All assets (no energy meters) energy consumption by 1 hour for a week
EnergyCostWeeklyAll
All assets (no energy meters) energy cost by 1 hour for 1 week
EnergyTempWeeklyAll
All assets (no energy meters) average temperature by 1 hour for a week
Energy Yearly (Energy data for 3 years by day)
Energy Yearly Data Flows in AnalytiX-BI
EnergyBudgetedCostYearlyAll
All assets (no energy meters) energy budgeted cost by 1 day for 3 years
EnergyCarbonYearlyAll
All assets (no energy meters) energy carbon by 1 day for 3 years
EnergyCDDYearlyAll
All assets cooling degree days by 1 day for 3 years
EnergyConsYearlyAll
All assets (no energy meters) energy consumption by 1 day for 3 years
EnergyConsMetersYearlyAll
All energy meters consumption by 1 day for 3 years
EnergyCostYearlyAll
All assets (no energy meters) energy cost by 1 day for 3 years
EnergyDDYearlyAll
All assets degree days by 1 day for 3 years
EnergyHDDYearlyAll
All assets heating degree days by 1 day for 3 years
EnergyNormVariablesYearlyAll
All assets (no energy meters) energy normalization variables by 1 day for 3 years
EnergyTempYearlyAll
All assets (no energy meters) temperature by 1 day for 3 years
The energy data models are grouped into several categories, each category representing the time range of the related data flows as follows:
Energy Analysis Weekly Data
Data model for Energy Analysis current day and weekly data by hour
Energy Analysis Yearly Data
Data model for Energy Analysis (3) years by day
Energy Data Models in AnalytiX-BI
The Energy Analysis Weekly Data Model integrates the weekly data flows along with the dimension related Data Flows to provide the current calendar week energy dashboard.
Energy Analysis Weekly Data Model in AnalytiX-BI
In more details, this Energy Data Model contains:
Date1Hour1WeekDimBI
Date dimension for 1 week at 1 hour
Data get refreshed every hour
EnergyCarbonDimBI
Energy carbon tags
Data get refreshed every hour
EnergyCarbonWeeklyAllBI
Energy carbon for all energy assets for 1 day at 1 hour
Data get refreshed every hour
Data gets refreshed daily after midnight
EnergyConsumptionDimBI
Energy consumption tags
Data get refreshed every hour
EnergyConsWeeklyAllBI
Energy consumption for all energy assets for 1 week hourly
Data get refreshed every hour
Data gets refreshed daily after midnight
EnergyCostCentersDimBI
Energy cost centers dimension
Data get refreshed every hour
EnergyCostDimBI
Energy asset cost tags
Data get refreshed every hour
EnergyCostWeeklyAllBI
Energy cost for all energy assets for 1 week at 1 hour
Data get refreshed every hour
Data gets refreshed daily after midnight
EnergyMeterTypesDimBI
Energy meter types
Data get refreshed every hour
EnergyTempDimBI
Energy asset temperature dimension
Data get refreshed every hour
EnergyTempWeeklyAllBI
Energy asset temperature data 1 week by 1 hour
Data get refreshed every hour
Data gets refreshed daily after midnight
EnergyCarbonWeeklyAllBIView
Energy weekly carbon view at 1 hour
EnergyConsWeeklyAllBIView
Energy weekly consumption view at 1 hour
EnergyCostWeeklyAllBIView
Energy weekly cost view at 1 hour
EnergyTempWeeklyAllBIView
Energy asset temperature view for 1 week by 1 hour
Energy Analysis Weekly Model Graphical View
The Energy Analysis Yearly Data Model integrates the yearly data flows along with the dimension related data flows to provide the last three (3) calendar years' energy dashboard.
Energy Analysis Yearly Data Model in AnalytiX-BI
In more details, this energy data model contains:
AssetsPropertiesDimBI
Asset Properties dimension table
Data gets refreshed daily at midnight
EnergyAllDDDimBI
Energy heating and cooling degree days dimension
Data gets refreshed daily at midnight
EnergyAssetsDimBI
Energy assets dimension table
Data gets refreshed daily at midnight
EnergyBudgetedCostDimBI
Energy asset budgeted cost tags
Data gets refreshed daily at midnight
EnergyBudgetedCostYearlyAllBI
Energy budgeted cost for all energy assets for 3 years daily
Data gets refreshed daily at midnight
Data gets refreshed also at the end of each month
EnergyCarbonDimBI
Energy carbon tags
Data gets refreshed daily at midnight
EnergyCarbonYearlyAllBI
Energy carbon for all energy assets for 3 years daily
Data gets refreshed daily at midnight
Data gets refreshed also at the end of each month
EnergyConsumptionDimBI
Energy consumption tags
Data gets refreshed daily at midnight
EnergyConsYearlyAllBI
Energy consumption for all energy assets for 3 years daily
Data gets refreshed daily at midnight
Data gets refreshed also at the end of each month
EnergyCostCentersDimBI
Energy cost centers dimension
Data gets refreshed daily at midnight
EnergyCostDimBI
Energy asset cost tags
Data gets refreshed daily at midnight
EnergyCostYearlyAllBI
Energy cost for all energy assets for 3 years daily
Data gets refreshed daily at midnight
Data gets refreshed also at the end of each month
EnergyDDYearlyAllBI
Degree Days for all energy assets for 3 years daily
Data gets refreshed daily at midnight
Data gets refreshed also at the end of each month
EnergyMeterTypesDimBI
Energy meter types
Data gets refreshed daily at midnight
EnergyNormVariablesDimBI
Energy normalization variables dimension
Data gets refreshed daily at midnight
EnergyNormVariablesYearlyAllBI
All assets (no energy meters) energy normalization variables by 1 day for 3 years
Data gets refreshed daily at midnight
Data gets refreshed also at the end of each month
EnergyTempDimBI
Energy asset temperature dimension
Data gets refreshed daily at midnight
EnergyTempYearlyAllBI
Average temperature for all energy assets for 3 years daily
Data gets refreshed daily at midnight
Data gets refreshed also at the end of each month
EnergyConsumptionMetersDimBI
Energy meter consumption tags dimension
Data gets refreshed daily at midnight
EnergyConsMetersYearlyAllBI
Energy consumption for all energy meters for 3 years daily
Data gets refreshed daily at midnight
Data gets refreshed also at the end of each month
EnergyBudgetedCostTotalsYearlyAllBIView
All assets (no energy meters) energy budgeted cost by 1 day for 3 years totaled by source, asset, year and month
EnergyCarbonYearlyAllBIView
Energy carbon cost view at 1 day
EnergyCDDTotalsYearlyAllBIView
All assets (no energy meters) cooling degree days by 1 day for 3 years totaled by source, asset, year and month
EnergyConsTotalsYearlyAllBIView
All assets (no energy meters) energy consumption by 1 day for 3 years totaled by source, asset, year and month
EnergyConsYearlyAllBIView
Energy yearly consumption view at 1 day
EnergyConsYearlyNoRollupsAllBIView
Energy yearly consumption view at 1 day (no rollups)
EnergyCostAnalysisYearlyBIView
Cost analysis for estimated and budgeted cost for all energy assets for 3 years by day
EnergyCostTotalsYearlyAllBIView
All assets (no energy meters) energy cost by 1 day for 3 years totaled by source, asset, year and month
EnergyCostYearlyAllBIView
Energy yearly cost view for (3) years at 1 day
EnergyDDYearlyAllBIView
Energy yearly heating and cooling degree days view at 1 day
EnergyHDDTotalsYearlyAllBIView
All assets (no energy meters) heating degree days by 1 day for 3 years totaled by source, asset, year and month
EnergyNormAvgConsYearlyBIView
All assets (no energy meters) normalized energy consumption by 1 day for 3 years by asset, year and month
EnergyNormAvgCostYearlyBIView
All assets (noenergy meters) normalized energy cost by 1 day for 3 years by asset, year and month
EnergyNormConsDDYearlyBIView
All assets (no energy meters) normalized energy consumption by Degree Days by 1 day for 3 years by asset, year and month
EnergyNormVariablesAvgYearlyAllBIView
All assets (no energy meters) energy normalization variables by 1 day for 3 years averaged by asset, year and month
EnergyTempYearlyAllBIView
Average temperature for all energy assets yearly for 3 years by 1 day
EnergyConsMetersYearlyAllBIView
Energy meters yearly consumption view at 1 day
EnergyConsTotalsEnterpriseView
All Enterprise level assets (no energy meters) energy consumption by 1 day for 3 years totaled by source, asset, year and month
EnergyConsTotalsAreaView
All Area level assets (no energy meters) energy consumption by 1 day for 3 years totaled by source, asset, year and month
EnergyConsTotalsSiteView
All Site level assets (no energy meters) energy consumption by 1 day for 3 years totaled by source, asset, year and month
Energy Analysis Yearly Model Graphical View
The Energy Analysis Data Model utilizes a set of triggers to periodically update the energy data displayed on the energy dashboard. The associated triggers are created under Actions, in the Workbench, and they should not be deleted by the end user.
Energy Analysis Data Model Triggers
The Data Model is using the above triggers in updating related data tables in a periodic fashion, by following a load balanced approach. Typically, at least one and in some cases two periodic triggers are used for data updates.
Energy Analysis Data Table Triggers
The first one may be supported incremental updates based on a data key, while the other one (Overwrite with new data) repopulates the entire data table with a fresh copy of the data.
Typically, dimensional data tables are getting refreshed with an updated snapshot of the data every hour, which implies that any configuration changes will be visible tothe Energy Analysis data model every one (1) hour.
The Energy Analysis Data Model is a generic data model and most likely end users will have to customize it. Editing the default energy data model needs to be planned carefully and with an understanding of the required steps.
Note: It is recommended that prior to any modification of the Energy Data Model, the related configuration database is backed up.
Next, the type of editing in the data model has to be reviewed with respect to data model entities relationship and parent child hierarchies. It is best if we provide a few examples of how to accomplish this.
The AnalytiX-BI-based Energy Data Model is made of:
Data Flows
Data Tables
Data Views
Relationships
Prior to deleting any entity, the user will need to review if other energy data model entities depend or reference the entity to be deleted. More specifically:
If the entity to be deleted is a data flow, all related tables, views and associated relationships must be deleted first. If the entity to be deleted is a data table or data view, all related data views and relationships need to be deleted first.
As a use case scenario, let’s say that we would like to remove any carbon-related entities from the weekly data model. The required steps would be:
Step 1: Expand the Weekly Energy Data Model and identify carbon-related entities and identify the carbon-related entities.
Energy Weekly Data Model
Step 2: Open the Weekly Energy Data Model in the Workbench, and for each carbon- related entity, delete associated relationships and save the Data Model.
Relationships in Energy Weekly Data Model
Step 3: Delete all carbon entities from the weekly data model.
Step 4: Delete all carbon-related Data Flows from the Weekly Data Model.
Another use case scenario would be to add or remove fields from existing data flows, data tables or views. The required steps would be:
If adding a new column to a data flow, in order to propagate it to the related data table, the user must first refresh the schema of the related data table.
Refreshing Data Table Schema
If removing an existing field from a data table or view, the user should:
Remove any relationships in the data model relating to the field to be removed
Remove any reference of the specific field from related data views
Remove the related field from the data table or data view
In general, any change in the data model’s entities will most likely impact the energy visualization dashboard. As such, it is recommended that users once they complete changes in the Energy Analysis data model that they do review all visuals in the related dashboards and verify that they operate properly. In some cases, users may need to remove visuals for which no data are available in the energy data model while in some cases, pending on the changes committed, all that it is required to add or to remove data model entity field from the related visual’s fields.
Energy assets can be geographically distributed and they can be allocated to different time zones. An Energy dashboard user would like to visualize energy data across same time intervals related to different time zones.
For example, let’s assume that we have defined two time zones in our asset structure.
Multiple Time Zones in Asset Tree
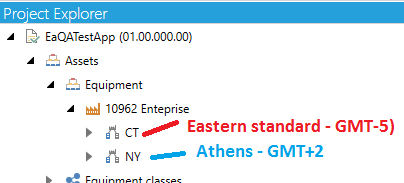
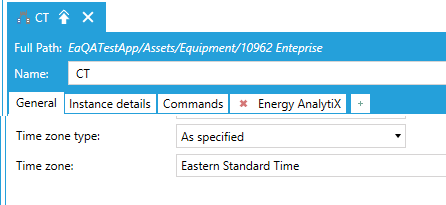
CT -> Eastern Time zone (GMT-5)
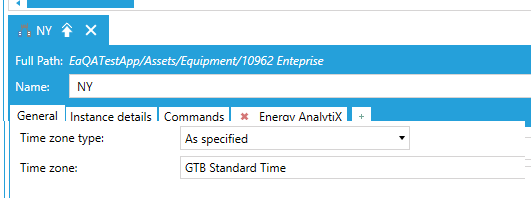
NY->Athens (Greece) (GMT+2)
First Time Zone Properties
Second Time Zone Properties
Now, let’s say we would like to look at data for a calendar day 12:00 AM (today) to 12:00 AM (next day) in local time on 11/17/2020. The corresponding Hyper Historian data request would be in UTC times.
CT -> Eastern Time zone (GMT-5): 5:00 AM (today) to 5:00 AM (next day)
NY -> Athens (Greece) (GMT+2): 10:00 PM (previous day) to 10:00 PM (current day)
Athens Time Zone Info

All energy data model data tables and data views will propagate the energy asset’s Timezone information to the energy data model queries and all energy dashboard filters will operate on the local time of the user visualizing energy data.
In AnalytiX-BI, energy data model all energy dimensions will propagate the time zone information (or emptry string if not defined). The energy data model data flows are modified to use the new time zone support function in AnalytiX-BI (totimezonetime) and to parameterize the data request from Hyper Historian to the appropriate UTC time interval based on the asset’s timezone. Once the data are retrieved in UTC time for Hyper Historian, they will be converted to a LocalTimeZone time using as parameter the timezone of the related asset and then all added columns such as year, month, day, etc will be applied. In the energy dashboard, based on KPIWorX-BI, all date-based filters will work using the newly added LocalTimeZone column and all date-based data filtering will be based on the local time of the energy dashboard user.
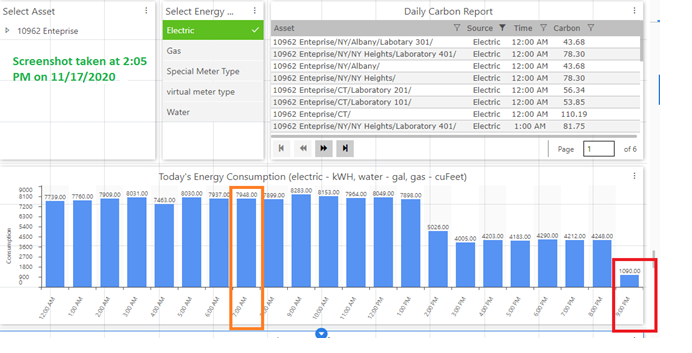
As an example, let us look at hourly data inside Energy AnalytiX' overview dashboard page.
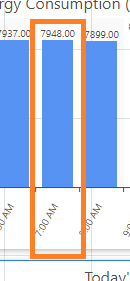
Without any asset selected, we can see data up to 8:00 PM although the screenshot was taken at 2:05 PM at Foxboro on 11/17/2020. This makes sense since NY is in Athens, where the time now is 9:05 PM and the consumption chart rolls up everything at the 10962 Enterprise level.
Overview of Today’s Consumption Data by Hour
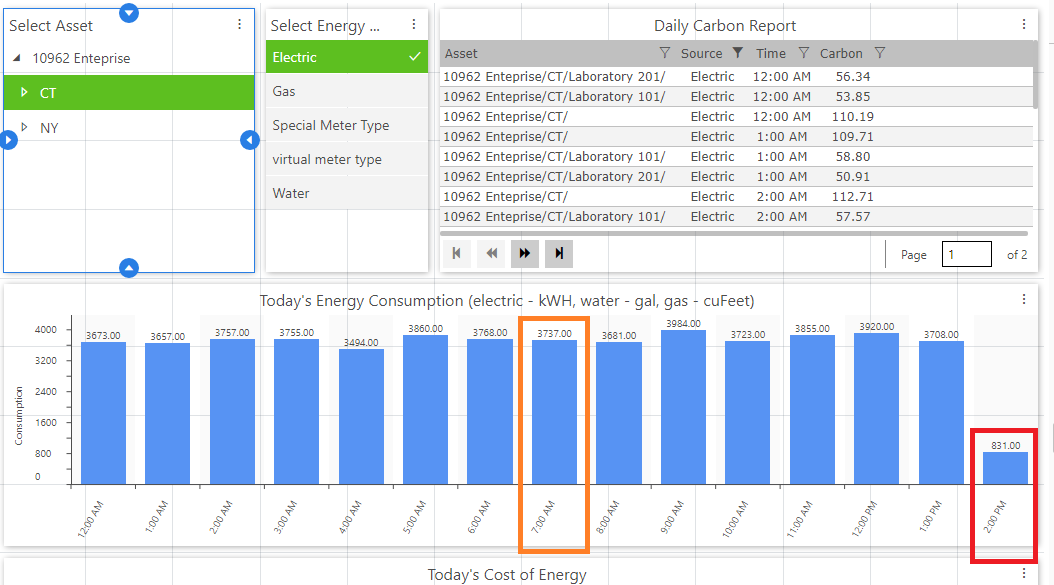
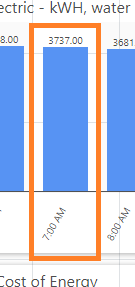
Now, let’s use CT as our selection. Data are displayed until 2:00 PM, since this is our local time and CT is in Eastern (Foxboro) time.
Overview of Today’s Consumption Data by Hour in Eastern Timezone
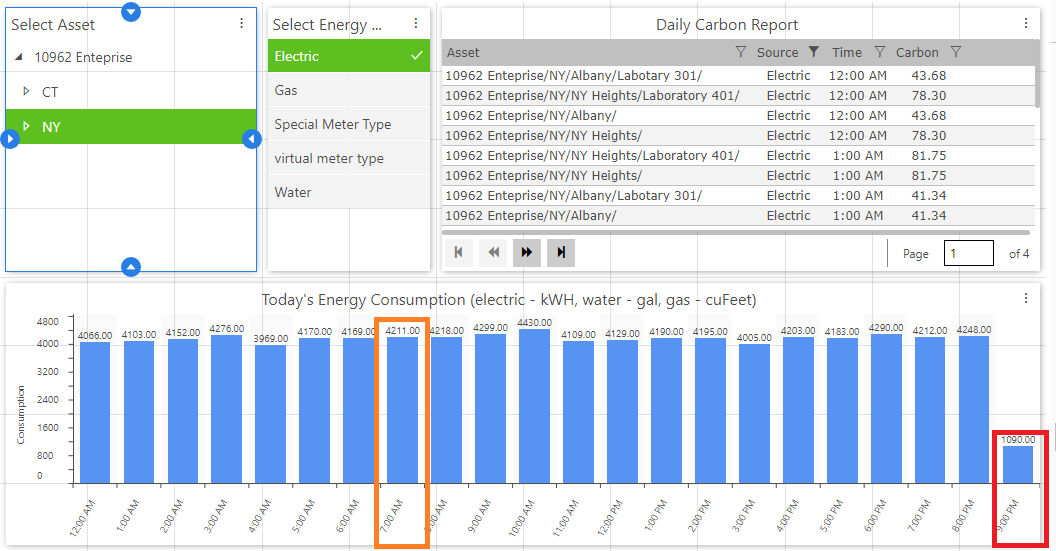
Next, let’s use NY as our selection. Data are displayed until 9:00 PM, since this is our local time and NY is in EET (Athens, Greece) time and there the local time is 9:05 PM.
Overview of Today’s Consumption Data by Hour in Eastern European Timezone
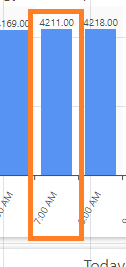
Finally, let’s look at the total consumption at the 10962 Enterprise level. 10962 Enterprise level consumption = CT consumption + NY consumption.
10962 Enterprise-level Consumption (7948 kWH)
CT consumption (3737 kWH)
NY consumption (4211 kWH)
The energy dashboard is implemented as a set of dashboard pages developed within KPIWorX-BI (under \ProgramData\ICONICS\KPIXStorage\Public). It is supplied as a sample energy dashboard with a general-purpose approach to provide a sample and a starting point for the end user to customize energy visualization to fulfill application requirements. Typically it will need to be modified by the end user to be made more applicable to the individual energy visualization needs of the end user’s application.
Energy Dashboard Files
The energy dashboard can be accessed by starting a browser and navigating to the KPIWorX-BI default site http://localhost/kpiworx/default.kpix.
Energy Dashboard in KPIWorX-BI
The Energy Dashboard is structured to have a home page (Energy Analysis Overview) and a number of related dashboard pages within dedicated virtual folders. In general, the following dashboard sections are supplied as a starting point.
Energy Analysis (overview) page
Portfolio Weekly View
Energy data analysis for current week
Energy Analysis
Asset comparison
Data insights
Energy Cost Analysis
Yearly data cost analysis
Weather Data Analysis
Yearly degree days analysis
Reports
Tabular report (grid) displays
Before starting to use the Energy Dashboard, please verify the following:
IIS is restarted
Your energy application is set as the active configuration in Workbench
Hyper Historian Logger service is running
AnalytiX-BI point manager service is running (restart if needed)
An energy dashboard page in general is developed using energy data from the energy data model along with filters to allow the end user to easily analyze energy data based on the current filter context selection.
Energy Analysis Overview Dashboard Page
Note: The dashboard filters which are used in single selection mode may have pre-selected values which are based on the source energy sample data that the sample energy dashboard was developed. As such, once the user goes to display runtime mode and selects an existing filter value, the new filter value will take affect and the saved pre-selected filter value will reflect existing values from the user’s energy application.
In the following sections, we will describe with more details each energy dashboard area.
Energy Analysis Dashboard Functionality
The Energy Analysis Overview page is intended to present a quick summary of energy data for the current calendar day.
Portfolio level view
Data time range: 1 calendar day (24h)
Data resolution: 1 hour
Visuals
Consumption
Cost
Carbon
Energy Analysis Overview Dashboard Page
The Energy Weekly Analysis dashboard pages are intended to present a quick summary of energy data for the current calendar week.
Energy Weekly Analysis Folder
Assets level view
Data time range: 1 week (7 days)
Data resolution: 1 hour
Visuals
Consumption
Cost
Carbon
Weekly Overview Dashboard Page
Assets level view
Data time range: 1 week (7 days)
Data resolution: 1 hour
Visuals
Cost analysis
Heat map consumption by hour of day
Weekly Analysis Dashboard Page
The Energy Analysis dashboard pages are intended to present analysis of energy data for the last (3) calendar years using daily resolution for the data.
Energy Analysis Folder
Assets level view
Data time range: 3 years
Data resolution: 1 year
Visuals
Consumption
Cost
Carbon
Consumption Analysis Dashboard Page
Dynamic Asset to asset comparison for consumption calculations
Data time range: 3 years
Data resolution: 1 day
Asset to asset comparisons
Visuals
Consumption
Consumption Trends Dashboard Page
Overall normalized consumption analysis
By energy variables such as Gross Area, Occupancy etc.
Data time range: 3 years
Data resolution: Monthly
Visuals
Consumption
Month to month comparison by calendar year
Tabular report
Tabular display of actual consumption, energy variable and normalized consumption values
Normalized Energy Analysis Dashboard Page
Overall normalized consumption asset comparisons
By energy variables such as Gross Area, Occupancy etc.
Data time range: 3 years
Data resolution: Monthly
Asset to Asset Comparisons
Visuals
Consumption
Asset to Asset Month to month comparison by calendar year
Tree map
Tree map of actual consumption by year and month
Normalized Energy Comparison Dashboard Page
High level view across months for sub-metering
Data time range: 3 years
Data resolution: 1 month
Visuals
Consumption
Analysis by energy source submetering
Top (5) analysis by source segment
Donut Charts of each source segment by month
Important Note: The segmentation analysis applied to meter types predefined in Energy AnalytiX sample configuration data. If the end user is utilizing different meter type names then the dashboard page filters for meter types should be edited to reflect the desired meter types.
Energy Segmentation Meter Type Filters
Segmentation Analysis Monthly Dashboard Page
High level view across time
Data time range: 3 years
Data resolution: 1 month
Visuals
Consumption
Analysis by energy source
Year at a Glance Dashboard Page
Assets level view
Data time range: 3 years
Data resolution: 1 month
Visuals
Consumption
Cost
Yearly Analysis Dashboard Page
Detailed level view across years of energy data
Data time range: 3 years
Data resolution: 1 day
Visuals
Consumption
Yearly Consumption Analysis Dashboard Page
Detailed level view across years of energy meter data
Data time range: 3 years
Data resolution: 1 day
Visuals
Consumption
Yearly Meter Data Analysis Dashboard Page
Assets level view
Data time range: 3 years
Data resolution: 1 calendar day
Visuals
Consumption
Asset based drilldown by source, year, month, day of week
Top (5) Consumption filtered plot
Yearly Overview Dashboard Page
The Energy Cost Analysis dashboard pages are intended to present analysis of energy cost data for the last (3) calendar years using daily resolution for the data.
Energy Cost Analysis Folder
Overall normalized cost analysis
By energy variables such as Gross Area, Occupancy etc.
Data time range: 3 years
Data resolution: Monthly
Visuals
Cost
Month to month comparison by calendar year
Includes both estimated as well as budgeted cost values
Tabular report
Tabular display of estimated, budgeted, energy variable and normalized cost values
Normalized Cost Analysis Dashboard Page
Energy Cost Analysis (Asset Cost Comparisons)
Overall cost asset comparisons
Data time range: 3 years
Data resolution: Daily
Visuals
Cost
Asset to Asset cost drilldown comparison by calendar
Asset Cost Comparison Dashboard Page
Assets level view
Data time range: 3 years
Data resolution: 1 Month
Visuals
Yearly Cost Analysis
Budgeted vs Estimated comparisons
Yearly Cost Analysis Dashboard Page
The Weather Data Analysis dashboard pages are intended to present analysis of energy data with respect to degree days for the last (3) calendar years using daily resolution for the data
Weather Data Analysis Folder
Overall analysis of Degree Days
Data time range: 3 years
Data resolution: Monthly
Visuals
Tabular report of Degree Days
Consumption Bar Chart
Bar chart of Degree Days
Degree Days Yearly Overview Dashboard Page
Overall normalized consumption by Degree Days
Data time range: 3 years
Data resolution: Monthly
Visuals
Normalized Consumption by Degree Days
Normalized consumption by total Degree Days
Heat maps
Heating Degree Days heatmap
Cooling Degree Days heatmap
Normalized Consumption by Degree Days Dashboard Page
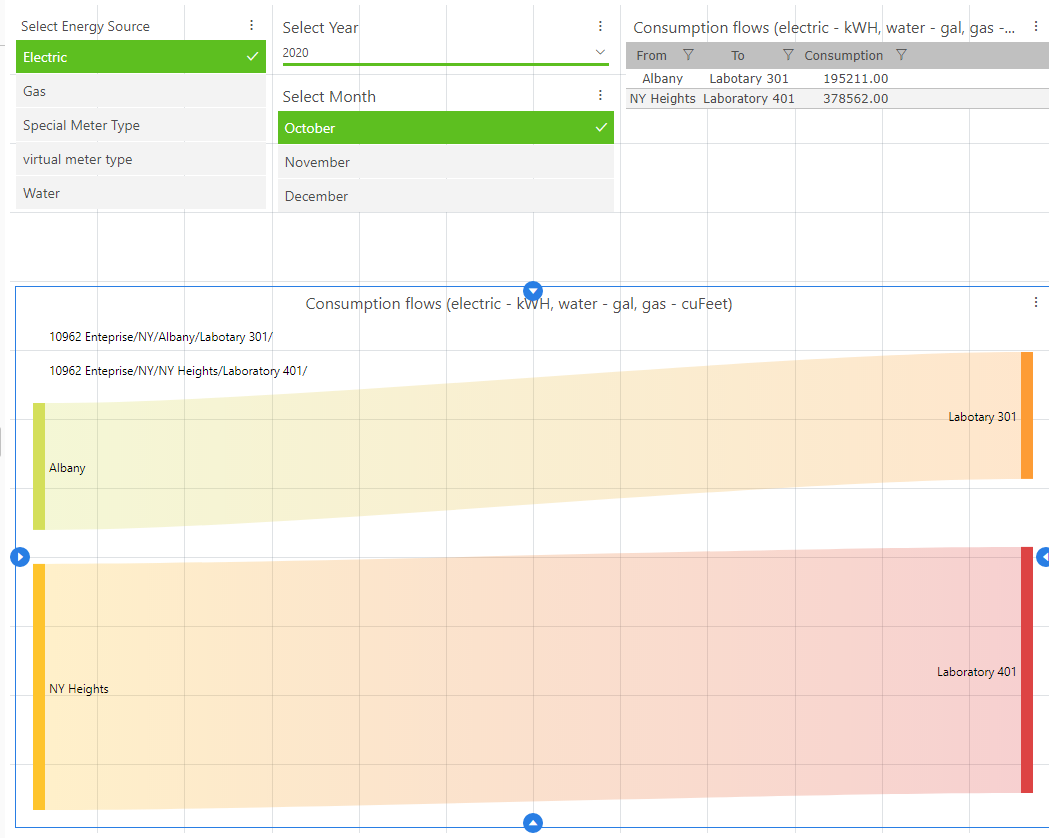
The Consumption Flows dashboard pages are intended to present flows of energy consumption across asset levels for the last three (3) calendar years using daily resolution for the data. The visualization of the energy consumption flows is based on Sankey charts.
Consumption Flows Folder
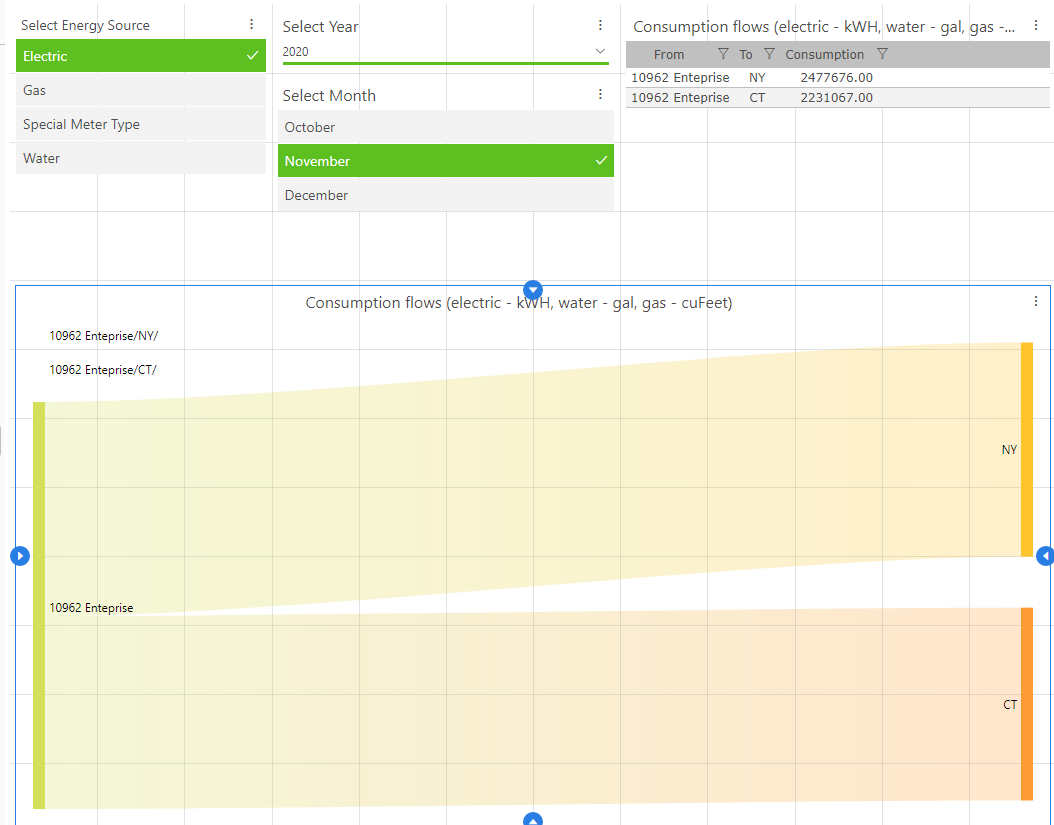
Energy consumption flows (Enterprise level)
Data time range: 3 years
Data resolution: 1 calendar day
Visuals
Consumption flows
Enterprise Flow Analysis Dashboard Page
Energy consumption flows (Area level)
Data time range: 3 years
Data resolution: 1 calendar day
Visuals
Consumption flows
Area Flow Analysis Dashboard Page
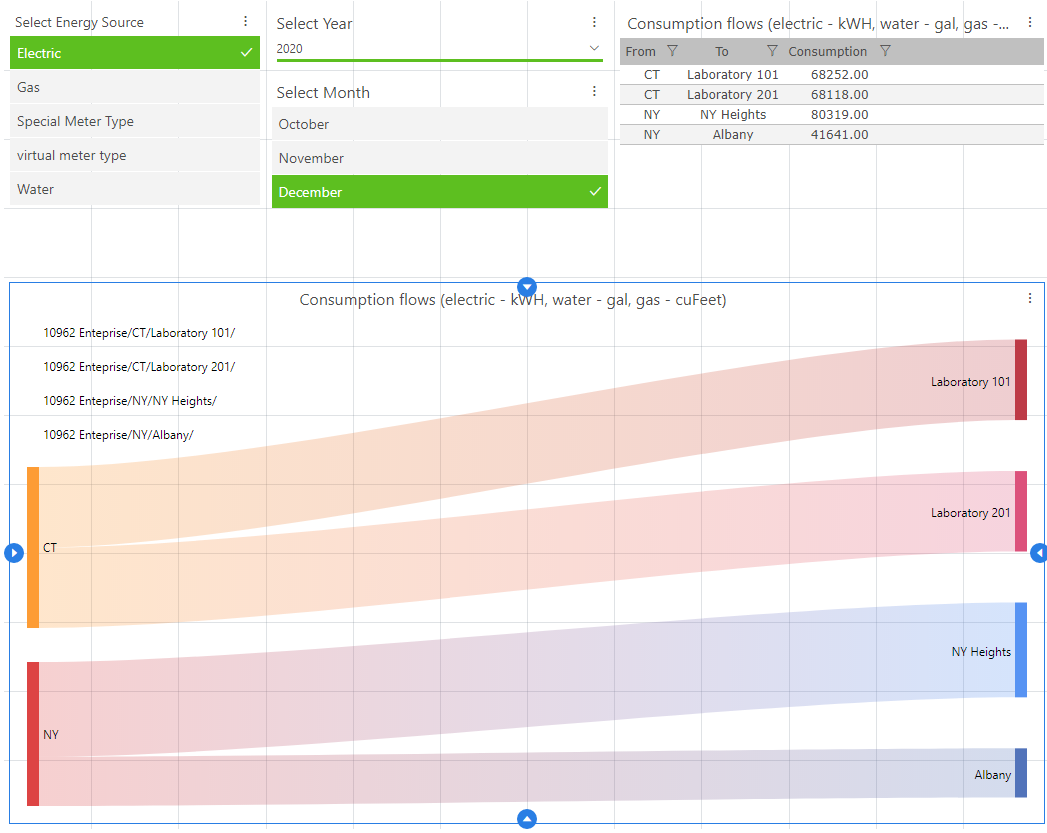
Energy consumption flows (Site level)
Data time range: 3 years
Data resolution: 1 calendar day
Visuals
Consumption flows
Site Flow Analysis Dashboard Page
NOTE: The Consumption flows assume that all asset levels, such as Enterprise, Site, Area, and ProcessCell are available in the application’s AssetWorX tree.
In cases where some of the above asset levels do not exist, the user will have to do the following steps:
Remove the mapping steps to the non-existing asset levels from the EnergyAssetsDim dataflow.
Refresh the data table schema of EnergyAssetsDimBI data table.
Edit or delete as needed the related data views EnergyConsTotalsEnterpriseView, EnergyConsTotalsSiteView, EnergyConsTotalsAreaView.
The Reports dashboard pages are intended to present tabular analysis of energy data for the last (3) calendar years using daily resolution for the data.
Reports Folder
Tabular displays
Data time range: 3 years
Data resolution: 1 calendar day
Visuals
Carbon
Yearly Carbon Report Dashboard Page
Note: Carbon data is a bit different than, for instance, consumption data or cost data. Non-rollup assets cannot always be relied upon since users apply Carbon calculations to only high -evel rollups like "campus" or "buildings" and not, for instance, "floors".
For now, in the chart for Carbon consumption by day of week, users can set "IsRollup=false". However, if a user applies Carbon calculations to only high-level rollups, the chart may need to be modified or replaced.
Tabular displays
Data time range: 3 years
Data resolution: 1 calendar day
Visuals
Consumption
Yearly Consumption Report Dashboard Page
Tabular displays
Data time range: 3 years
Data resolution: 1 calendar day
Visuals
Cost
Yearly Cost Report Dashboard Page
See Also: