![]()
![]()
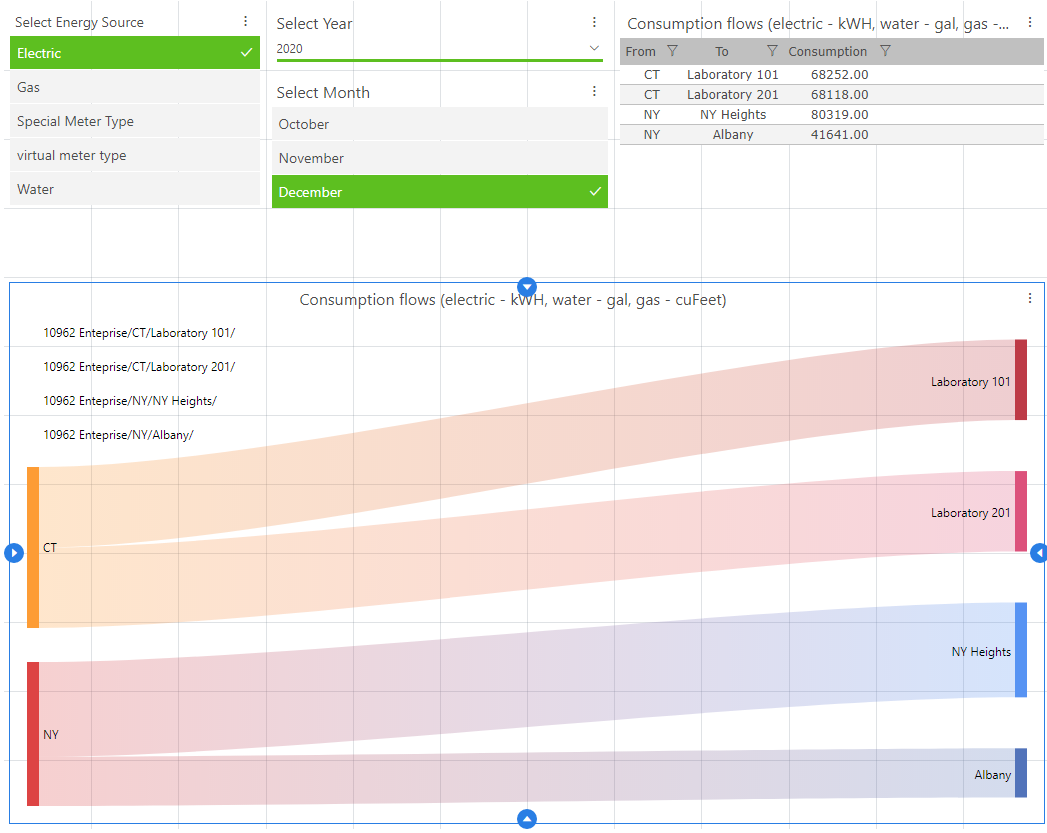
The Energy AnalytiX data model and sample dashboards are able to utilize the Sankey Diagram widget.
Area Flow Analysis Dashboard Page Using Sankey Diagram
The data model has three views that are used in three dashboards available in the Consumption Flows folder. These include:
EnergyConsTotalsAreaView
EnergyConsTotalsEnterpriseView
EnergyConsTotalsSiteView
These dashboards are named:
Area Level Flows
Site Level Flows
Enterprise Level Flows
These dashboards visualize the flow of energy of various levels.
See Also: