Including Web Services Data in a GraphWorX64 Display
Once you have configured the Web Services database in the Web Services Provider in the Workbench, then configured Web Services data (via a Folder, Web Service and/or Web Method Instance), you can then utilize that data in an integrated ICONICS application, such as GraphWorX64.
To Include Web Services Data in a GraphWorX64 Display
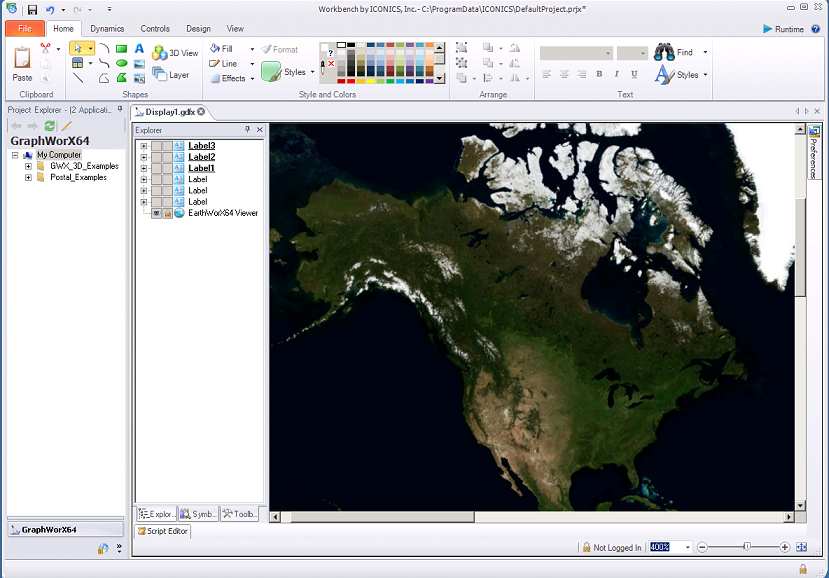
- Create a new Display or open an existing one in GraphWorX64. For demonstration purposes, we will use a simple weather map example with three specific geographic areas: Juneau, AK; Foxborough, MA; and Orlando, FL. In this example, we have already inserted an ICONICS EarthWorX Map background, set to an appropriate size for our need.
Setting Up an Initial GraphWorX64 Display
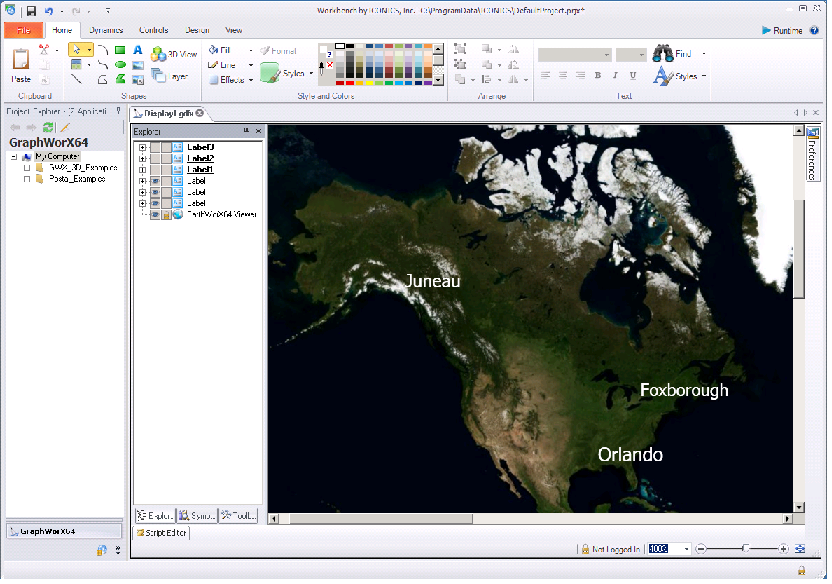
- Next, to identify the geographic areas for which we wish to pull Web Services data, we'll include the three city names using the text tool within GraphWorX64, as shown below.
Adding Text Elements to the GraphWorX64 Display
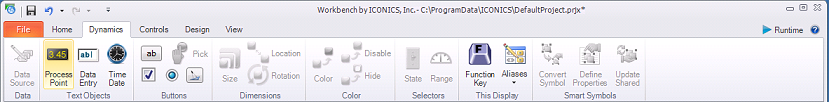
- Now we can add the Web Services elements to this simple weather map display in GraphWorX64. Click on Dynamics in the top left options, which opens the Dynamics ribbon, as shown below. This will allow you to click on the Process Point icon in the Text Objects section of the Dynamics Ribbon. You can then draw a box (using the white "+") where you intend for the requested Web Services data to appear.
Dynamics Ribbon in GraphWorX64
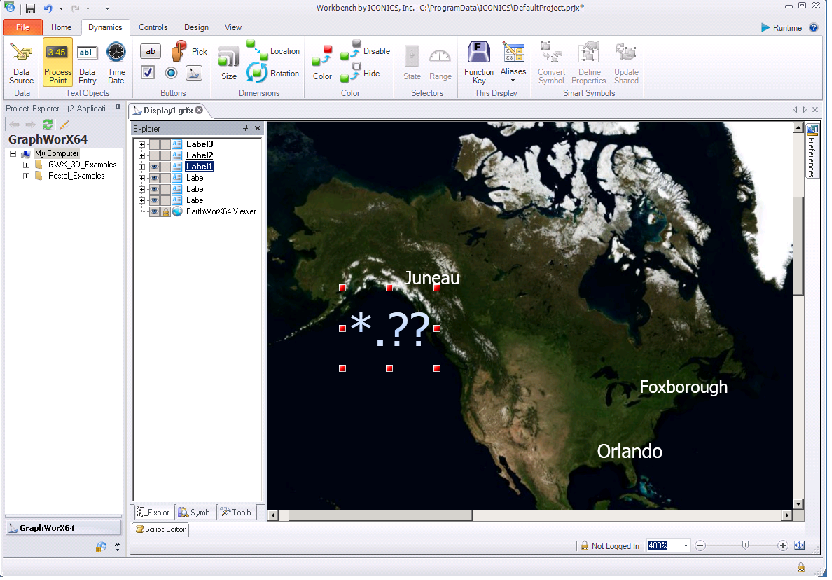
- In our example, we first want to insert a Process Point nearby where we have included the text box for "Juneau". The Process Point will fill with placeholder text while GraphWorX64 is in Configuration Mode.
Setting the First Process Point in GraphWorX64
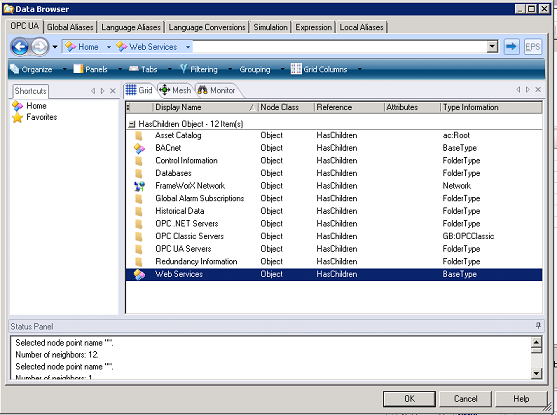
- Simultaneously, while you set the location for the Process Point, the Data Browser will open, as shown below, allowing you to navigate to your intended data source. Once configured, you will see Web Services listed in the Home location (as highlighted below). Continue to click through to find your intended Web Services data source.
Navigating through the Data Browser
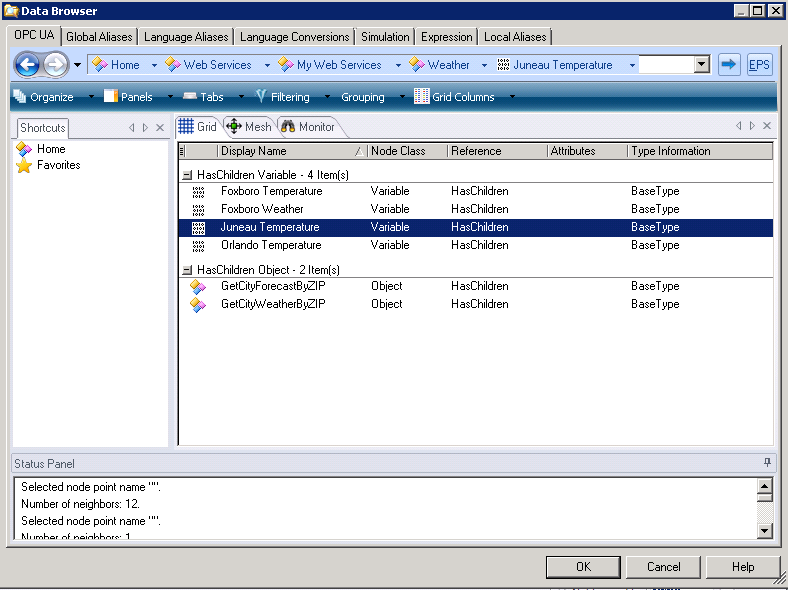
- For our example, we want to locate the Web Services data source for Juneau's current temperature. Notice in the image below how the navigation bar of the Data Browser allows you to see each level of navigation to the data element. The Juneau Temperature data source is highlighted. Once you have found your selected item, click OK.
Selecting the Data Source in the Data Browser
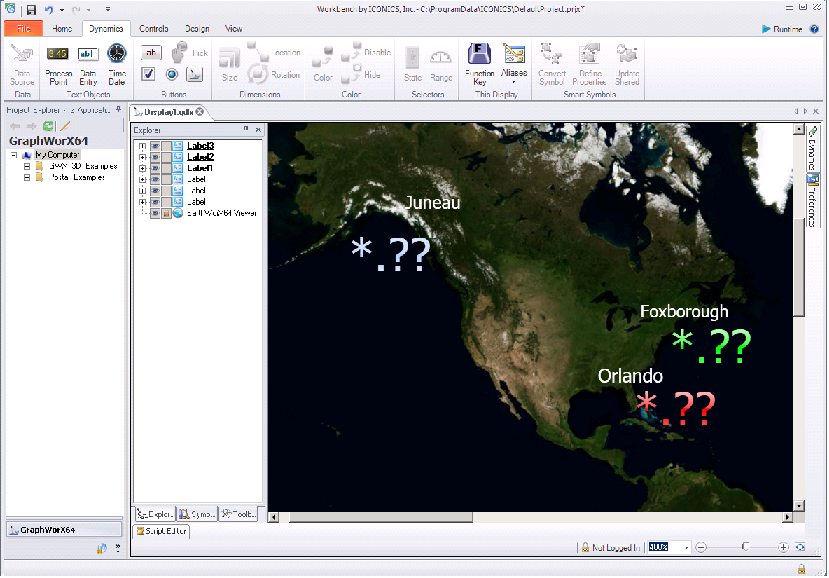
- In our example, shown below, we have gone ahead and created two additional Process Points (one for Foxborough and one for Orlando), each connecting to their respective Web Services data point using the Data Browser - just as was done for the "Juneau Temperature" selection above. [Note: The text in each Process Point in our example, shown below, was given a different color for demonstrative purposes only.]
Three Web Service-Connected Process Points Added within the GraphWorX64 Display
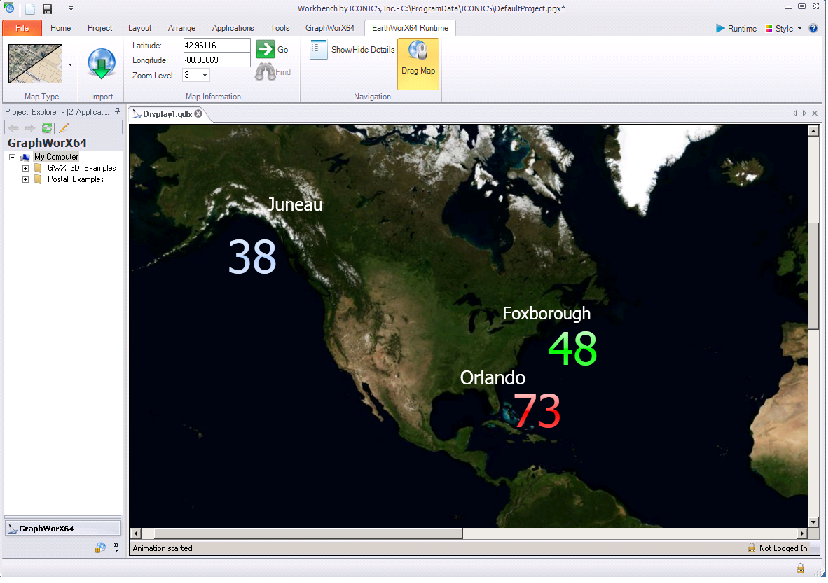
- Now that our weather map example is complete within GraphWorX64's Configuration Mode, we can test it by putting the application into its Runtime Mode. As of 11:15 on Wednesday, April 11, 2012, these were the correct temperatures in Juneau, AK; Foxborough, MA; and Orlando, FL.
GraphWorX64 Display in Runtime Featuring Live Web Services Data
See Also:
Working with Web Services Data
Configuring Databases Using the Web Services Provider
Configuring Web Services
Web Services Overview
