|
|
The features on this page require an add-on to work with GENESIS64 Basic SCADA. |

![]()
|
|
The features on this page require an add-on to work with GENESIS64 Basic SCADA. |
![]()
SNMP counters are involved in monitoring the performance of the SNMP point manager and can be accessed in the Data Browser under Data Connectivity > SNMP > .counters or Data Connectivity > SNMP > network > device > .counters.
SNMP Counters include:
SNMP Counters in the Data Browser in the Workbench
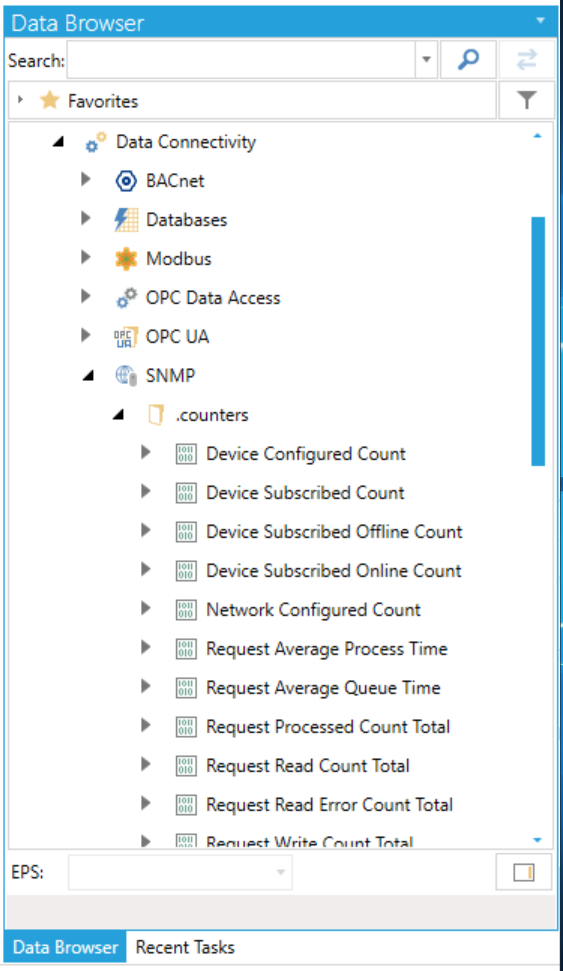
Device Configured Count – The number of the devices configured in the configuration database.
Device Subscribed Count – The number of the devices on scan (some point from the device is subscribed). It’s sum of Device Subscribed Offline Count and Device Subscribed Online Count counters.
Device Subscribed Offline Count – The number of the devices that are on scan but offline
Device Subscribed Online Count – The number of the devices that are on scan and online.
Network Configured Count – The number of the networks configured in the configuration database.
Request Average Process Time – The average time that is needed to process one request (read or write), calculated since the point manager was started.
Request Average Queue Time – The average time that the request waits in the processing queue, calculated since the point manager was started. (This is part of the average process time.)
Request Processed Count Total – The total number of the processed requests since the point manager was started.
Request Read Count - The total number of currently running read requests.
Request Read Count Total – The total number of read requests processed since the point manager was started.
Request Read Error Count Total – The total number of read errors encountered since the point manager was started.
Request Write Count Total – The total number of write requests since the point manager was started.
Request Write Error Count Total – The total number of write errors encountered since the point manager was started.
Server Running – Elapsed time from the moment when the point manager was started.
Server Started – The timestamp of when the server was started, UTC time.
Socket Allocated Count – The number of allocated sockets that are used for the communication with devices over the network.
Socket Blocked Count – The number of the sockets that are currently in use.
Socket Blocked Count Total – The total number of the sockets that have been created since the point manager was started.
Socket Freed Count – The number of the sockets that are currently available.
Socket Freed Count Total – The total number of the sockets that have been freed since the point manager was started.
Tag Client DA Subscription Count – The number of active client DA subscriptions.
Tag Configured Count – The number of the configured tags in the configuration database.
Trap Aborted Count Total – The total number of aborted traps.
Trap Configured Count – The number of the traps configured in the configuration database.
Trap Error Count Total – The total number of the errors when receiving the traps.
Trap Received Count Total – The total number of the received traps.
Request Average Process Time – The average time that is needed to process one request (read or write), calculated since the point manager was started.
Request Average Queue Time – The average time that the request waits in the processing queue, calculated since the point manager was started. (This is part of the average process time.)
Request Processed Count Total – The total number of the processed requests since the point manager was started.
Request Read Count - The total number of currently running read requests.
Request Read Count Total – The total number of read requests processed since the point manager was started.
Request Read Error Count Total – The total number of read errors encountered since the point manager was started.
Request Write Count Total – The total number of write requests since the point manager was started.
Request Write Error Count Total – The total number of write errors encountered since the point manager was started.
Tag Subscribed Count – The number of currently subscribed tags, including DA and dataset tags.
See Also: