|
|
The features on this page require an add-on to work with GENESIS64 Basic SCADA. |

![]()
|
|
The features on this page require an add-on to work with GENESIS64 Basic SCADA. |
![]()
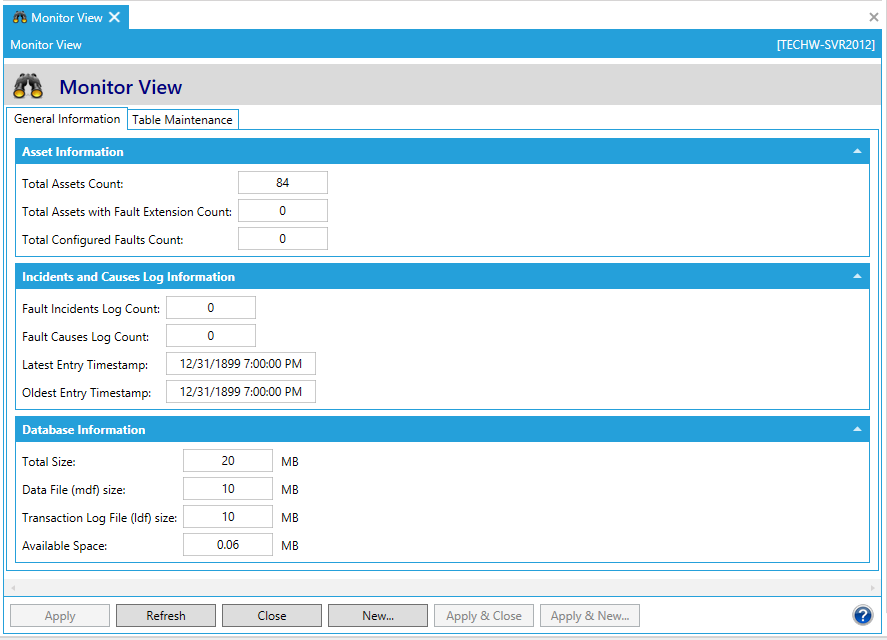
The Monitor View node within FDDWorX presents application-specific statistics so that users can see, at a glance, what the application is doing and what can be managed. In addition, if ever necessary, users can provide this information to ICONICS technical support for further guidance.
Monitor View Node in FDDWorX
The Monitor View Node in FDDWorX is comprised of two tabs, including:
General Information Tab in the Monitor View Node in FDDWorX
The General Information tab provides the following information:
Asset Information
Total Assets Count
Total FDD Assets Count
Total Configured Faults Count
Incidents and Causes Log Information
Fault Incidents Log Count
Fault Causes Log Count
Latest Entry Timestamp
Oldest Entry Timestamp
Database Information
Total Size
Data File (mdf) size
Transaction Log File (ldf) size
Available Space
Table Maintenance Tab in the Monitor View Node in FDDWorX
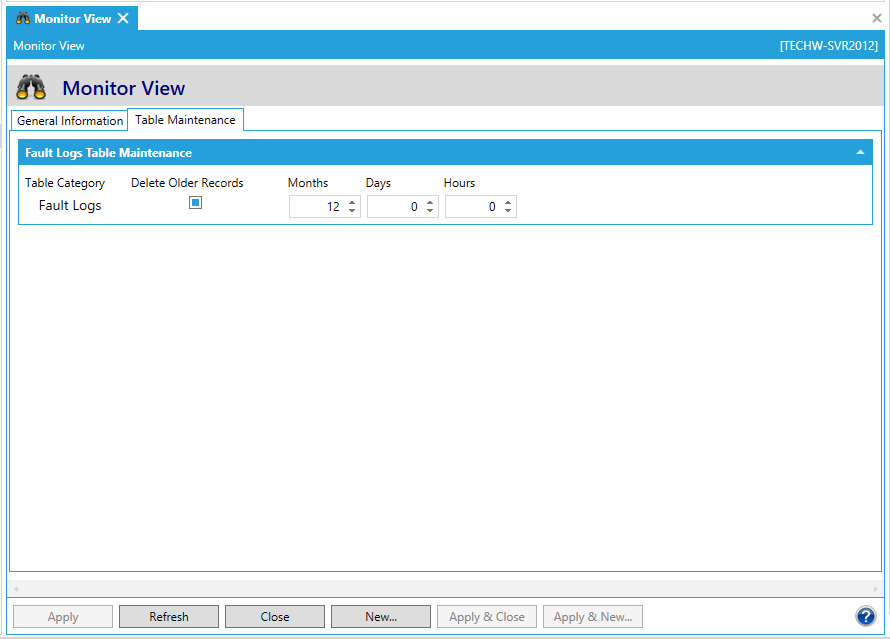
The Table Maintenace tab provides the following information:
Fault Logs Table Maintenance
Provides the ability to Delete Older Records, based on their age set by the user (in Months/Days/Hours).