|
|
The features on this page require an add-on to work with GENESIS64 Basic SCADA. |

![]()
|
|
The features on this page require an add-on to work with GENESIS64 Basic SCADA. |
![]()
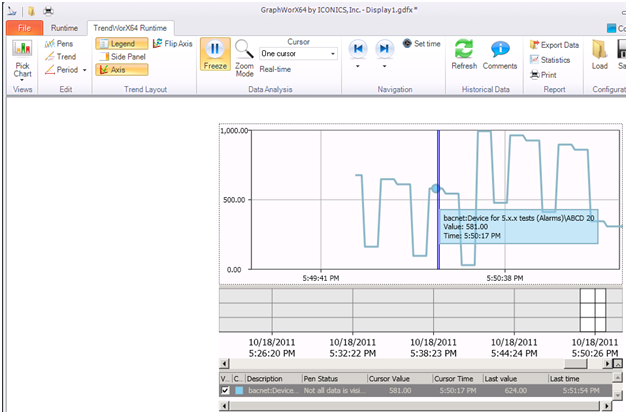
If a user wants to review all loaded data (for example, data which are beyond the actual real-time period) in detail and without continuously updating, he or she can 'Freeze' the control by clicking the appropriate button in the ribbon, after selecting the control in Runtime mode (as is specified in Steps 1 and 2 of "Real-time Mode").
Please note that even if the control is in Freeze mode, it still receives data updates in the background and the user can display them in Freeze mode or they’ll be displayed after the user switches back to the Real-time mode. To use Freeze mode:
Switch GraphWorX64, with a properly set TrendWorX64 Viewer, to Runtime mode.
Click the TrendWorX64 Viewer control inside GraphWorX’s canvas to get ribbon options (buttons) for the control.
Click the ‘Freeze’ button in the ribbon.
Now you can see the Overview Trend under the chart appeared and can do following:
Set boundaries of displayed portions of data by simple dragging the ‘drag-bar’ left or right in the Overview Trend (marked with a red, dashed rectangle in the picture below).
Get detailed information about a trend value in time by dragging a blue cursor in the chart.
By clicking the ‘Set time’ button in the ‘Navigation’ pane of the ribbon, you can get a dialog where you can exactly set the starting and ending time of the displayed period.
To exit Freeze mode, simply click the Freeze button in the ribbon again.
It is also possible to use a Zoom Mode in both modes (Real-time and Freeze) which allows the user to zoom to specific, rectangle-shaped portions of data:
Switch GraphWorX64, with a properly set TrendWorX64 Viewer, to Runtime mode.
Click the TrendWorX64 Viewer control inside GraphWorX’s canvas to get ribbon options (buttons) for it.
Make sure that Zoom Mode is enabled by making sure that the ‘Zoom Mode’ button is highlighted.
Then, you can draw a rectangle in the chart (as the following image shows). After releasing the mouse button, you’ll be zoomed to that specified portion.
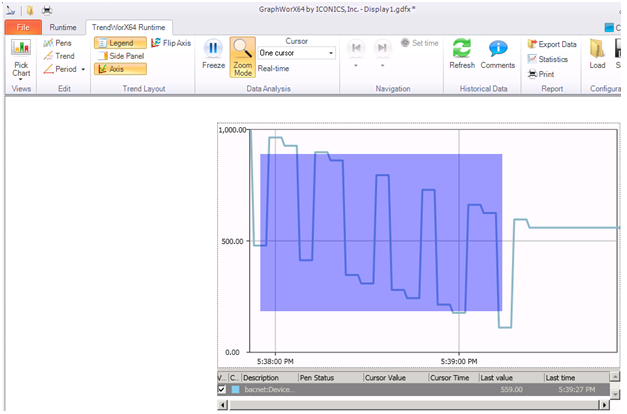
You can reset the zoom by right-clicking on the chart and choosing the ‘Reset Zoom’ context menu item.
See Also:
Displaying a Specific Portion of the Data