|
|
The features on this page require an add-on to work with GENESIS64 Basic SCADA. |

![]()
|
|
The features on this page require an add-on to work with GENESIS64 Basic SCADA. |
![]()
To Display BACnet Trends, Do the Following:
Launch GraphWorX64.
Insert the TrendWorX64 Viewer control by choosing it in the ‘Controls’ tab and draw a rectangle in the canvas to place a TrendWorX64 Viewer.
Double-click the displayed viewer in order to open its properties and settings.
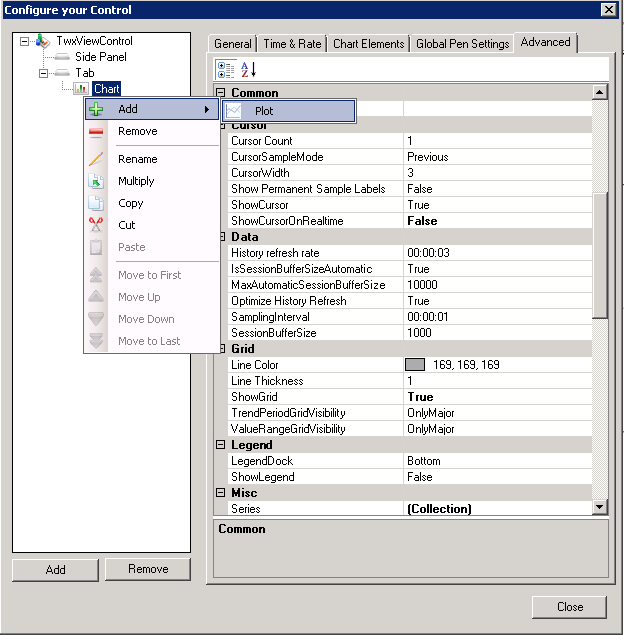
In the opened dialog window, right-click the ‘Chart’ tree item and choose ‘Add’ -> ’Plot’.
Now, right-click the newly created ‘Plot’ item in the tree and choose ‘Add’ -> ‘Pen’.
Select the newly created ‘Pen’ in the tree and in the ‘Data’ section, click the ‘…’ button next to the first item ‘Data Source’. The Data Browser will open.
In the Data Browser’s ‘Shortcuts’ pane, on the left side, choose ‘Home’ and you’ll be switched to the root of the Data Browser.
In the ‘Grid’, choose ‘BACnet’ at the very top of the list. (Please refer to the Important Note in the GraphWorX64 section.)
Choose (double-click) your desired BACnet device from the list to see the objects provided by it.
In the list of objects, find your desired Trend Log object (or Trend Log Multiple object) providing trend data.
Confirm the selection by clicking 'OK' in the Data Browser. This will add a Data Source path to the selected Trend Log object.
Now, click the ‘Advanced Configuration’ button placed below the Data Source combo box where the path is listed and a new dialog window will appear.
There, switch the radio buttons to ‘Use Dataset connection’.
The content of the dialog window will slightly change and you will be able to bind the Value and Timestamp columns appropriately
Confirm your changes in the 'Advanced Configuration' dialog window.
Now, you can close the dialog window for TrendWorX64 Viewer’s configuration.
Switch GraphWorX64 to Runtime mode. You will see a line representing data stored in the Trend Log (maybe you will need to change vertical scale of graph. To do so, proceed with a left mouse click to the area of vertical axis ranges. A dialog window will appear where you can change it).
See Also:
Displaying Trends from Trend Log Multiple Objects