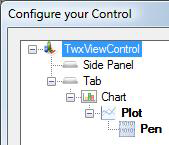
As you work to create trends (as described in Working With Trends), various elements of the TrendWorX64 Viewer display are under your control through settings you make on the ribbon or in the TrendWorX Viewer Configurator . As you select different objects, different display options become available. You control the look and feel of your trend display by controlling each of the levels within the trend object. The Configurator represents these levels in the form of a tree: TrendViewer object, the viewer's tabs, each tab's charts, each chart's plots, and each plot's pens. In the illustration, you can also see that you can define a side panel (refer to the Side Panels for Trends topic for more information).
TrendViewer Configurator's Tree Structure, a Simplified Version
When you define a property at a parent level that is higher in this tree, the property becomes the default for a child object lower in the tree. If you change a property to a different setting at the child level, that child-level property takes precedence and is applied. Keep in mind that the dialog boxes you see are slightly different for each object type.
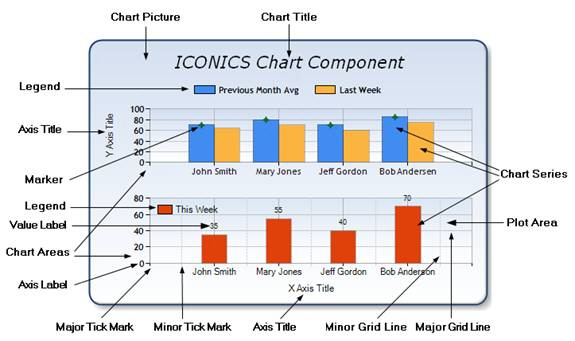
A chart can contain different components that help you visualize your data. Certain elements such as the chart types affect the way that the data points are displayed. You can also show labels, a grid, axes, legends, and many other visual elements.
The chart's overall display properties are determined by the TrendWorX64 Viewer object. The object lets you set the grid, axes, legend, and some other properties. In the TrendWorX64 Viewer Configurator, the Viewer object has options on the following tabs: Appearance Tab and Advanced Tab.
It is possible to define multiple tabs on which you would see entirely distinct and unique displays. One use of tabs in a trend display is to create different sets of human-machine interfaces (HMIs). For example, if you were monitoring the physical plant of a large building, one tab might show the sensors for your lights, another tab might include the sensors for temperature, and yet another tab might indicate whether the doors are locked or unlocked. Alternatively, each tab could show the lights for each floor of the building. The way you use tabs is entirely at your discretion. You can also display smaller summary charts in a side panel next to the viewer's tabs. In the TrendWorX64 Viewer Configurator, the Tab object has options on the following tabs: Appearance Tab and Advanced Tab.
The chart object contains most of the common chart properties. Many of these common properties can be changed at runtime. For example, to display a set of axes, a grid, a legend, or a chart in 3D Mode, perform one of the following actions:
In Configuration mode, click the Configure button in the Configure group on the TrendWorX64 Viewer Configuration ribbon and make selections from the options found on the Advanced tabs of the configurator for all object types (e.g. Trend Viewer, Tab, Chart View, Plot, and Pen objects).
In Configuration mode, enable the Axis, Legend, Grid, or 3D Mode check box in the Views group on the TrendWorX64 Viewer Configuration ribbon.
In Runtime mode, click the Axis button or the Legend buttons in the Trend Layout group on the TrendWorX64 Runtime ribbon.
In Runtime mode, click the Show/Hide Axes button or the Show/Hide Legend button on the runtime toolbar.
In Runtime mode, click the Edit Pens button or the Edit Trend button on the runtime toolbar and make selections from the dialog boxes that appear.
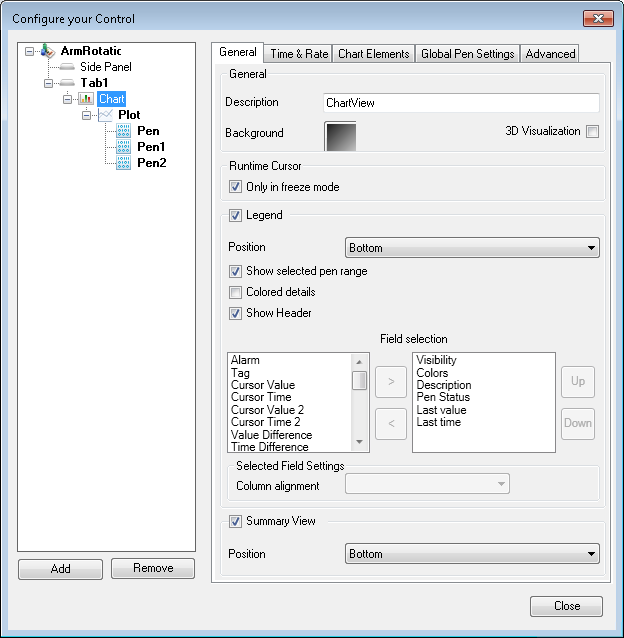
The appearance options for the Chart object are configured on the General tab and on the Chart Elements tab. These properties are a superset of the properties that are available to you from either the TrendWorX64 Viewer Configuration ribbon or through the runtime toolbar buttons. For a more complete description of the Chart object, refer to the topic Chart Options for Trends.
For a chart you can have multiple plots, which are represented in TrendWorX64 Viewer by the Pen object. One pen might plot using a line chart, another pen might plot using area chart types, and still another one might have summary information. The best way to think about a pen is that it reflects one style of plotting data, as specified on its Plot tab. For a description of how to design a plot, refer to Plot Options for Trend Charts.
Finally, the pen object determines the data that is actually drawn. The pen connects the chart to the data source. The actual manner in which the chart is drawn: as a line, area, bar display, and so forth is determined by the plot (or pen group) selection, and not the pen. For a description of how to design a pen, refer to Pen Options for Trends.
The data you see in a trend chart is affected by different display options you select. A data source may have a certain collection rate, but you have independent control over the following factors:
How often a data point is displayed in your chart.
How often the chart is refreshed.
The amount of time that data is displayed in the visible chart.
The value of the different axes, and how they are drawn.
How often summary data is recalculated.
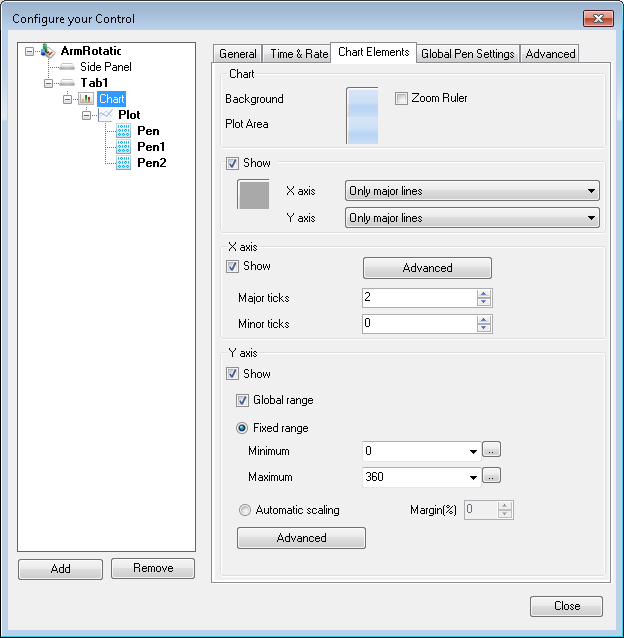
The primary settings for changing these settings are found in the tabs for Chart objects in the TrendWorX64 Viewer Configurator (General, Time & Rate, Chart Elements, and Global Settings). These tabs are described in the topic Chart Options for Trends.
The configurator also includes the General, Ranges, Alarm, and Ideal Pen tabs for Pen objects, as described in the topic Pen Options for Trends.
See also:
TrendWorX64 Viewer Configuration Ribbon