|
|
The features on this page require a GENESIS64 Advanced license and are not available with GENESIS64 Basic SCADA . |
|
|
The features on this page require a GENESIS64 Advanced license and are not available with GENESIS64 Basic SCADA . |
The performance monitor that comes with Windows can be useful in debugging application crashes and detecting memory leaks. You can set the performance monitor to log information about the health of your computer programs to determine what is causing a crash or memory leak.
This topic intends to walk you through the steps necessary to create a performance log on any of the operating systems mentioned above.
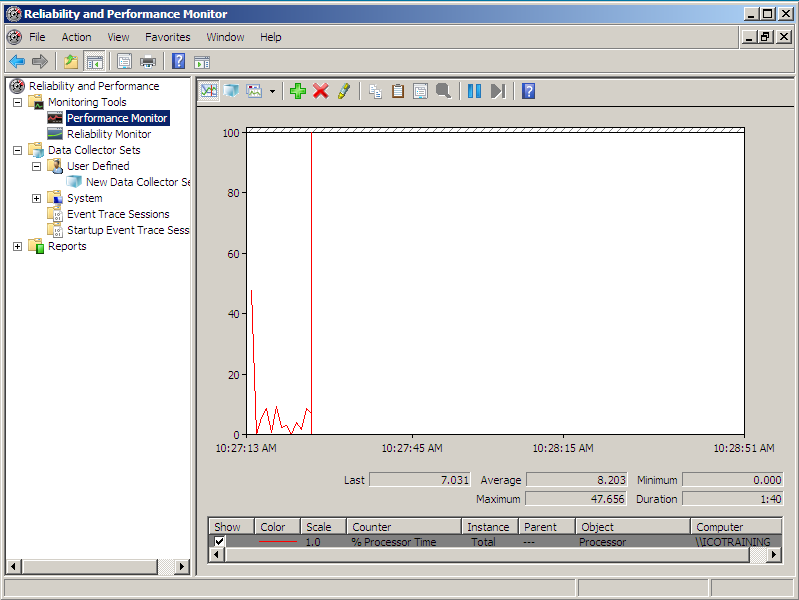
Open the Performance Monitor from Administrative Tools or search for “perfmon”.
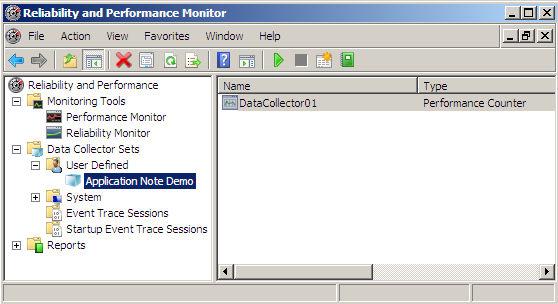
Once you have that opened, you should see a screen similar to the one in Figure 1.
Figure 1 - Reliability and Performance Monitor
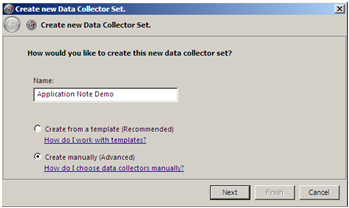
Under the Data Collector Sets, right-click on User Defined and select New -> Data Collector Set
In the new dialog that comes up, enter the Name of this Data Collector set and select the Create Manually (Advanced) option. Click on Next when you are done.
Figure 2 - Create New Data Collector Set Dialog
In this screen, check the Performance counter under the Create data logs section and click on Next.
In this step, you will need to add the necessary performance counters. Click on the Add button to open the Add Counter dialog.
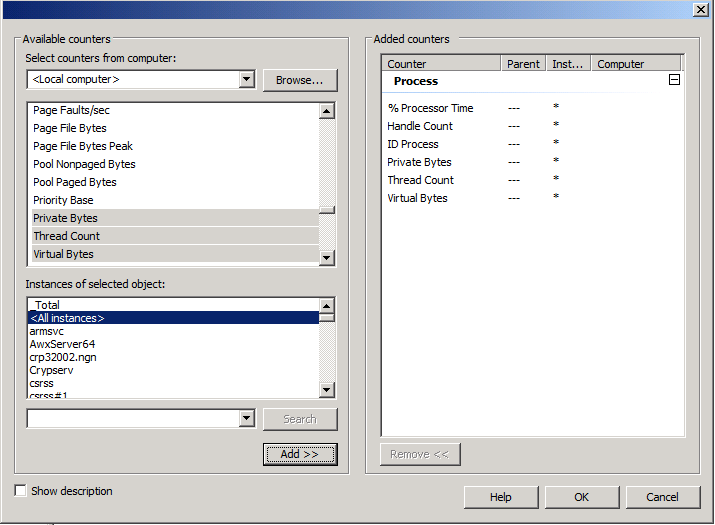
In the Available Counters section, make sure the “select counters from computer” option is set to the local computer.
Expand Process and select the following counters: % Processor Time, Handle Count, ID Process, Private Bytes, Thread Count, and Virtual Bytes. You can select multiple counters by holding ctrl and clicking.
In the Instances of selected object section, choose <All Instances>, then click on the Add button at the bottom. Your finished configuration may look similar to Figure 3.
Figure 3 - Performance Counters
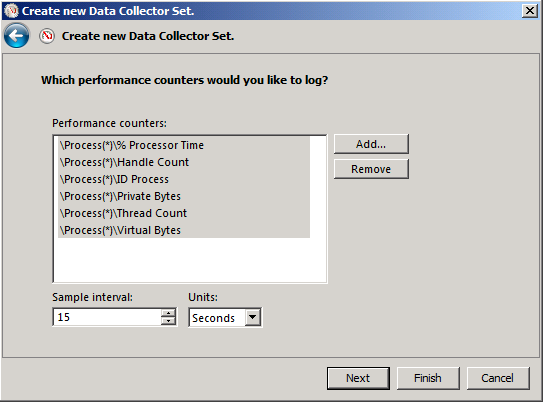
Click on OK to return to the Create New Data Collector Set dialog. You should now see the list of counters you have added in here.
Just below the Performance counters section, you can set the logging intervals. Set the Interval and Units appropriately. The shorter the interval the more data you will collect, but the greater it will affect your system’s overall performance. Select a long interval if you do not know when the problem will occur or you know it will not occur for a while. Select a shorter interval if the problem is frequent or will happen soon. If you are unsure, a good default setting is every 1 minute.
Figure 4 - Configured Performance Counter and Interval
Click on Finish when you are done. You have now created a performance log. You should see that under your Data Collector Sets -> User Defined section of the Reliability and Performance Monitor.
Figure 5 - Configured Log in the MMC
To start collecting data, click on the green start button at the top of the management console.
Note that if you need to restart your computer while logging, the log will stop. You must manually restart the log after each reboot of the computer. To restart the log you can go back into the Reliability and Performance Monitor console and use the same procedure as described in the previous step to start the log again.
