From Sensor to HMI in Three Minutes
This topic lets you explore the ease of configuring an OPC Unified Architecture SCADA/HMI solution in just a few minutes.
So that you can connect to plant floor equipment, we will configure a tag in the OPC Server. Then, we will visualize this tag in GraphWorX64 and monitor it for alarms using AlarmWorX64.
Configure ICONICS OPC UA Server
To connect to real-time data sources you will use an OPC Server. If an OPC server is readily available and configured, skip to the next section: Configuring a Process Point.
If you need an OPC server, you can install the ICONICS OPC UA Server by Kepware from the ICONICS OPC SERVERS v4.2 disk and choose the desired device protocol for your PLC or Loop Controller.
Once you have successfully installed the ICONICS OPC UA Server by Kepware, you will need to configure it.
- Start the OPC server Configuration Dialog.
- Select Edit -> Device -> New Channel… from the menu.
- In the New Channel Identification dialog, give this channel a name and click on Next.
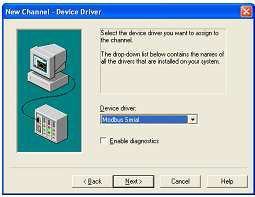
- In the New Channel – Device Driver dialog, select a driver from the list of available protocols and click on Next. This driver should be one that can communicate to the desired device.
Figure 1 - Selecting the Modbus Serial driver
- In the New Channel – Communications dialog, verify the communication port settings and click on Next, until you can click on Finish.
- Select Edit -> Devices -> New Device from the menu.
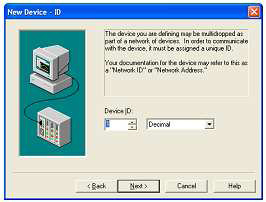
- A New Device dialog comes up. Give the device a name and click on Next, a couple times to display the New Device – ID dialog.
- Verify the device node address (device id) of the multidropped PLC.
Figure 2 - Setting the Device ID
- Click Next a few times and then click on Finish to complete the device setup.
- Select Edit -> Devices -> New Tag from the menu.
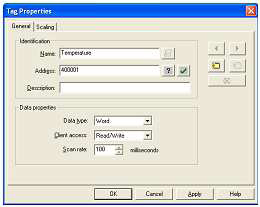
- In the Tag Properties dialog, specify a meaningful name for the tag, for instance Temperature, specify the Address of the register in the PLC where the temperature value is stored (for instance 400001) and click on OK.
Figure 3 - Creating Properties for a Tag
NOTE: If you’re not certain about the communication settings or the communication cable, change the Device Properties to “Simulate Device” in order to get simulated sensor values for now.
- Save the configuration and exit the UA server configurator.
Configuring a Process Point
Now that we have a tag in the OPC server, we can display it using GraphWorX64.
- Go to Start -> All Programs -> ICONICS GENESIS64 -> GraphWorX64 -> GraphWorX to open a display.
- On the Dynamics tab of the ribbon, click on the Process Point in the Text Objects section, and place it on the display. The Data Browser opens.
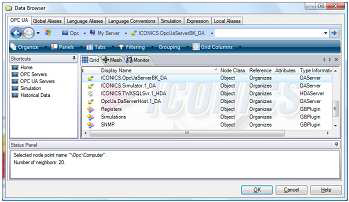
Figure 4 - Using the Data Browser to Select My Server
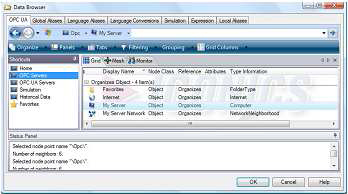
- If you are using the ICONICS UA Server (which we setup in the previous section), double-click on the ICONICS.OpcUaServerBK_DA and drill down to your configured Temperature tag. Otherwise, you can select any tag from any OPC server that you are using.
Figure 5 - Using the Data Browser to Select the ICONICS OPC Server
- Once you have selected the data source for the process point, click on Runtime in the upper-left corner of the GraphWorX64 application. The process point shows the actual temperature.
NOTE: If you see **** on the screen, this indicates that the PLC is switched off, or the communication cable between the OPC Server and the PLC in unplugged.
- To add a bar graph indicating the temperature, you can click on Configure and select the Home tab of the ribbon.
- Select the Rectangle button in the Shapes section; hold the left-mouse button down while you drag the mouse to draw a rectangle similar to Figure 6.
- Right-mouse click to exit the drawing mode. If your rectangle is not currently selected, select it, then click the RED color to repaint the object.
- Select the Size action from the Dynamics tab, as shown in the figure.
Figure 6 - Adding the Size Dynamic to the Rectangle Object
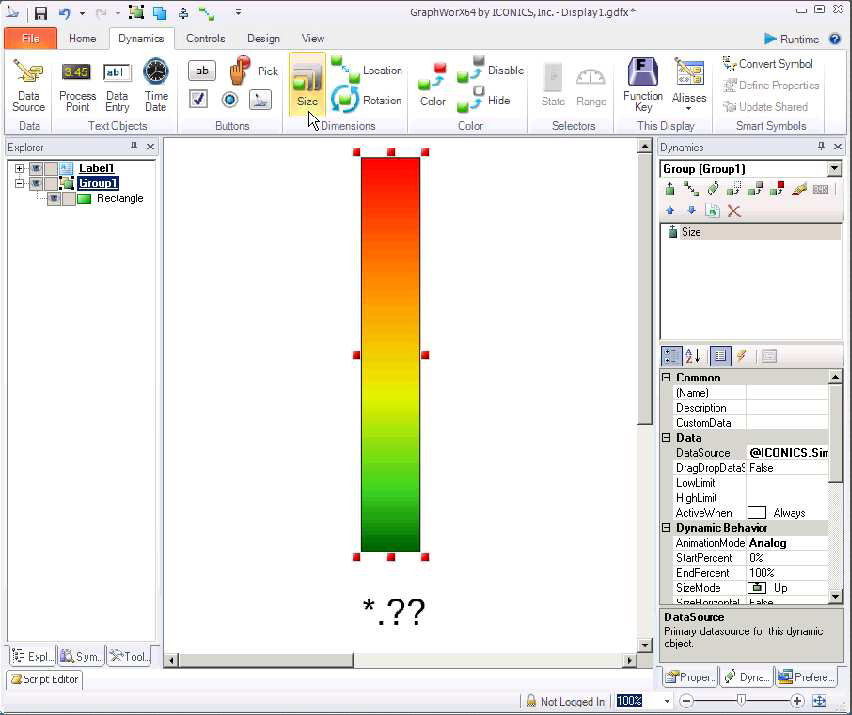
- Click on the ellipse [...] button in the DataSource property field to browse for the tag as described before.
- Consider changing the LowLimit and HighLimit Properties to a range that makes sense for your temperature. Possibly measurements are expected within the range of 0 and 350 degrees.
- Go into runtime. You can watch the rectangle resize as the temperature changes.
Configuring the AlarmWorX64 Server
The AlarmWorX64 Server is used to monitor if the temperature stays within limits. Follow the steps below to configure an alarm.
- Start the GENESIS64 Workbench and select the AlarmWorX64 Server application. The handle (indicated in red) can be moved upwards to expand the list with applications presented.
Figure 7 - Using the AlarmWorX64 Server
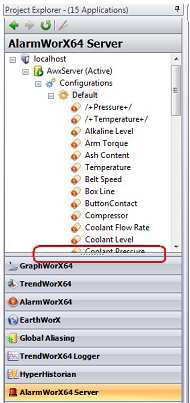
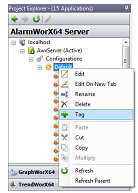
- Expand the localhost tree and right-click on the Default alarm configuration and select add tag.
Figure 8 - Adding a Tag to the AlarmWorX64 Server
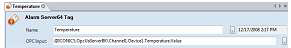
- Give the alarm a Name of Temperature and browse for the Temperature tag in the OPC Input field.
Figure 9 - Defining the Properties of a Tag in AlarmWorX64 Server
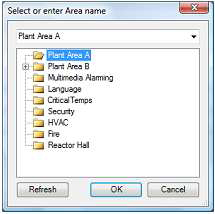
- The General tab is also used to associate the alarm tag to one or more alarm areas. Click on the Add button for the Areas and double click Plant Area A and click on OK.
Figure 10 - Selecting the Area of the Alarm
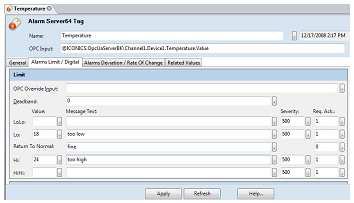
- Click on the Alarms Limit/Digital tab and configure the Limits as shown in Figure 11 and click Apply.
Figure 11 - Creating a Limit/Digital Alarm
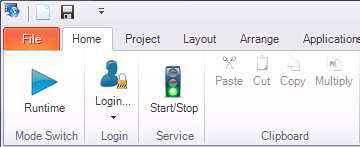
- The Green light indicates that the Alarm Server is running and alarms are monitored.
Figure 12 - AlarmWorX64 Server Started
Viewing the Alarm
- To visualize alarms we need to add the ICONICS AlarmWorX64 Viewer to the Display.
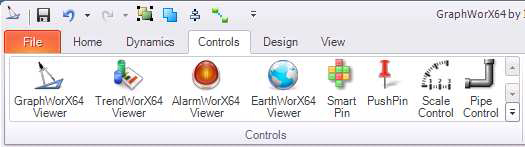
- Click the AlarmWorX64 Viewer in the Controls tab.
Figure 13 - Controls Tab of the GraphWorX64 Ribbon
- In the contents area, hold down the left-mouse button while you drag the mouse to draw the desired size of alarm viewer.
- There should already be a default subscription to the viewer. If you go into runtime, you should see your alarm when it reaches the alarming state.
Viewing a Trend
- In configuration mode of GraphWorX64, click on the TrendWorX64 Viewer in the Controls tab of the ribbon.
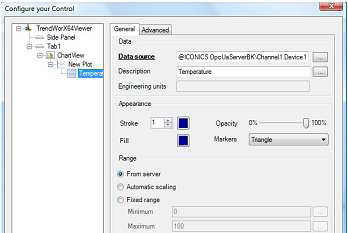
- Double-click the TrendWorX Viewer and click on Chart View to set the Legend to be shown in the Bottom of the Trend.
- Click New Pen to change the Data source. You can select the same tag (temperature) that we have been using.
- You can change the Pen Description can be changed to Temperature.
Figure 14 - Configuring the TrendWorX64 Viewer
- Click OK until you are back in the GraphWorX64 display contents area.
- Your display should look now look similar to the figure below.
Figure 15 - Display with TrendWorX64 and AlarmWorX64 Viewers
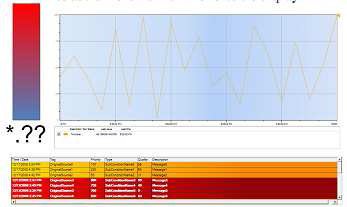
- Save the display. When you go into runtime, you should see your temperature trend, along with alarms and a temperature status bar.