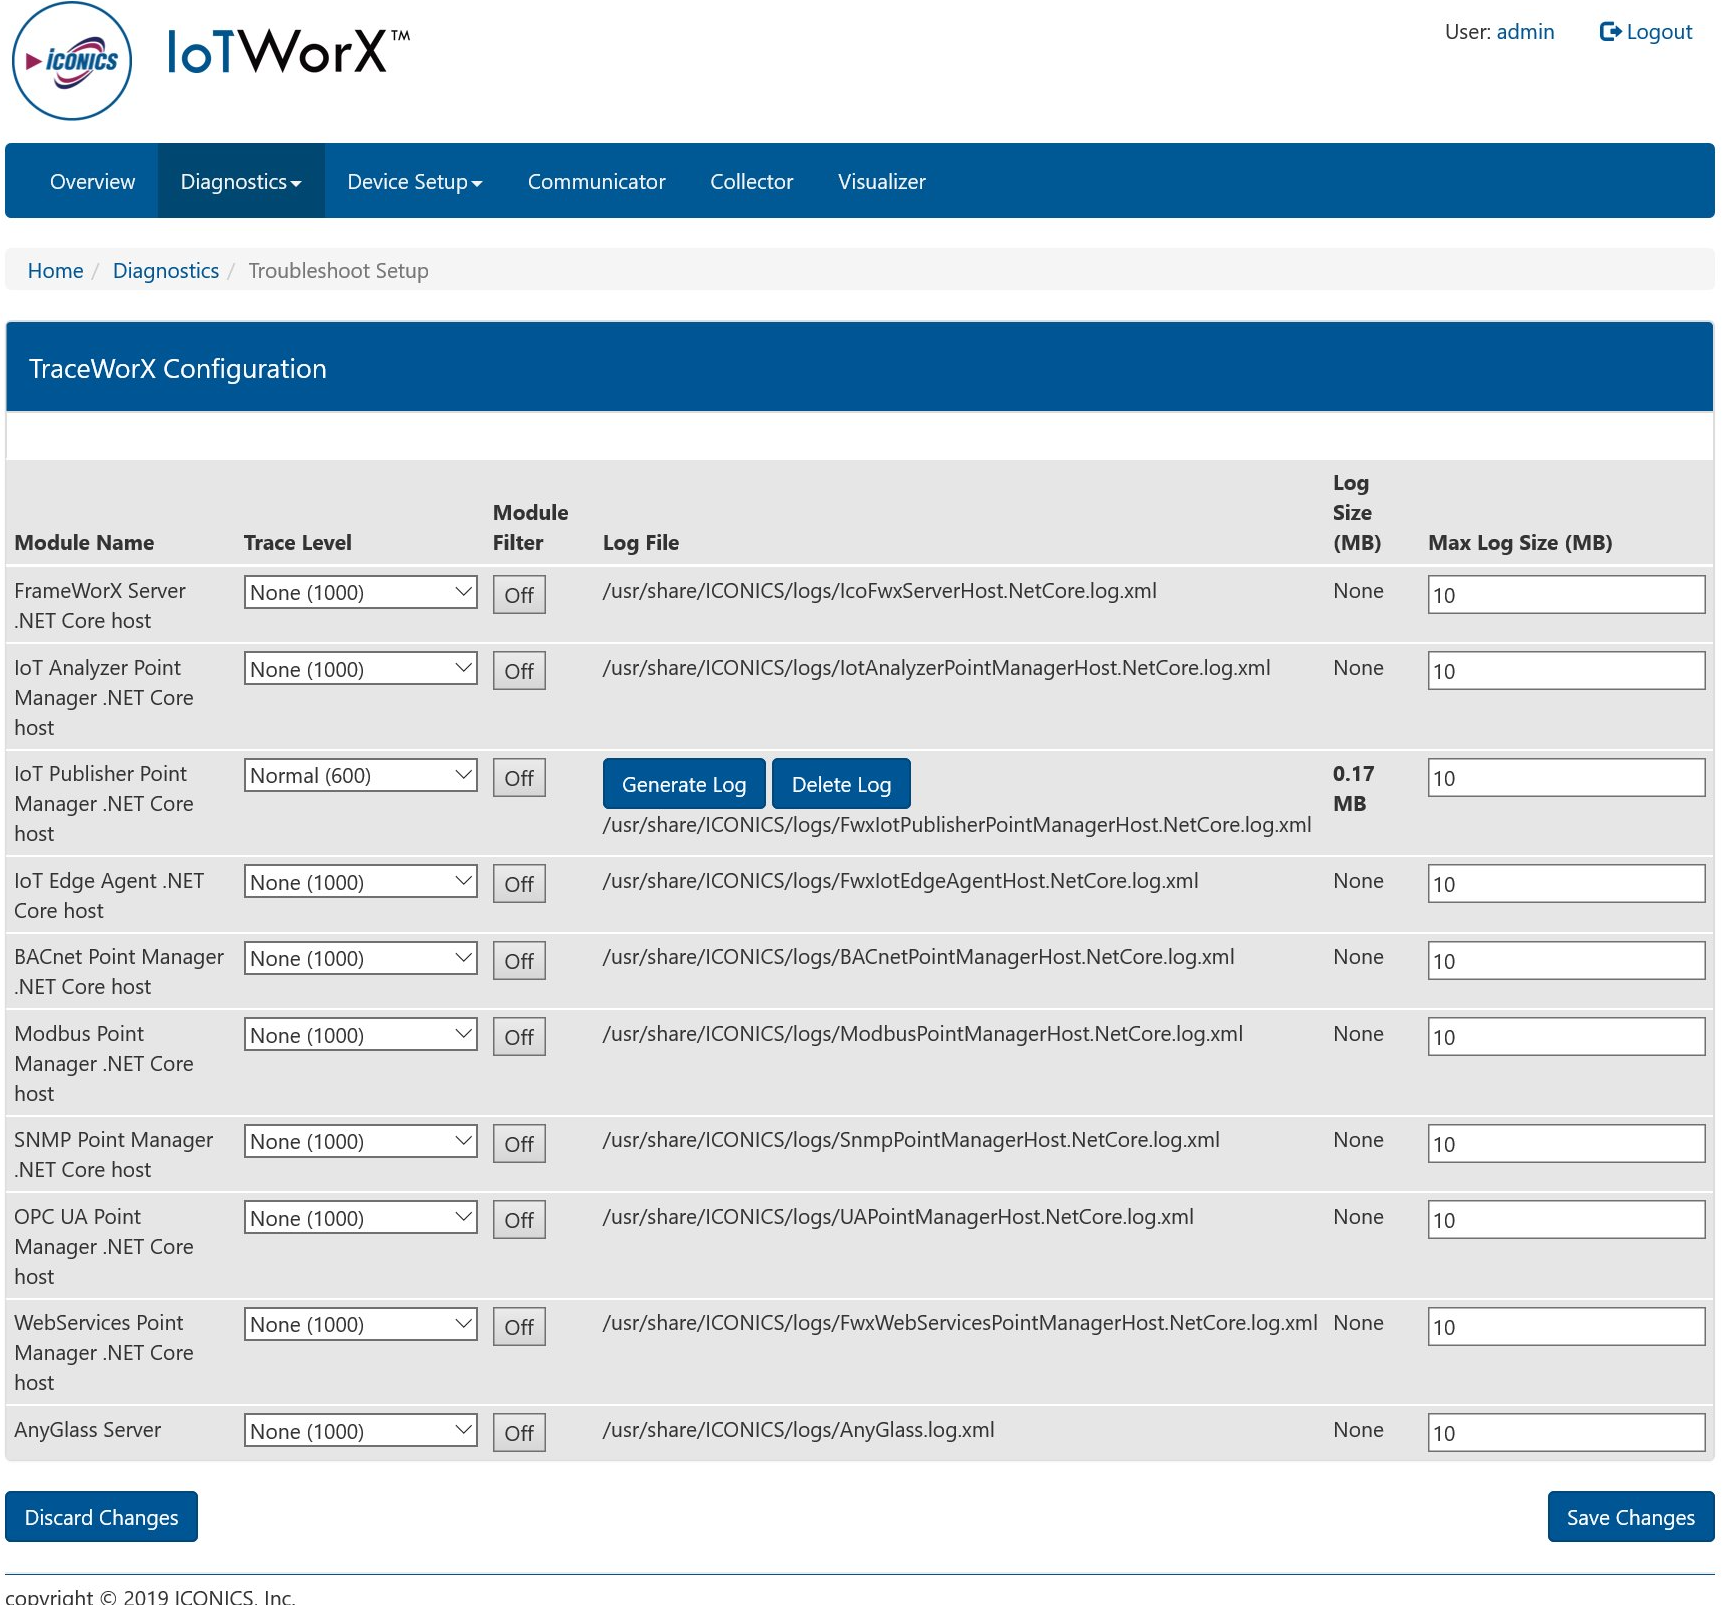
The Troubleshoot Setup selection, shown below, from the Diagnostics tab in IoTWorX, is similar to the functionality provided by ICONICS' TraceWorX utility within its GENESIS64 HMI/SCADA suite. The troubleshooting logs configured through this page can then be viewed through the Troubleshoot View.
Diagnostics - Troubleshoot

For each listed Module Name, you are able to set the Trace Level [None (1000), Severe Error (900), Error (800), Warning (700), Normal (600), Debug (400), Debug Verbose (100), or All (0)] via the pulldown menu.
You can opt to utilize a Module Filter, by clicking on the Off button to set the module filter properties. Once you click the button, you can activate the module filter by clicking on the checkbox for Use Module Filter. You can then provide a Module Name in the now active text entry field, as well as set the filter's own Trace Level, using the same options as the described above. Click the plus button [+] if you wish to add additional module filters for the selected Module Name. Once you have finished setting your Module Filter(s), click on the Apply button. Once you return to the main TraceWorX Configuration list, you will see that the button next to your selected Module has changed from Off to On.
The next column includes the location of the Log File for each Module Name. Some modules may allow for manual options such as Generate Log or Delete Log. In that case, generating the log then allows you to download the associated log file.
The next column, Log Size (MB), shows the current log size in megabytes. This number will grow when the log is active.
The final column, Max Log Size (MB), allows you to enter a maximum file size, in megabytes, for each individual Module.
If you have made any changes you wish to remove, you can click on the Discard Changes button at any point.
If you have completed making changes to the Troubleshoot Setup section of the Diagnostics tab, click the Save Changes button.
See Also: