When working with an IoT device to utilize cloud services/resources with ICONICS' automation software solutions, you will be able to access the IoTWorX user interface in a manner similar to configuring a wireless router. Once you determine the IP address of the device, you can access the IoTWorX Console, shown below, via a web browser by browsing to http://<<DeviceIPaddress>>/, in order to make any required configurations.
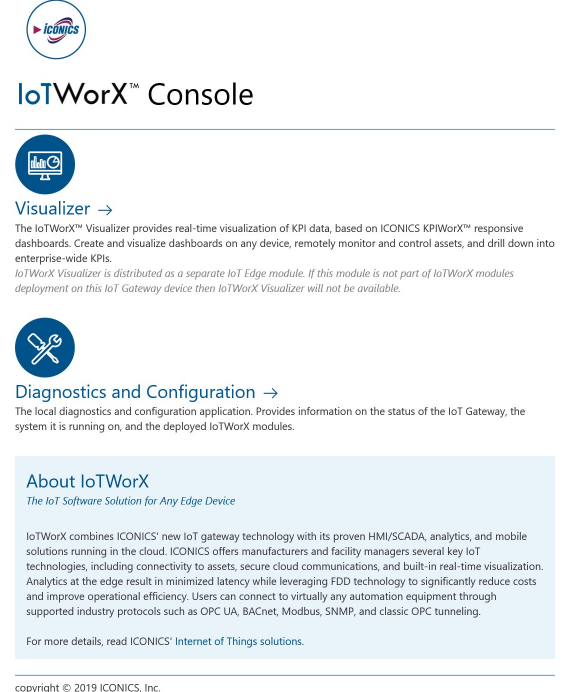
IoTWorX Console
The IoTWorX Console is split between the "Visualizer" and "Diagnostics and Configuration".
The IoTWorX™ Visualizer provides real-time visualization of KPI data, based on ICONICS KPIWorX™ responsive dashboards. Create and visualize dashboards on any device, remotely monitor and control assets, and drill down into enterprise-wide KPIs. IoTWorX Visualizer is distributed as a separate IoT Edge module. If this module is not part of IoTWorX modules deployment on the IoT device then IoTWorX Visualizer will not be available.
The local Diagnostics and Configuration application provides information on the status of the IoT device, the system it is running on, and the deployed IoTWorX modules.
Version 10.95.4 included GenBroker and Health Monitor support as part of the IoT device installation. Version 10.96 IoT edge devices do not currently support GenBroker or Health Monitor, but these configurations are still supported when deploying and managing 10.95 edge devices.
See Also: