|
|
The features on this page require a GENESIS64 Advanced license and are not available with GENESIS64 Basic SCADA . |

![]()
|
|
The features on this page require a GENESIS64 Advanced license and are not available with GENESIS64 Basic SCADA . |
![]()
OS Requirement: Windows 7 x64/ Windows 8 x64/ Windows 8.1 x64/ Windows Server 2008 x64/ Windows Server 2008 R2 x64/ Windows Server 2012/ Windows Server 2012 R2
General Requirement: GENESIS64, Hyper Historian or AnalytiX version 10.85 or later installed, SQL Server 2012 or 2014 with Reporting Services installed, basic GENESIS64 knowledge, for Report Template editing or creation, basic SQL knowledge.
The Project Reporting feature, introduced in version 10.85, allows users to report on the data sources in use by their project. The data sources can be checked for validity so that incorrect tags can be quickly identified. It can aid in troubleshooting problems that may occur during initial setup, project deployment, or during runtime.
This Help topic will describe how to enable Project Reporting, the two types of reports (Configured Tags Report and Runtime Use Report), the different reporting actions, and some options.
Project Reporting requires SQL Server Reporting Services (SSRS) for the actual report generation. The recommended approach is to have both the SQL Server Engine and the SSRS on a single server. However, with the appropriate SQL Server licenses, they can exist on separate nodes.
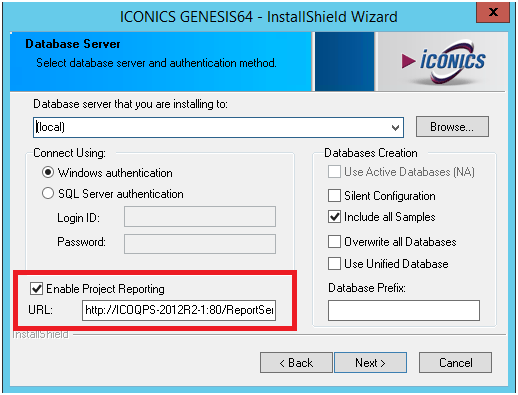
To enable Project Reporting during installation, check the Enable Project Reporting box and, if necessary, fill in your SSRS URL as shown in Figure 1.
Figure 1 - Enabling Project Reporting During Installation
If SSRS was not installed until after the installation, or if you otherwise did not enable Project Reporting during the install, please follow these steps to enable project reporting:
From the Components folder (located by default at “C:\Program Files\ICONICS\GENESIS64\Components”), launch “IcoWorkbenchSqlSetup.exe”.
On the Project Reporting tab, check the Enable Project Reporting box.
If necessary, use the Configure SSRS button to automatically configure SSRS.
NOTE: A remote SSRS server cannot be auto-configured. It must be manually configured through the SQL Server Reporting Services Configuration Manager.
Select or type in your SSRS URL.
Click Apply.
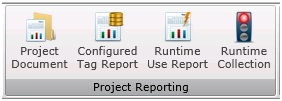
All reports are triggered from the Workbench on the ProjectWorX ribbon. To run a report, click the desired report type and follow the prompts. More information on the different report types and their options will be in the following sections.
Figure 2 - Project Reporting section of the ProjectWorX ribbon
A running or completed report will show up in the Task Explorer. The Task Explorer will be shown automatically after you have triggered a report. If you do not see the Task Explorer, you can go to the ProjectWorX ribbon in the Show/Hide section and check the Show the Tasks Panel box.
Figure 3 - Task Explorer Showing a Completed Report
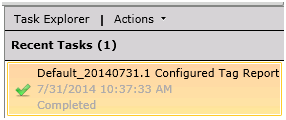
Right-click on the completed task to view a report, download it in PDF or Excel format, view the log, re-execute the report, or delete it from the task list.
Reports can contain important metadata such as Author, Project Name or Project Version. This information can be entered during the creation of a new project in the Workbench or on the ProjectWorX ribbon in the Project Properties section.
The Configured Tags Report will use static collection to gather all of the configured tags in a project and can optionally validate those tags to ensure they do not contain typos or are otherwise invalid.
This report type is designed to look for “output” data sources – data sources provided by ICONICS software. It will report on these products:
AssetWorX
BACnet
Energy AnalytiX
This report will take the following actions (which are described in further detail in the “Reporting Actions” section):
Static Collection
Validation (optional)
Report Generation
To Generate a Configured Tags Report, Perform the Following Steps:
In the Workbench, go to the ProjectWorX ribbon and click Configured Tag Report.
Click Next.
Fill in a description for this task, if desired. Select a Report Template from the list of available templates on the server, or upload a new one by using the “…” button. Click Next.
NOTE: See the section entitled “Creating New Report Templates” for more information on creating your own templates.
Select the configuration databases for the Static Collection phase. Click the “…” button at the end of each row if you’d like to report on only a specific part of the database. Click Next.
NOTE: For more information about Static Collection, see the section “Reporting Actions” and its sub-section “Static Collection”.
If you’d like to validate your tags, check the Validate collected tags box. Click Finish.
NOTE: For more information about Validation, see the section “Reporting Actions” and its sub-section “Validation”.
After you click Finish, the report progress should appear in the Task Explorer. When the task is finished you can display or download the generated report by right-clicking the completed task.
The Project Document button on the Project Reporting ribbon allows you to run a Configured Tags Report with multiple templates, combined into a single file. Other than the option to choose a cover page and pick more than one template, it works the same as a Configured Tags Report.
The Runtime Use Report will collect all of the data sources used as inputs into any ICONICS client or server using FrameWorX.
In addition to reporting on actively used data sources, the Runtime Use Report can also look through these configuration databases for inputs:
AlarmWorX64 Server
AssetWorX
Hyper Historian
Quality AnalytiX
TrendWorX64 Logger
Unified Data Manager
This report will take the following actions (all of which are optional, and all of which are described in further detail in the “Reporting Actions” section):
Static Collection
Runtime Collection*
Validation
Report Generation
NOTE: * Runtime Collection must be started manually. Any Runtime Collection data gathered so far will be included in a Runtime Use Report. See the “Reporting Actions” section and its “Runtime Collection” subsection for more details.
To Generate a Runtime Use Report, Perform the Following Steps:
In the Workbench, go to the ProjectWorX ribbon and click Runtime Use Report.
Click Next.
Fill in a description for this task, if desired. Check the Generate a report at the end of the task box if you would like to see a report at the end of this task, then select a Report Template from the list of available templates on the server, or upload new one by using the “…” button. Click Next.
NOTE: See the section entitled “Creating New Report Templates” for more information on creating your own templates.
If you would like to do a Static Collection, check the Scan active configuration databases and collect all the tags used box and select the configuration databases. Click the “…” button at the end of each row if you’d like to report on only a specific part of the database. Click Next.
NOTE: For more information about Static Collection, see the section “Reporting Actions” and its sub-section “Static Collection”.
If you’d like to validate your tags, check the Validate collected tags box. Click Finish.
NOTE: For more information about Validation, see the section “Reporting Actions” and its sub-section “Validation”.
After you click Finish, the report progress should appear in the Task Explorer. When the task is finished, you can display or download the generated report by right-clicking the completed task.
The following sub-sections are descriptions of the different actions a report can take.
The configuration databases of the given modules are examined for data source names. This approach is faster and more efficient than runtime collection, but limited to finding non-dynamic and non-aliased tags.
Both report types can perform a static collection. However, they are looking for different types of data sources. The Configured Tags Report is looking for “output” tags, and the Runtime Use Report is looking for “input” tags.
For example, when reporting on an AssetWorX configuration, the Configured Tags Report would find tags such as:
ac:Company/Foxboro bakery/North/Baking line/Ingredients mixing tank/Heating control/CurrentTemperature
The Runtime Use Report, however, would find whatever tag was used as an input to that asset (if any).
A monitoring mechanism within FrameWorX is used to collect all data points as they are requested in runtime. This approach requires that the project be active and in use in order for all tags to be gathered, but it is able to identify aliased or otherwise dynamic tags, such as those created by scripts or smart symbols.
Runtime Collection has the potential to slow down FrameWorX communication (and the system performance in general), so it should only be turned on when necessary.
To begin Runtime Collection, click the Runtime Collection button on the ProjectWorX ribbon. The stoplight should turn green. To stop Runtime Collection, click the button again and the stoplight should turn red. If it is in run mode, Runtime Collection will remain running if the Workbench is shut down.
Runtime Collection is cumulative. Each time the Runtime Collection is triggered, its results will be merged with the results of the previous Runtime Collection. This allows for users to collect runtime data on their system in stages, if desired, to avoid long periods of slow performance on a system while Runtime Collection is left running.
To flush previously collected Runtime Use data and start a new Runtime Use Report from scratch, go to the Task Explorer and select Actions à Clear Runtime Use Data.
There may be times when a known invalid point is requested very briefly, most notably when switching GraphWorX64 screens and loading aliases at the same time. These points are generally unsubscribed very quickly. Runtime Collection has a built-in timeout that requires that points remain subscribed for a minimum of 1 second before they are included in a report. This timeout can be adjusted. Go to the Task Explorer, then click Actions à Configure Runtime Collection.
Data sources collected by either Static or Runtime Collection can optionally be validated in both types of reports. FrameWorX briefly subscribes to each point to verify that the tag exists on the OPC server and notes the status or quality returned. This can reveal incorrectly configured or invalid data sources.
There are a few settings for tag validation that can be changed when running a report and choosing the Validation option.
Max concurrent points – This is the number of points (tags) that are allowed to be on scan at same time. This setting is designed to can help you to prevent overloading of the data source (e.g. OPC or BACnet device), FrameWorX Server, or your license.
Timeout (sec) – This value defines timeout for getting a value in seconds. Otherwise, the quality of this point will be marked as BAD without any value.
For example, if the max concurrent points is 100, and the timeout is 60 seconds, FrameWorX will subscribe to the first 100 points in the queue and wait for a value. Once a value is returned for any of those points, it will unsubscribe to that point and subscribe to a different point from the queue. If a subscribed point goes more than 60 seconds before returning a value, it will also be unsubscribed and a new point from the queue will be subscribed.
In this way, it will eventually subscribe to all points in the queue, ensuring that no more than 100 points are subscribed at any one time. This means that if there are 1,000 total points to validate and none of them are going to return a value (such as if the OPC server does not exist or is hung), the total validation time may be as long as 600 seconds (1,000 divided into 10 groups of 100, each group taking 60 seconds for all of its points to time out).
This step uses SQL Server Reporting Services to create a report with the results. The ICONICS installation comes with several pre-defined report templates, but the user can create custom report templates. For more information, see “Creating New Report Templates”.
ICONICS installations come with pre-created reporting templates, stored in C:\ProgramData\ICONICS\Reporting by default. The AvailabilityReport subfolder contains report templates for the Configured Tags Reports. The UsageReports subfolder contains report templates for Runtime Use Reports. The CoverPages subfolder contains cover pages usable in a Project Document.
When creating your own templates, it is recommended to use an existing report template as a starting point. Copy an existing report and rename it, then edit it from there.
To be able to create new, or edit existing, report templates, you must have the Microsoft SQL Server Report Builder installed.
NOTE: This section discusses only the steps and information unique for ICONICS Project Reporting. For more information on the Microsoft SQL Server Report Builder or SQL Server Reporting Services, consult Microsoft documentation, online help, or tutorials.
Each report template must contain:
Specific set of parameters (see below).
A Data Source pointing to the database which contains the collected data.
One or more Datasets defining a query to retrieving the data from the data source.
For proper reporting functionality, is it important to have a report template containing the following Report Parameters with these properties:
Common Parameters (For All Reports)
|
Name |
Prompt |
Data type |
Allow blank |
Allow null |
|
ProjectName |
ProjectName |
Text |
Yes |
Yes |
|
ProjectVersion |
ProjectVersion |
Text |
Yes |
Yes |
|
ProductVersion |
ProductVersion |
Text |
Yes |
Yes |
|
Author |
Author |
Text |
Yes |
Yes |
|
Validation |
Validation |
Bool |
N/A |
No |
|
LogoFileName |
LogoFileName |
Text |
Yes |
Yes |
|
ImageServer |
ImageServer |
Text |
Yes |
Yes |
NOTE: The Validation parameter determines if the validation columns should be shown. It will be set to True by reports where the user has opted to use the “Validation” feature.
Parameters for Specific Report Types:
|
Report type/module |
Name |
Prompt |
|
Usage |
SnapshotID |
SnapshotID |
|
Configured from AssetWorX |
AscReportID |
{{AssetWorX}} ReportID |
|
Configured from BACnet |
BacReportID |
{{BACnet}} ReportID |
|
Configured from EA |
EaReportID |
{{Energy Analytix}} ReportID |
The specific report parameters above all have a data type of Integer and do not allow null values. They will be used in queries to filter data within specific collection snapshots. Snapshot management is a feature planned for future releases, and it is highly recommended to include these parameters in your reports to avoid the need to edit your reports after upgrading to a version that includes snapshot management. For example, if you want to create a configuration tag report template that contains data from AssetWorX and BACnet snapshots you should specify both parameters in your template.
The LogoFileName and ImageServer parameters will get their values from the Project Reporting engine. If you want to replace the default ICONICS logo with your own, replace DefaultCover.jpg and DefaultSmall.jpf with similarly-sized images. These files are located by default at:
C:\Program Files\ICONICS\GENESIS64\WorkbenchSL\Reporting\Logos
For the Logo image source, use the following expression:
="http://" & Parameters!ImageServer.Value & "/WorkbenchSL/Reporting/Logos/" & Parameters!LogoFileName.Value
During the ICONICS installation (or when using the IcoWorkbenchSqlSetup.exe tool), a data source for Project Reporting data should have been created. If your report template does not already contain this data source, follow these steps:
In the Report Data panel, right-click Data Sources and choose Add Data Source…
Name the data source “IcoReporting”.
Select Use a shared connection or report model.
Click the Browse… button and browse for your server, or enter your server URL (the same one you chose during installation or when running IcoWorkbenchSqlSetup.exe), which should look something like:
http://localhost/ReportServer
In the SCADA_Reporting folder, you should find a Data Source file pointing to collected data.
Click OK.
The Report Template Dataset is a key object for querying the database tables for the collected data and filtering the data if necessary.
The IcoReporting database contains the report data. When building queries for your reports, look for tables and views that start with these prefixes:
Prefix |
Report Type |
Source |
|
R_ASC_* |
Configured Tags Report |
AssetWorX |
|
R_BAC_* |
Configured Tags Report |
BACnet |
|
R_EA_* |
Configured Tags Report |
Energy AnalytiX |
|
R_TU_* |
Runtime Use Report |
Runtime Collection |
The following is an example of how to query for AssetWorX tags in a Configured Tags Report template:
In your report template, make sure you have correctly set the parameters and data source.
In the Report Data panel, right-click Datasets and choose Add Data Source…
Give the dataset a name.
Select Use a dataset embedded in my report.
Choose the IcoReporting data source.
Leave the Query Type set to Text.
Click Query Designer… to open the query designer wizard.
In the R_ASC_AvailabilityData_View View, check the Name, ConfigurationPath, Description and Value columns.
Click OK.
In the “Dataset Properties” dialog, you should now see your generated query. Add a WHERE clause manually to ensure that data only for the specific report is retrieved. The line to add is:
WHERE ParentID = @ParentID
Select Parameters in the side panel and bind the “@ParentID” parameter to a value of “[@AscReportID]”.
Click OK to the Dataset Properties dialog.
For more examples on how to query this data, see the datasets in the existing report templates.
The last step is to insert the objects that will visualize the collected and queried data. Below is an example of how to insert a table.
Go to the Insert ribbon of Report Builder.
Click Table à Table Wizard in the Data Regions section.
Select an existing dataset that you created earlier and click Next.
Drag and drop the available fields into the Values section. If desired, use the Row and Column sections to aggregate fields. When your fields are arranged as desired, click Next.
Preview your table and change options as desired. Click Next when finished.
Choose a style and click Finish.
See Also: