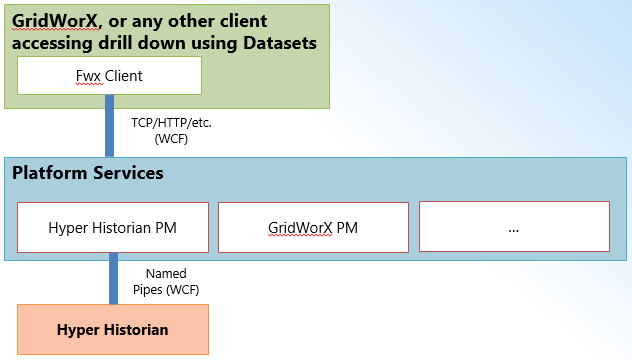
Hyper Historian features a BI Drill Down capability, providing simplified data navigation in analytics-based charts. This capability uses a unified API between server and client which utilizes methods, browse requests and data sets.
As of Version 10.9, the Drill Down capability uses Hyper Historian as the Drill Down Server and GridWorX Viewer as the Drill Down Client.
Drilldown Architecture

Each Drilldown Space consists of:
1..N tree organized dimensions (time, assets)
0..M scalar property set (e.g. Min, Max, Avg)
Navigation is client dependent. Users can Drill Down (move) in one single dimension at a time.
Hyper Historian has two basic dimensions:
Assets (folders and variables organized in a tree structure)
Time (time series data)
Performance Calculations are used to create summarized values.
Drill Down variables are exposed in a separate folder in the Hyper Historian provider in the Workbench and are accessible via the standard data browser.
Server-side configuration of Drill Down within Hyper Historian requires the following:
Calendars - These are used to specify:
Time period(s) to calculate Drill Down values
Type of Calendar, Time Zone, Beginning of Year
Drill down Variables - These are used to define:
Asset and Time Drill Down Dimensions
Source Data Variables
Aggregations to Calculate (Arithmetic, Time-weighted)
Drill Down in GridWorX utilizes GridWorX Charts, via chart configuration dialogs, for plotting Drill Down data. A Drill Down Wizard is also provided to guide users through Drill Down chart configuration.
To Configure Drill Down in Hyper Historian:
First, be sure to have a structured configuration of Hyper Historian Tags or Calculated Tags in the Hyper Historian provider in the Workbench.
Go to the Drill Down section and create a new Calendar under Calendars. Don’t forget to select the Calendar Type.
Create a new Drill Down Variable under Variables. You also need to set the In Group (Logging Group), Calendar and Sampling Time under the Time Dimension tab.
Next, switch to the Asset Dimension tab and select the Root Folder of your Hyper Historian structured configuration. The Drill Down Variable also needs at least one Asset Level configured in its Asset Dimension.
Name – Name of the level
Display Name – Display name of the level visible in the client GUI
Source Point Name – Name of the meter tag (e.g. Attendance, Gas, etc.). NOT its browse name.
As an example, based on our Hyper Historian Tags configuration, we need to set three nodes; where the World (ICONICS) is the FIRST asset dimension level, States (CZE, ITA, USA) are the SECOND asset dimension level and Regions are the THIRD asset dimension. You need to differentiate if you are using Hyper Historian Tags (Attendance) or Hyper Historian Calculated Tags (=Attendance). You also need to maintain the order of the Asset Levels.
Now we should be all set with Hyper Historian configuration. Just make sure that you have the proper license with enough license points and go to GraphWorX64.
In GraphWorX64, add a new GridWorX Control to the GraphWorX64 display and open its configuration.
Delete the default Grid.
Right-click on Tab and select “Add Drilldown Chart Wizard”.
Browse for the Drill Down Variable, which we created in the Hyper Historian configuration and click OK.
You need to validate your Variable. Click on the green icon:
Validating Your Drill Down Variable

Click Next then click on the Auto button. It will automatically assign the mappings. This adds Time Dimension under Categories which displays data based on time.
Click Next and set the period time for which you would like to see the data. In our example, we selected the month of December in the year 2015.
Click Next and select for which area you would like to get data. In our example, we are interested in the Czech region.
Click Next and select which dimension levels you would like to have calculated. You can select from Minimum, Maximum, Average and Sum.
Next, select the Drilldown chart style and hit Finish. The Drilldown Chart should now be created.
Click on Runtime to see the data.
You can change the time period using breadcrumbs, where you can define the Year, Month, Day, Hour, and Quarter-Hour (green rectangle).
You can select which Dimension levels should be displayed (first red rectangle).
You can select the area for which you would like to see data (second red rectangle).
You can easily switch the Asset Dimension with the Time Dimension in the Mappings and then you can navigate by Areas for a specific time interval.
You can also use the breadcrumbs for drill-down or can click directly on the bars inside the chart.
See Also: