![]()
![]()
Table and categorical chart widgets include a "pivot" functionality. This feature is only available for AnalytiX-BI data sources. Pivoting a dataset involves taking unique values from one column and turning them into multiple columns or series in the output.
To pivot a table widget, select one dataset column with an aggregate for the Columns field and one dataset column for the new Pivot field. If you would like to display more than one row, select a third column for the Group By (Rows) field. The unique values provided by the Pivot column will be used for the table's column headers. If Group By is used, the unique values provided by the Group By column will be used as an additional first table column, identifying each row. The aggregated value for the Columns column will be used in the cells.
When pivoting, the Columns field must contain only one column, and it must be aggregated.
To see an example of pivoting using the example Northwind AnalytiX-BI data model, follow these steps:
Add a table widget to your dashboard.
In the data browser, browse to AnalytiX > BI Server > Data Models > Northwind.
Select the table widget and open the Widget Settings panel.
Expand OrderDetails > Quantity and drag Avg into the Columns field.
Expand Customers and drag Country into the Group By (Rows) field.
Expand Categories and drag CategoryName into the Pivot field.
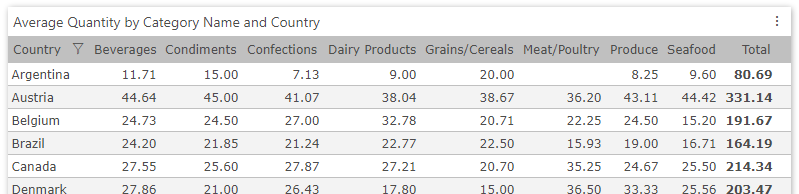
You should now have a table showing the average quantity of each product type ordered by customers in different countries.
Table Example
To pivot a categorical chart widget, choose a dataset column for Category (X-axis) as normal. Choose an aggregated dataset column for Value (Y-axis). Then choose a third dataset column for Pivot. One series will be added to the chart for every unique value of the pivot column.
Note that there are some limitation in using the pivot chart. These include:
Only one Value (Y-axis) can be chosen.
Must be no more than 40 unique items in the pivot attribute
Can only sort by Category (X-axis)
"Top" feature is not supported with pivot
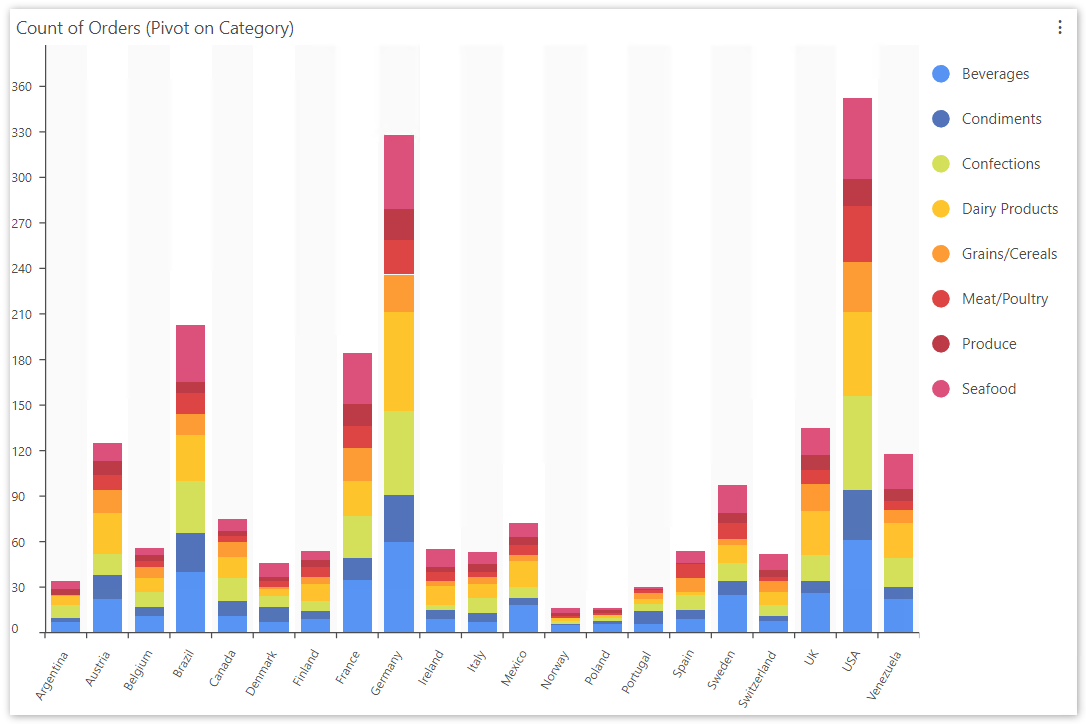
Categorical Chart Widget with Pivot Example
See Also:
Tables and Symbols as Dashboard Links