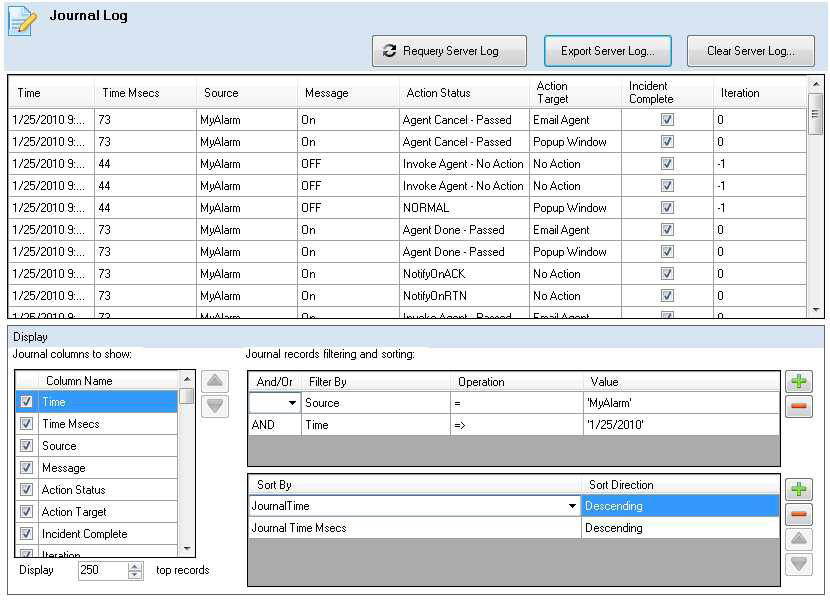
The Multimedia Server journal log records the activities of an active database and how the Multimedia Server is processing alarms and multimedia agents. You can access the log from the AlarmWorX Multimedia tree in the Workbench: right-click Server Journal Log in the Project Explorer under System Tools, and select View Multimedia Server Log.
When you start the AlarmWorX Multimedia Server, you should use the Multimedia Server journal log to verify that the server is connected to the configuration database. The journal log lets you view the activity of the Multimedia Server during runtime. Check the log to make sure the Multimedia Server is receiving alarms.
|
|
Note: When an action set is modified, all corresponding records in the journal table are deleted. If this occurs while the server is running, the server will be temporarily stopped. |
Sample Journal Table

If there is too much information shown in the Journal Log, you can modify what is shown by using the following features:
Journal Columns to show – Add/Remove columns displayed in the log. You can also use the up and down arrows to sequence the columns.
Display XXX top records – Set the maximum number of records to be displayed in the journal log.
Journal records filtering and sorting - Apply different combinations of filters to limit the display to log entries for a certain Source or Action Target, for example. You can even filter so that only certain field values appear in the table.
Sort the log by selecting from the Sort By and Sort Direction drop-down lists. You can also sort the log to sequence events in descending order so the most recent are on top, for example. You can also create a customized journal sorting order and choose the columns to sort by.
See also:
Starting the Multimedia Server